Canvas View
Please Note: It is not possible to delete any of the pre-created templates. Migration planner is disabled if the physical machine count is more than 3500 nodes
Getting Started with the Migration Planner
The Migration Planner will assist you in creating and executing a migration plan by visualizing all available machine- and application-level data.
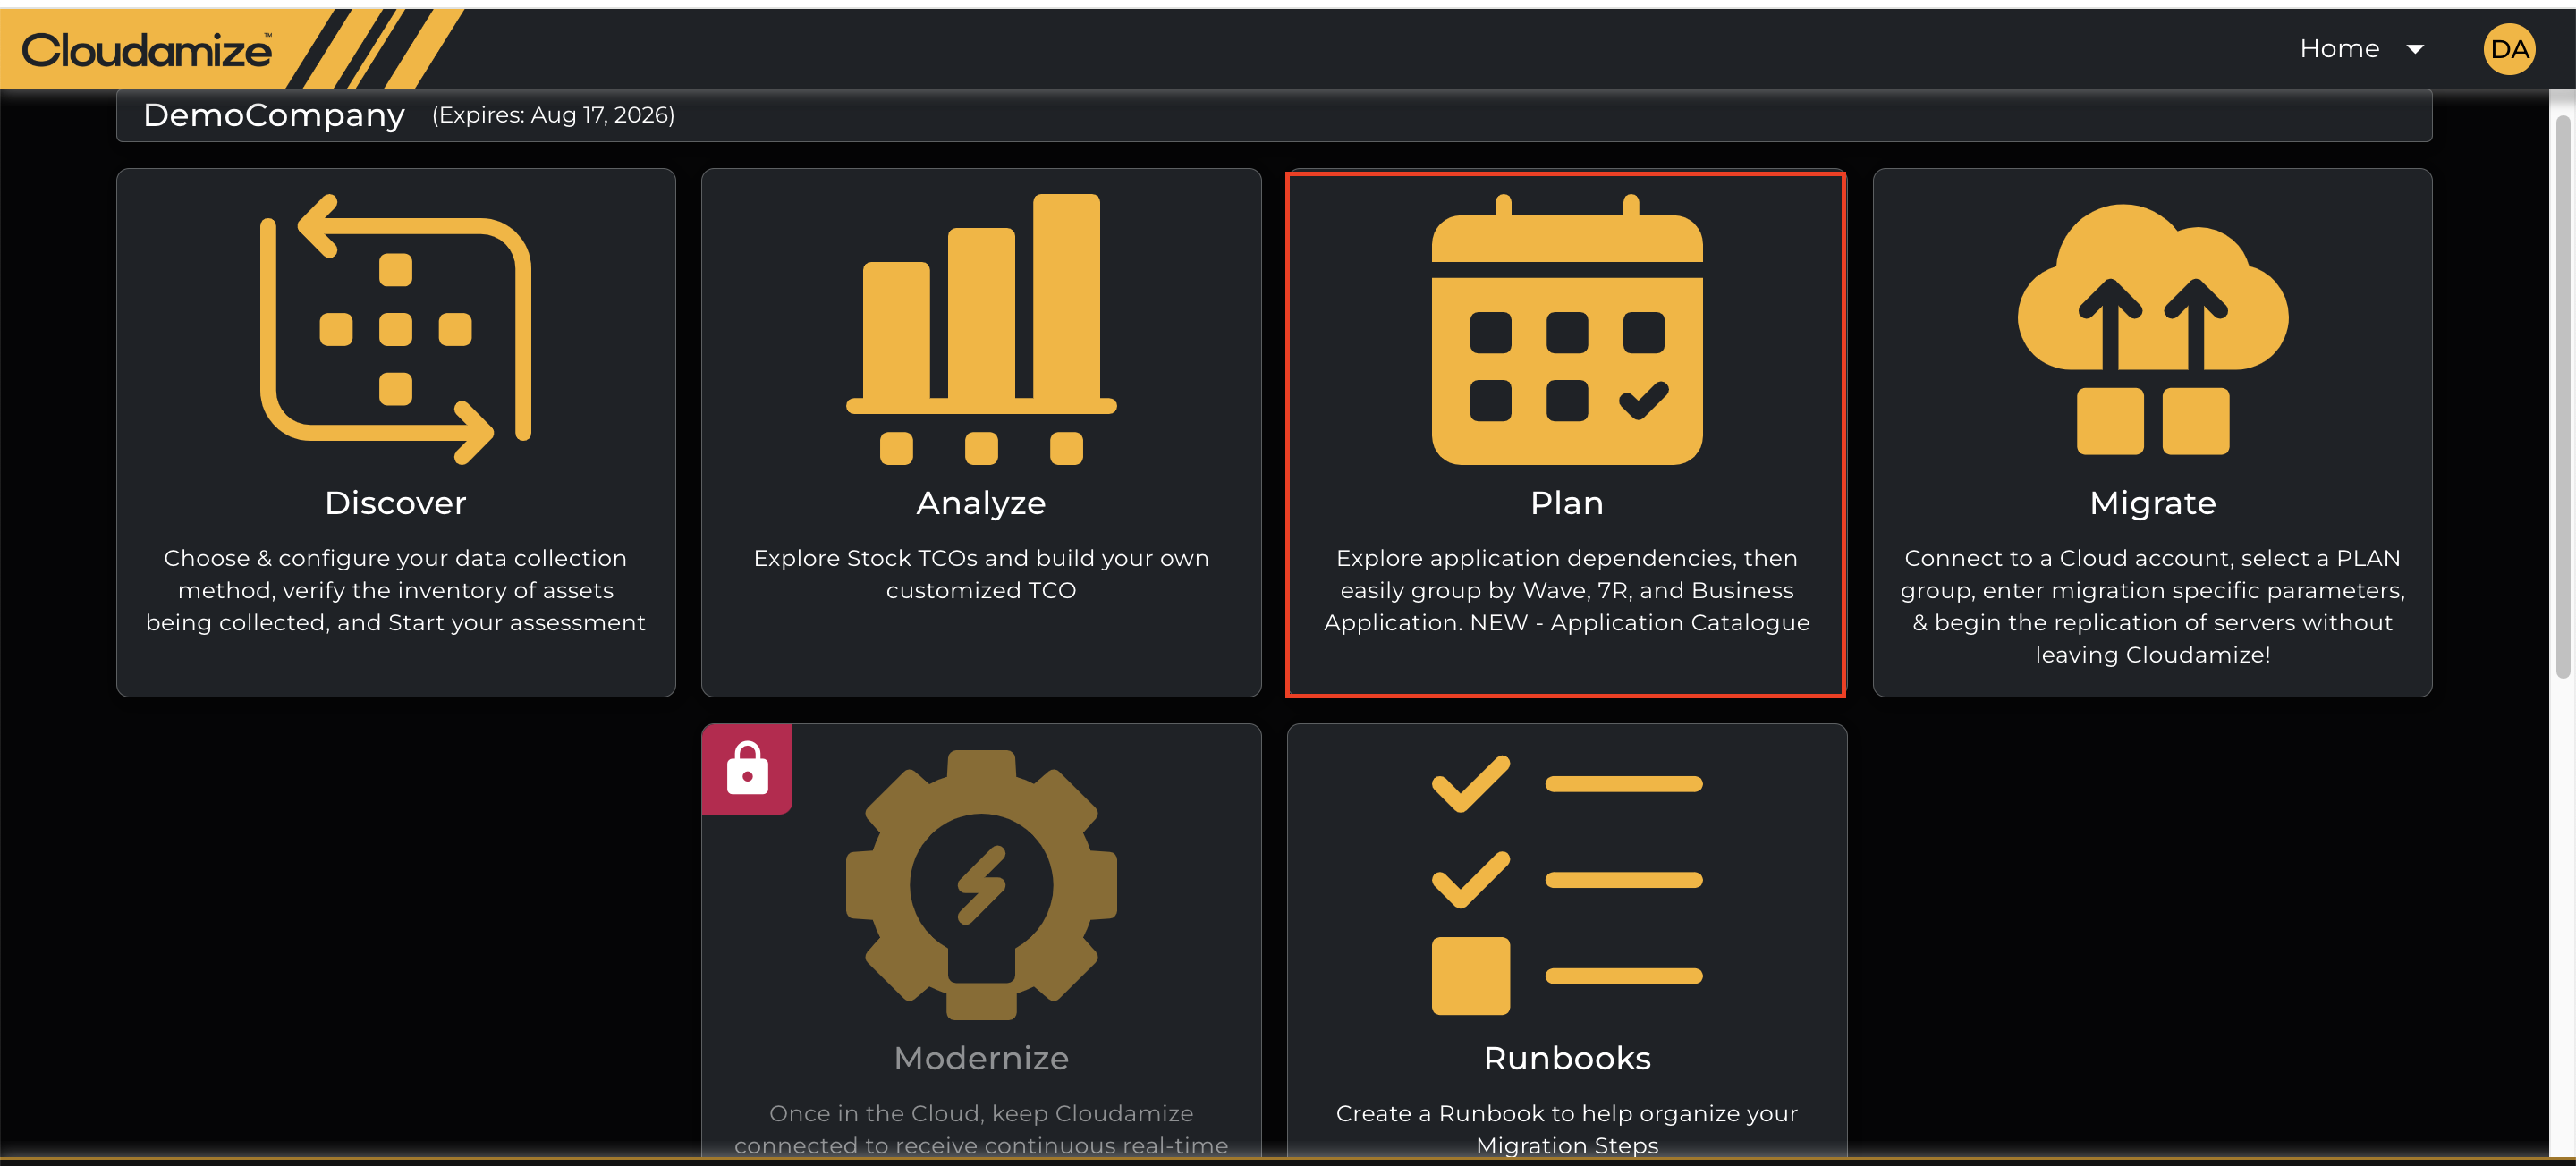
As soon as you log in to console.cloudamize.com, Click on the ‘Plan' option under 'Home’ as shown in the screenshot below.
The below screen pops up, and then select ‘Application Canvas’ as shown in the below screenshot. The page will load the Migration Planner. The large White Square in the center of the screen is the Canvas.
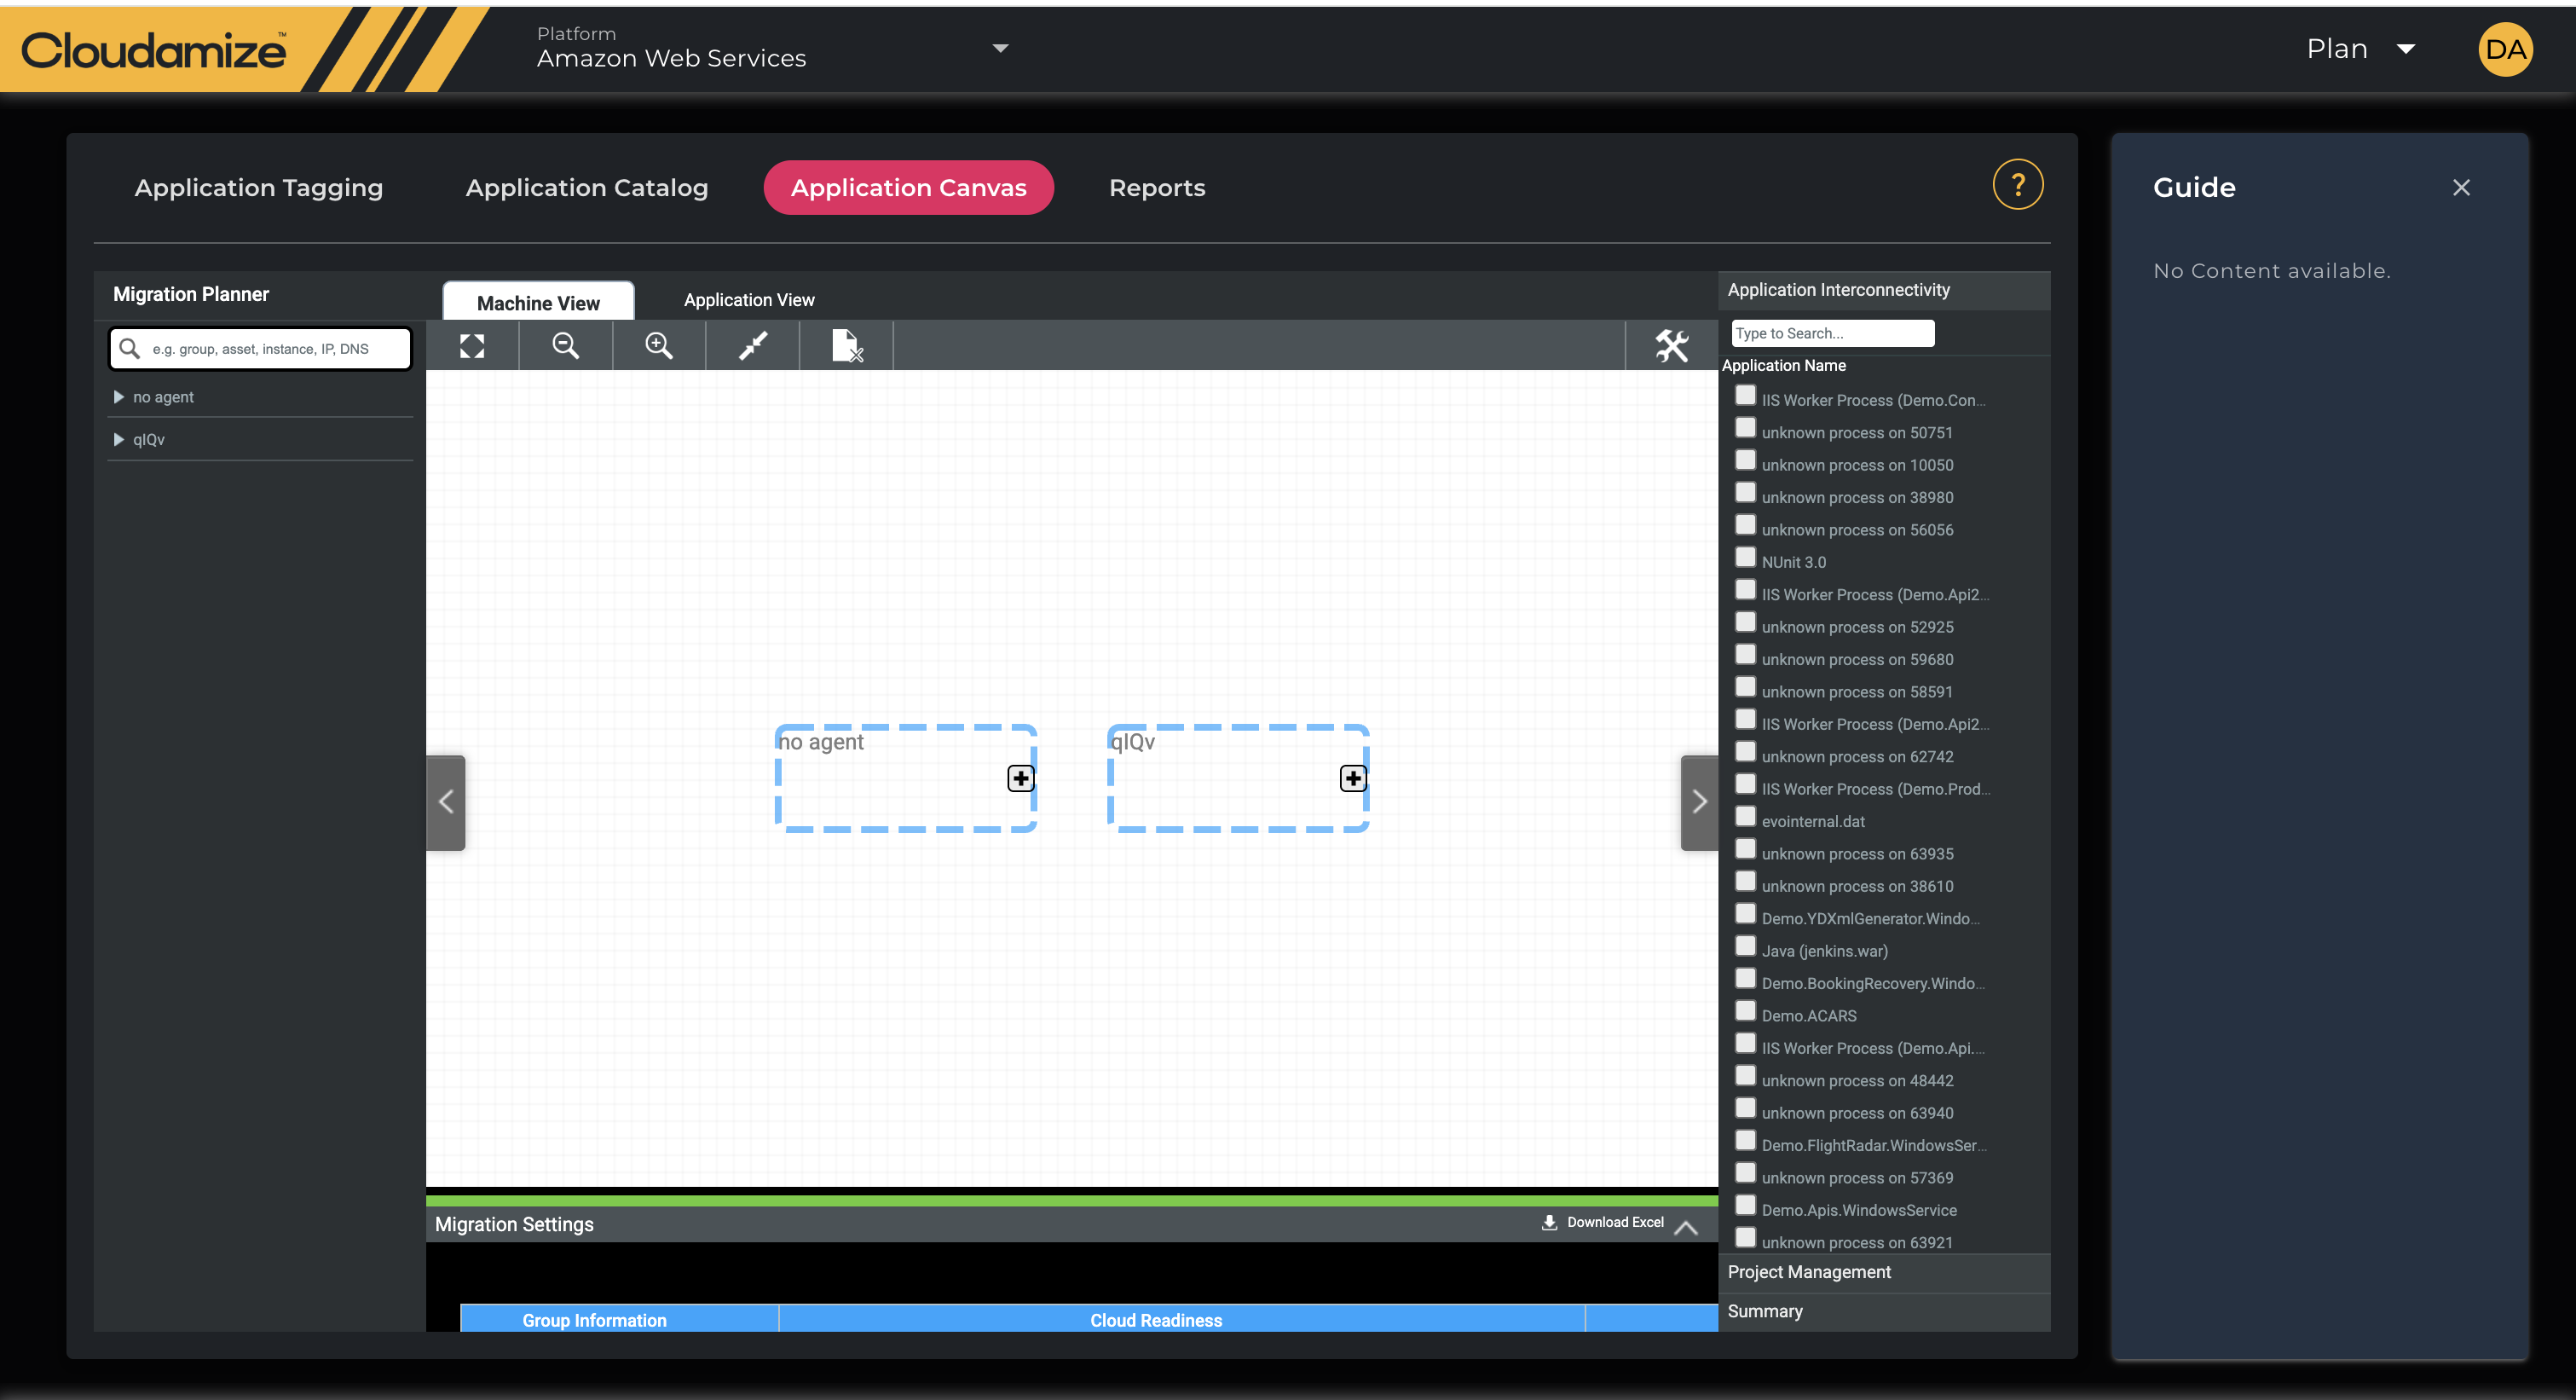
Along the top of the canvas, you will see buttons to:
 | Fit In Bound |
 | Zoom Out |
 | Zoom In |
 | Collapse All Assets |
 | Clear All, which will clear any mapped dependencies. |
On the right-hand side is the ‘More Tools’ button, which will present you with more options:
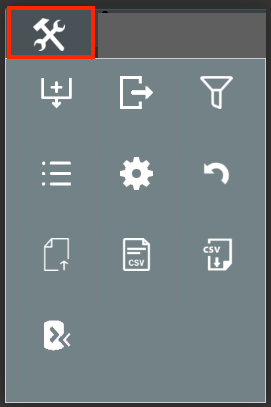 |  | Advanced Filtering |
 | Migrate Your Environment | |
 | Build Machine-Based Move Groups | |
 | Build Application-Based Move Groups | |
 | Application Inventory Settings | |
 | Undo Migration Planner Changes | |
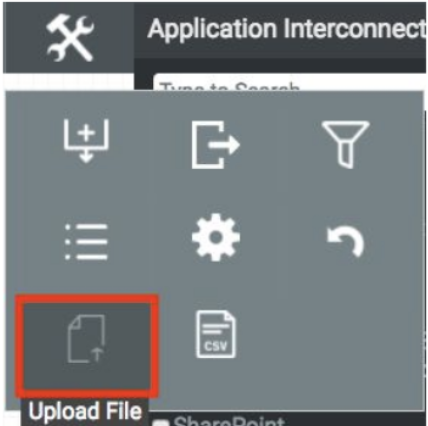
 | Upload File | |
 | CSV Builder | |
 | CSV Exporter | |
 | SQL Server and License Usage |
We will explore these buttons further as we move through the Migration Planner.
The Blue boxes on the canvas are groups, the Grey boxes inside are assets, and inside the assets are individual machines, or nodes.
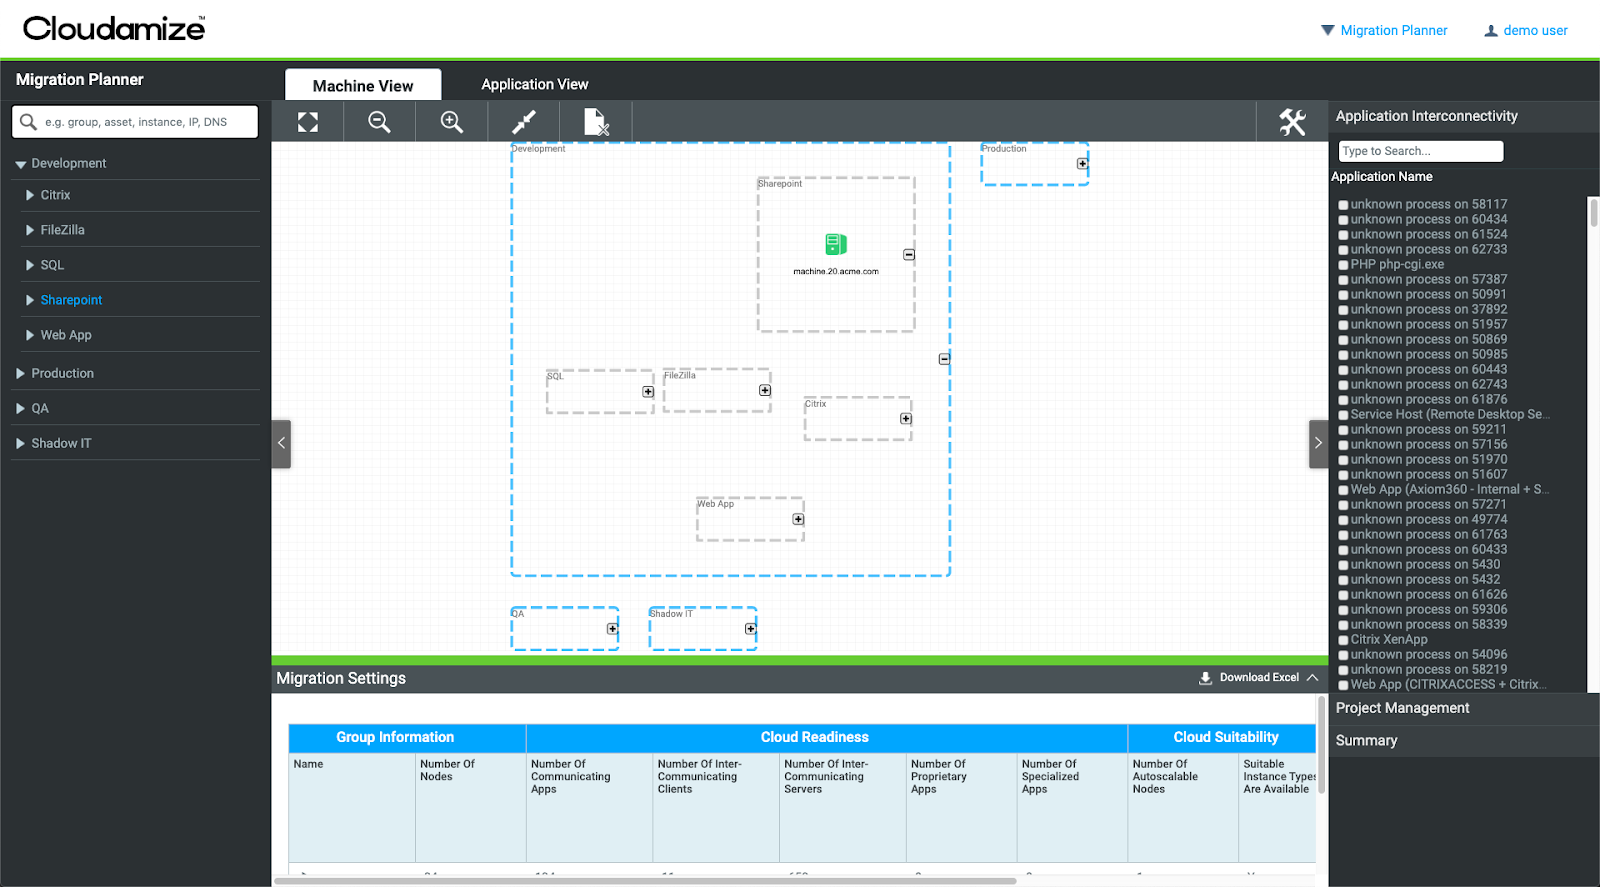
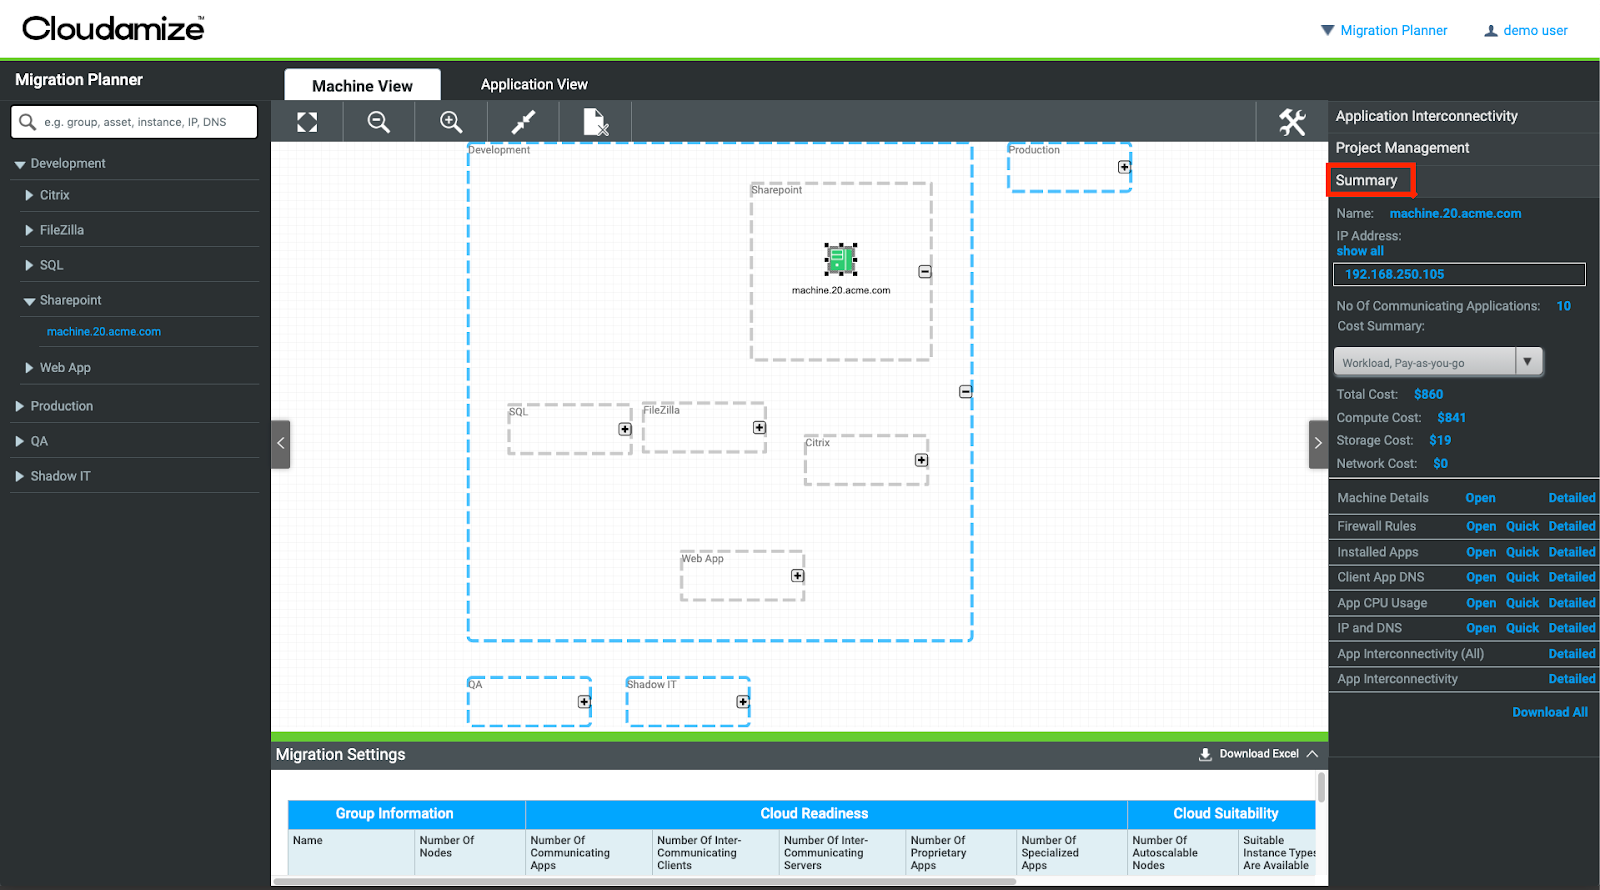
By clicking on an individual node, you will see all available information for that node under the summary [tab] in the panel on the right side of the screen.
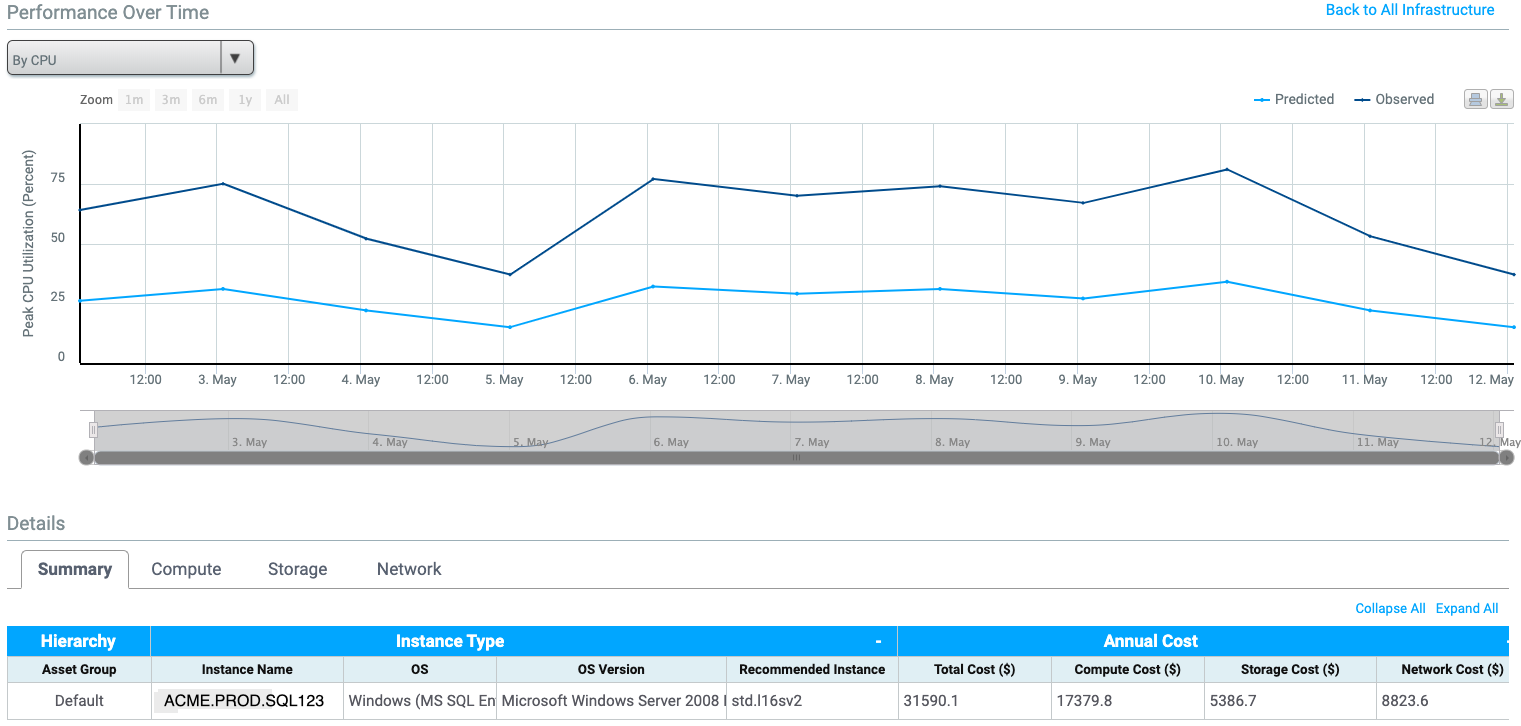
 | By right-clicking on a node, you can see a performance breakdown of that machine |
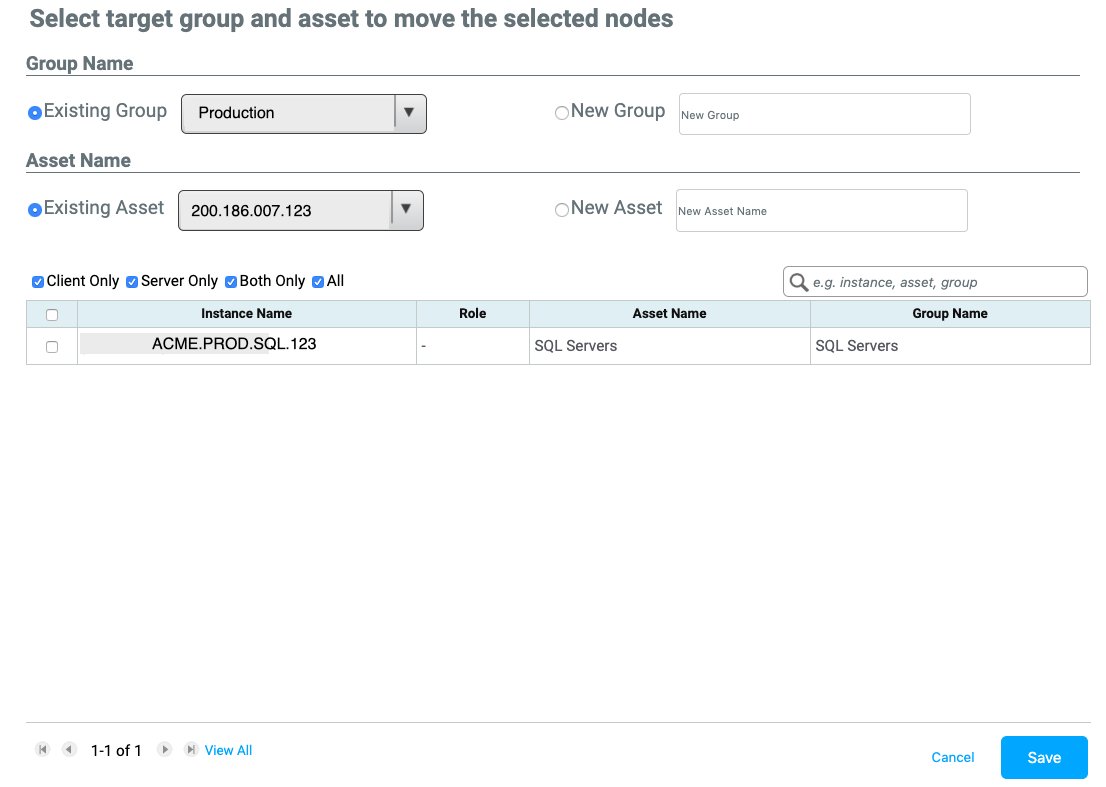
 | You also have the option to move that node from its current group to another group or asset |
The panel on the left-hand side of the page will allow you to view those same groups and assets, as well as drill down to specific machines. Above the group lists is a search bar that will allow you to search based on a number of criteria, such as, group, asset, or machine name, along with DNS, IP Address or Operating System name. | 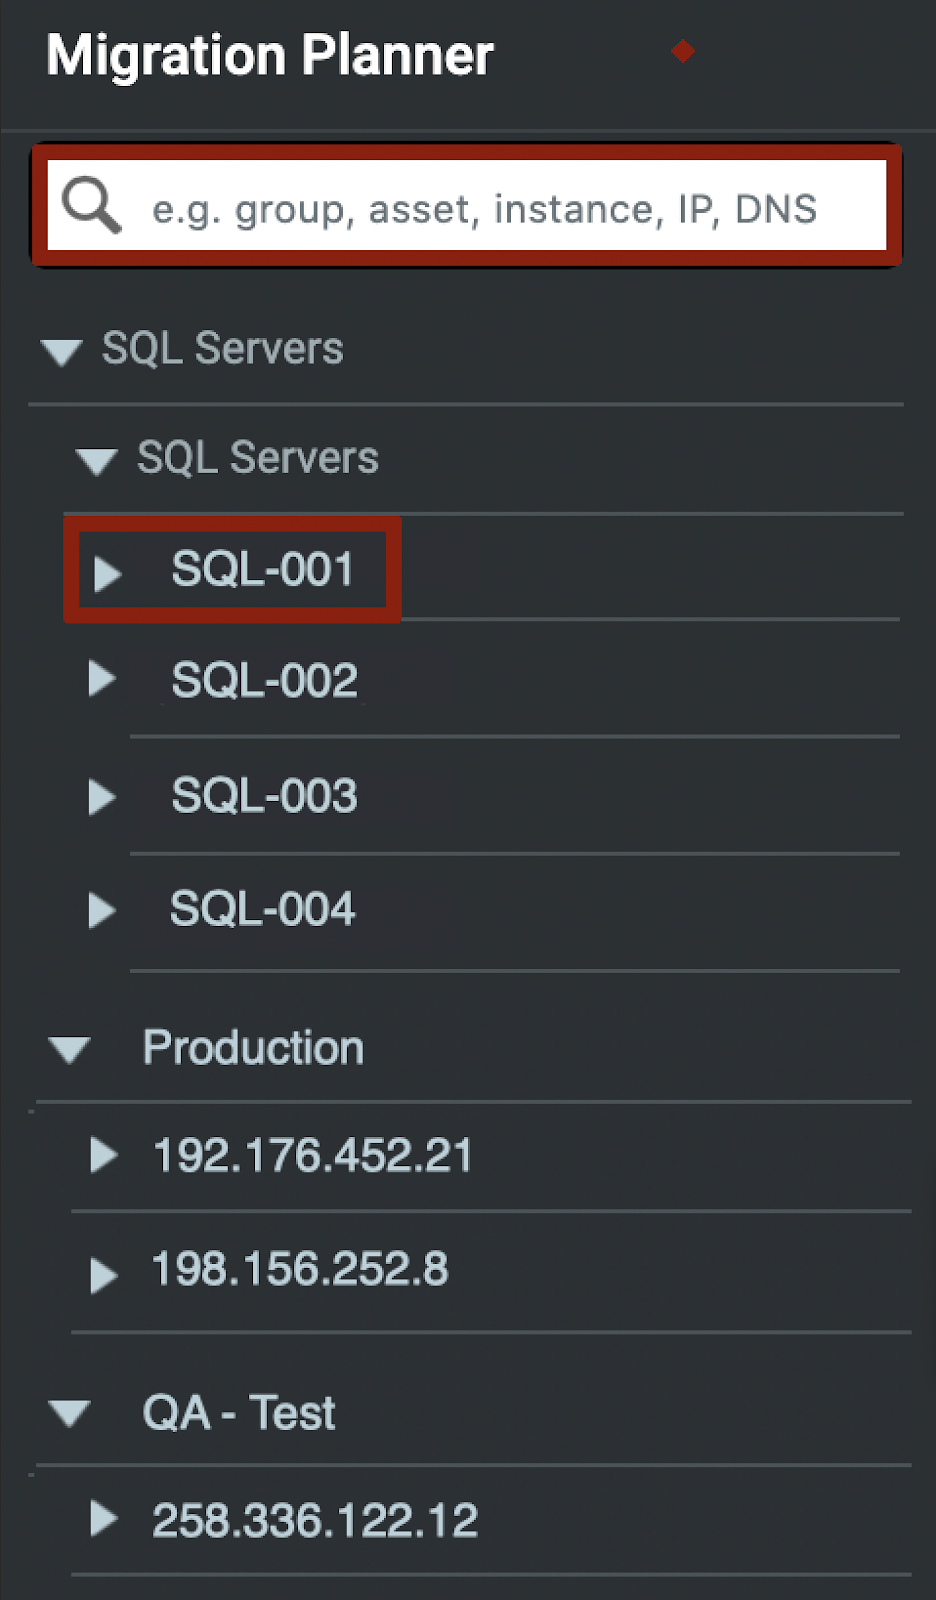 |
The panel on the right-hand side of the page is broken down into three categories, Application Interconnectivity, Project Management, and Summary.
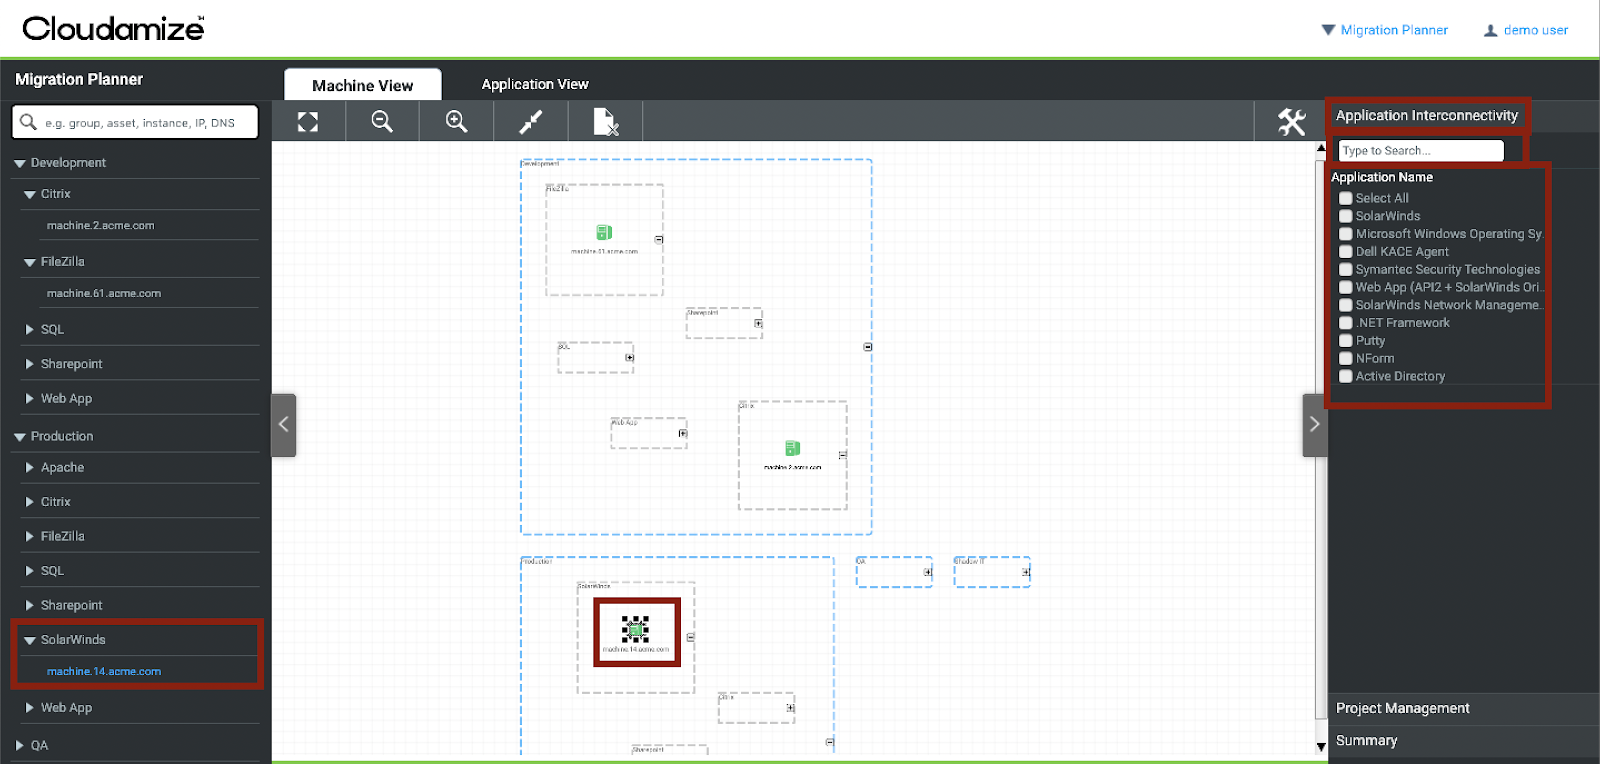
Under the Application Connectivity [tab] you can find a list of all the applications observed during the Cloudamize Assessment. By clicking on an asset, you will see the applications specifically within that asset. And if you click on an individual node, you will see the applications specifically found on that node. The search bar at the top will also allow you to find a specific application in a group, asset, or a single node.
| |
 |
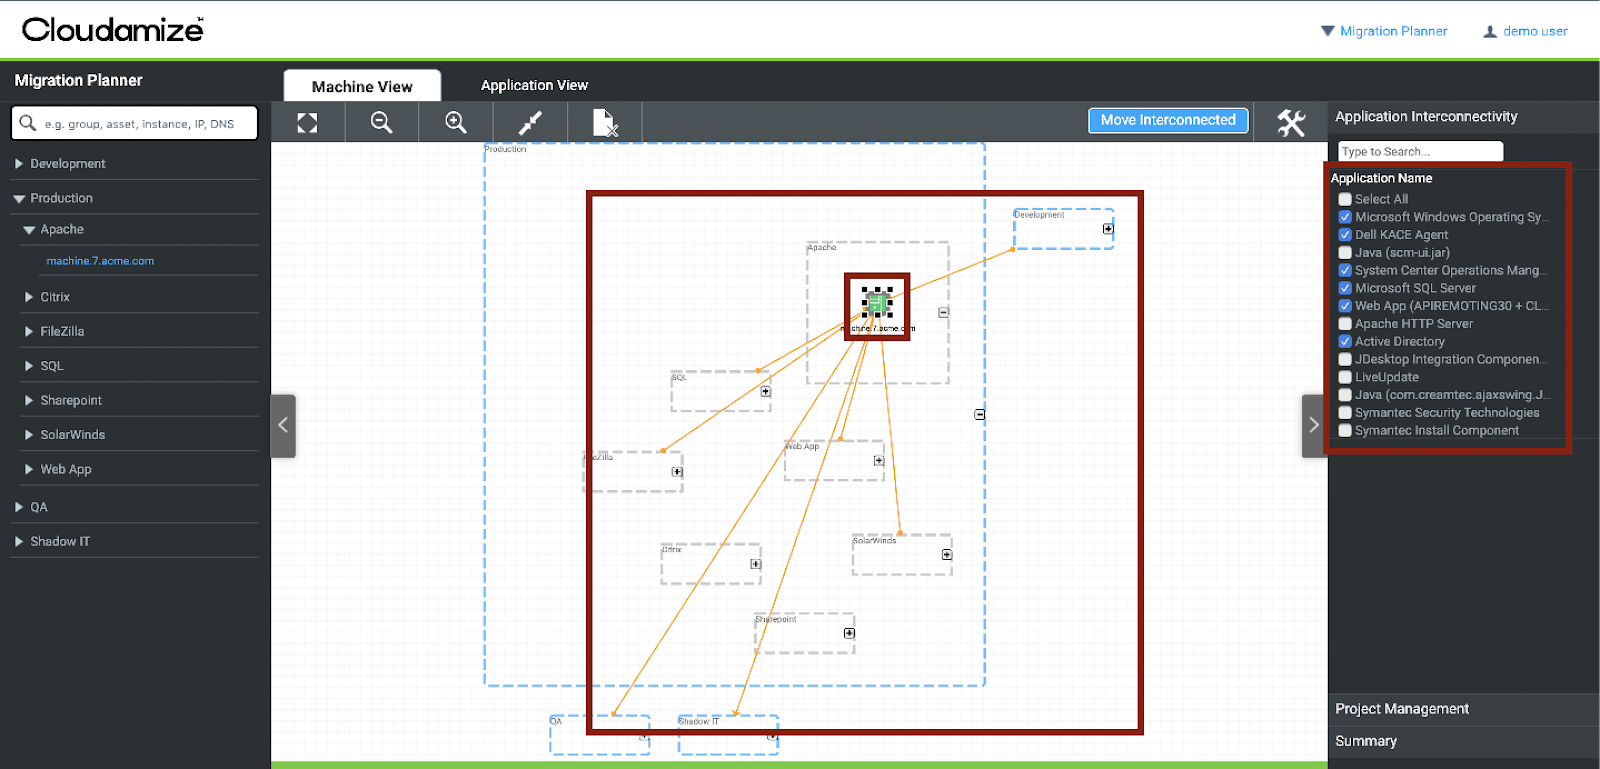
After selecting any or all of the applications, you will see that the communication between nodes has been mapped out on the canvas. Additionally, by selecting an asset or a node, you can select any or all of the applications and view the interconnectivity of that application. | |
 |
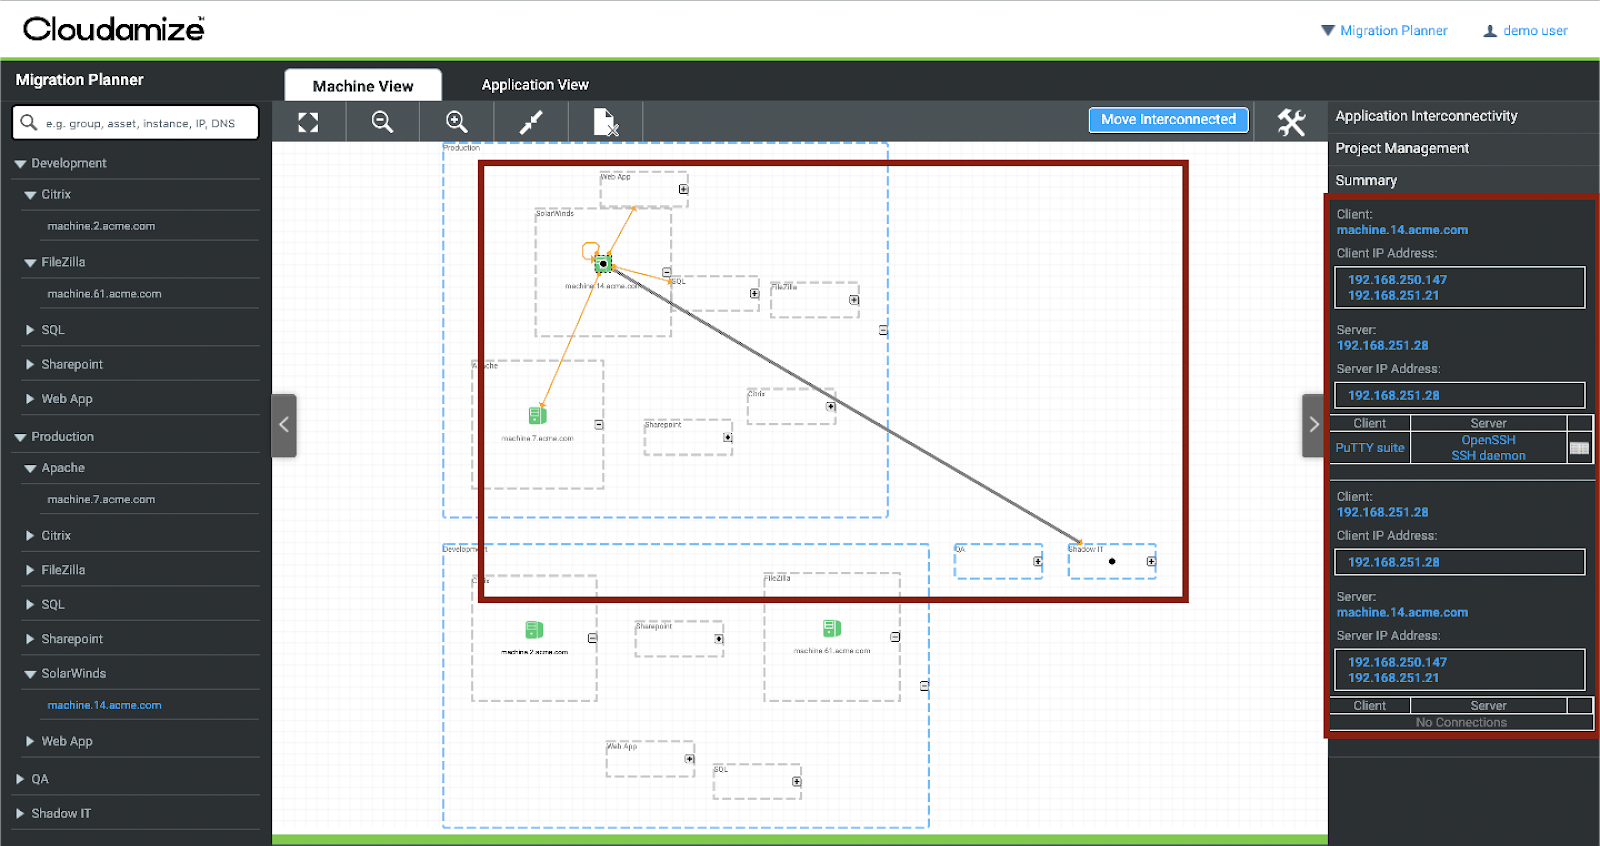
The arrows that appear on the canvas are either bi-directional, or uni-directional depending on the server to client communication direction. By clicking on an arrow, you will be presented with the Client Name, Client IP Address, Server Name, and Server IP Address. | |
 |
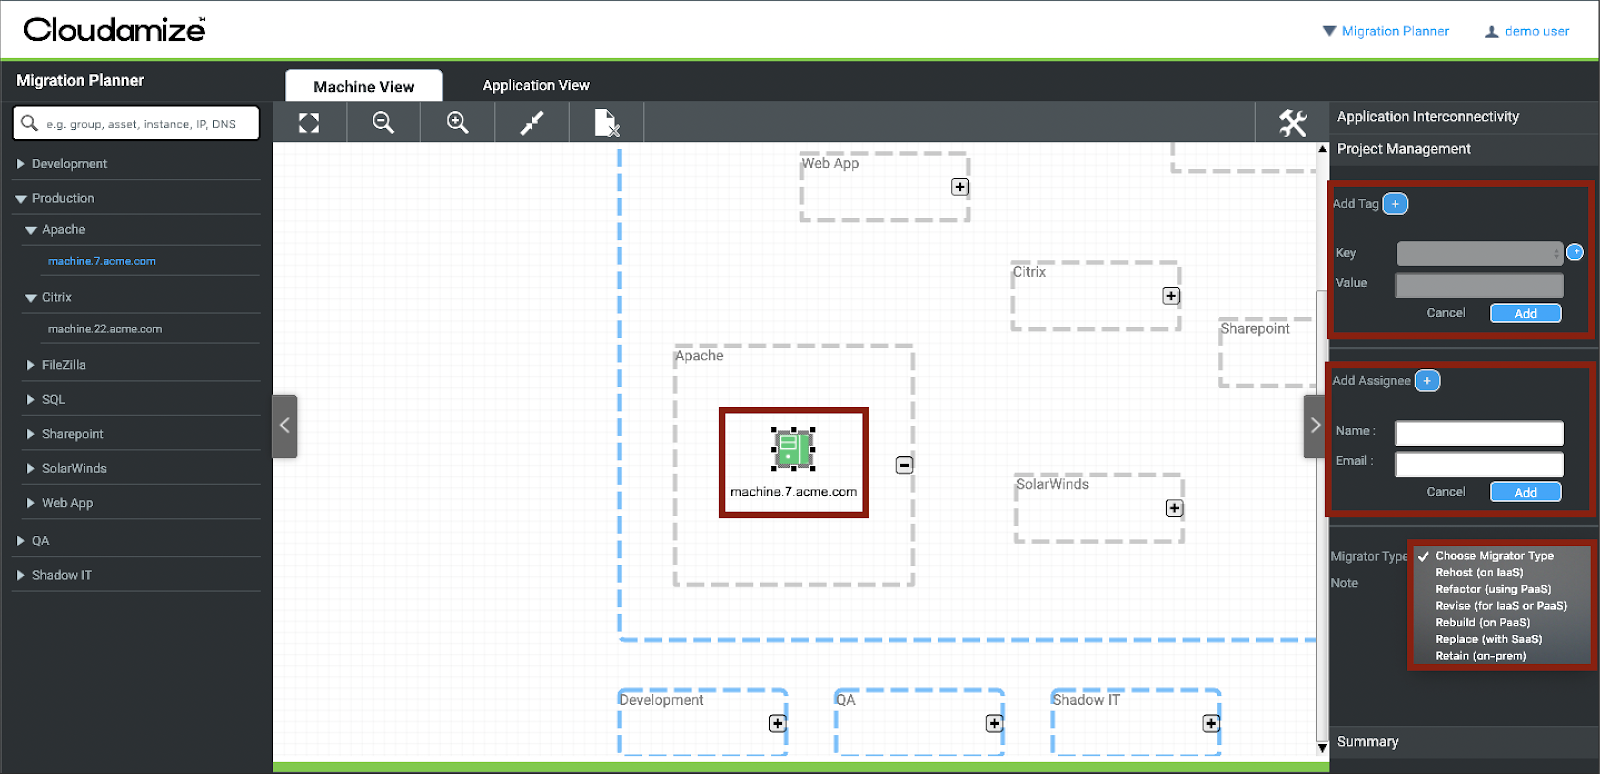
The Project Management [tab] allows you to assign tags, owners, migration type, and any other notes. You can later search based on these tags and build migration groups. You can use these tags to identify machines and create groups or assets. Tags can also be imported via CSV. For large environments, Cloudamize recommends using this functionality. | |
 | |
The Summary [tab] is where you will find a detailed breakdown of groups, assets, and nodes. Information such as IP Address, Number of Nodes, Number of Communicating Applications, Cost, as well as a variety of reports which we will detail further is available for you to review. |

How to Use the Application Inventory Settings
The goal of Application Inventory Settings is to help you alter the applications that you wish to consider for migration. You can hide selected applications for analysis to cut down on noise, and focus only on those applications that fall within the migration scope.
To make adjustments, click on the More Tools button, and select Application Inventory Settings. | 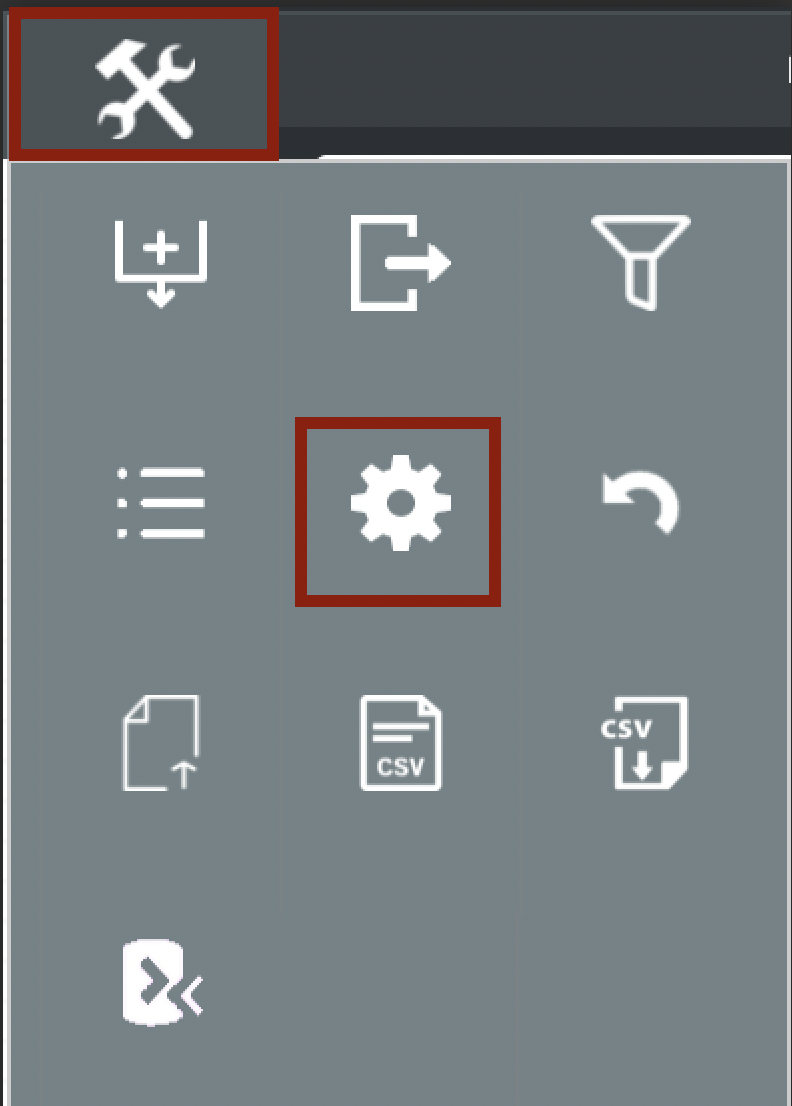 |
A new window will open allowing you to view all processes in the environment, and choose which should be considered for migration. First click View All at the bottom of the page to ensure you can see the entire list of observed processes |
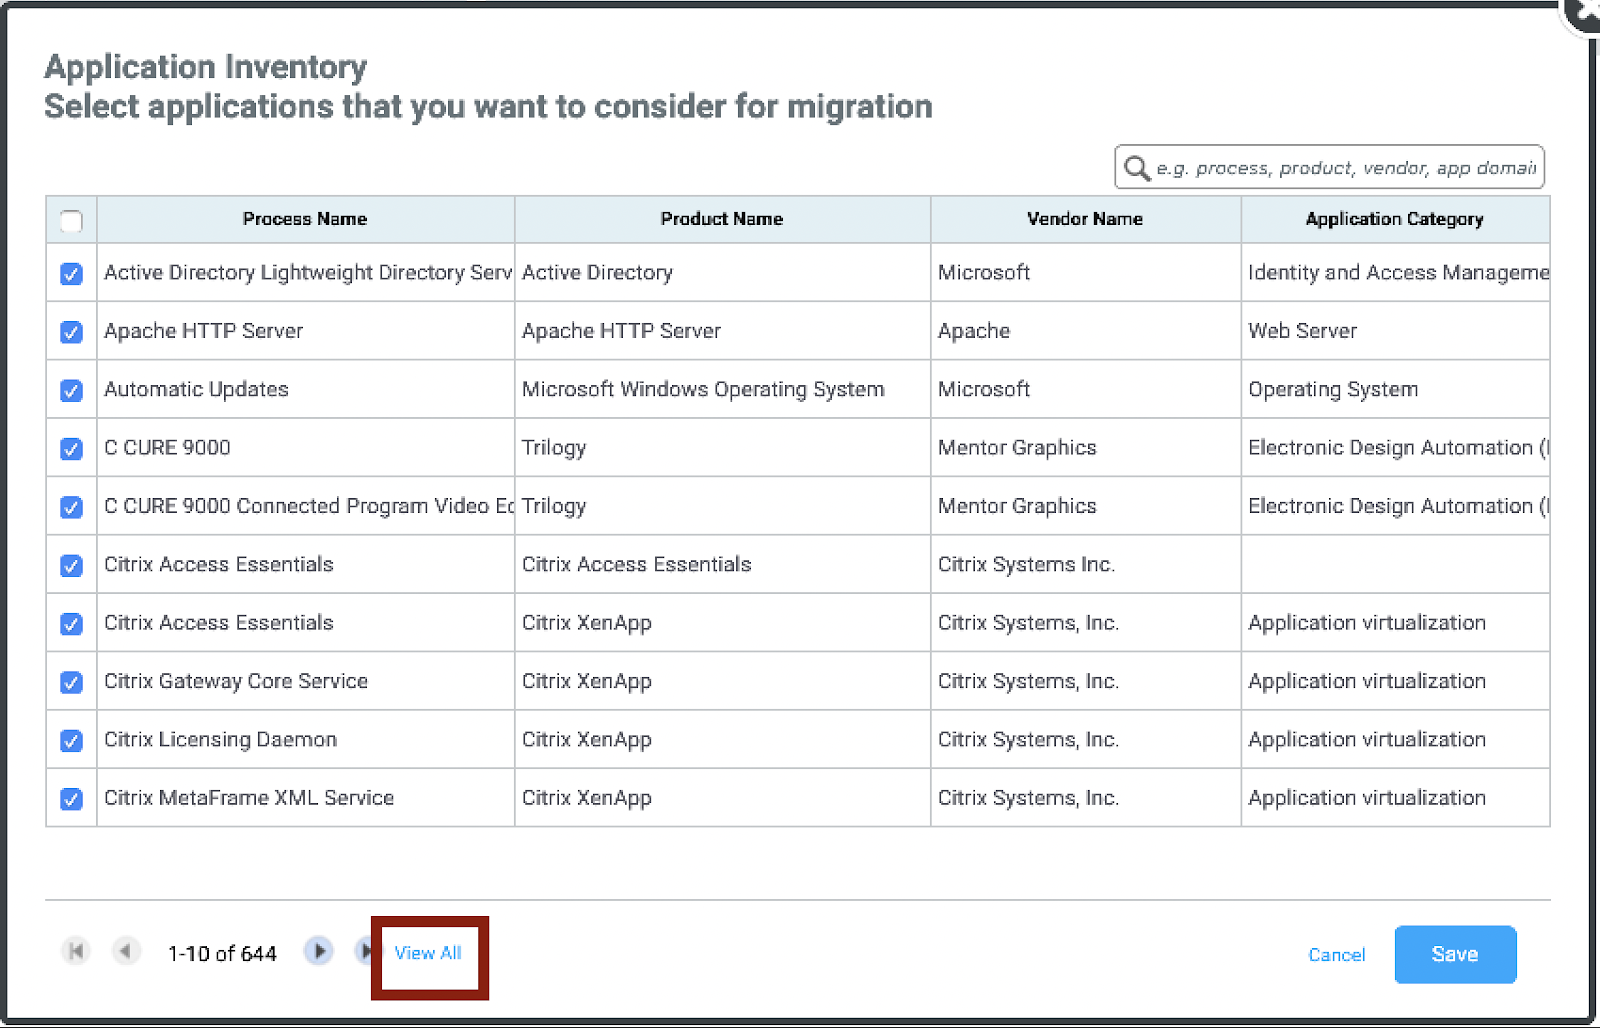 |
The first column, Considered (Check Box), will allow you to select which applications should or should not be considered for migration, by default Cloudamize will remove certain processes from consideration based on best practices.
Some items which you may see that are not selected for consideration include Internet Explorer, Firefox or Active Directory Web Services.
You have the option to include, or exclude these and any other services.
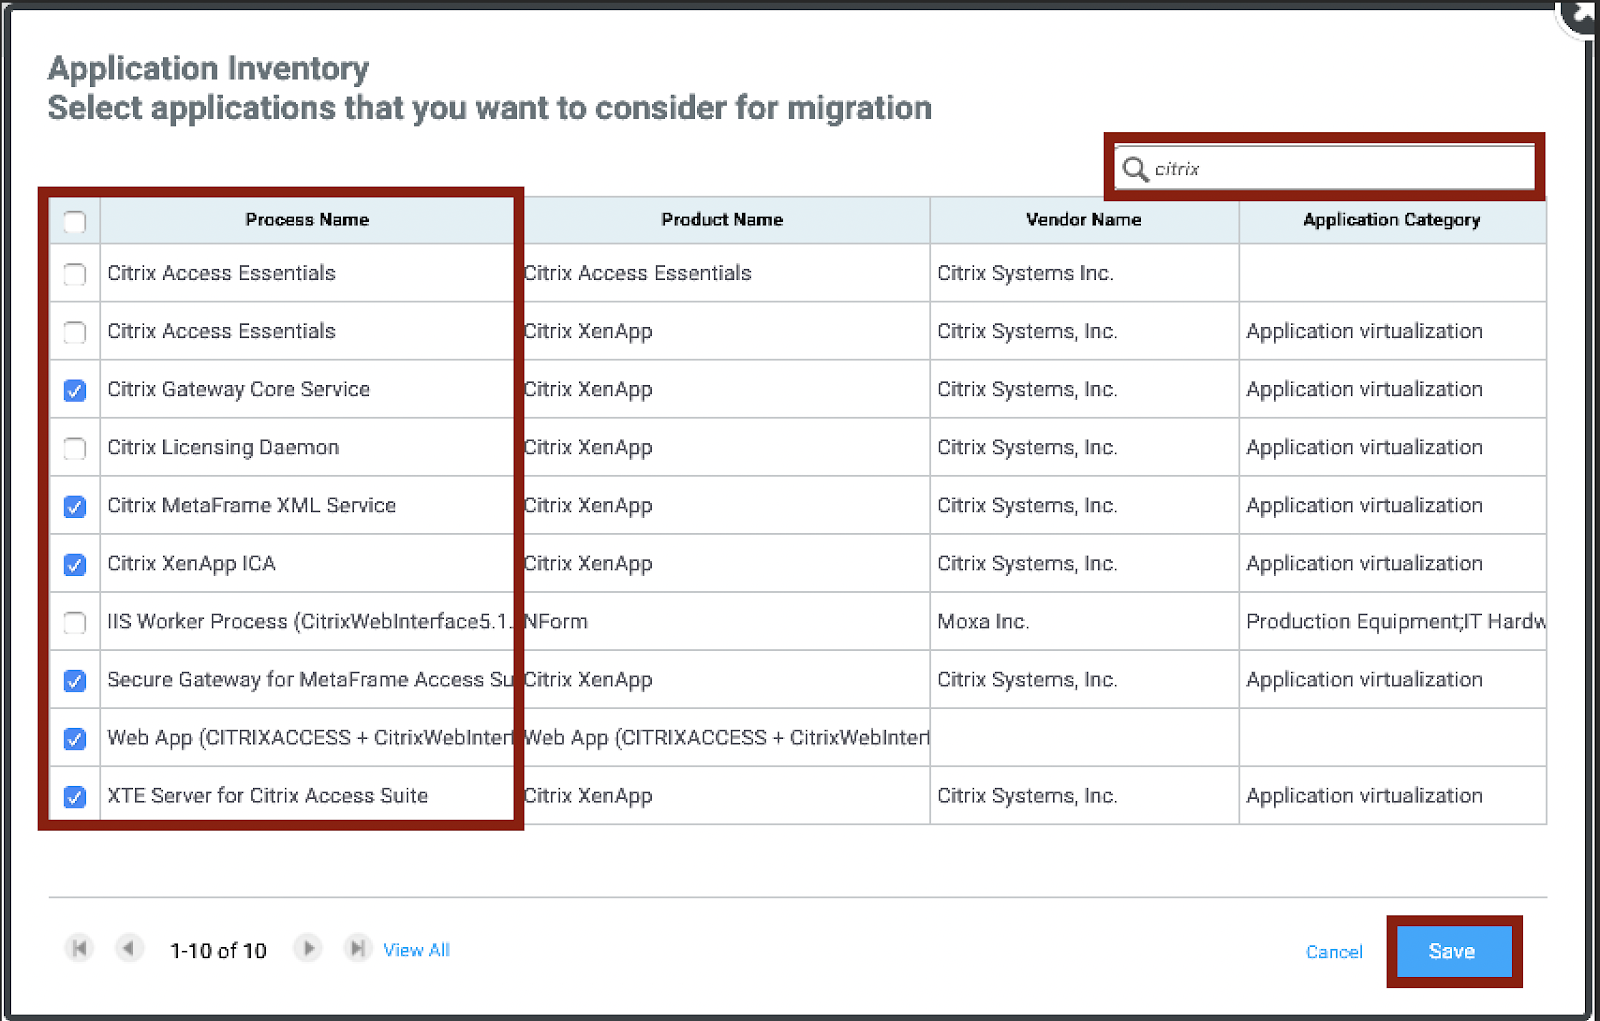
Should you want to search for and filter a specific process, you may do so using the search bar in the upper right corner of the window
 |
For example: Once finished press Save | |
 | |
After confirming your selection, you will be returned to the canvas. Those changes will be applied to the canvas, as well as the Application Interconnectivity report. This will allow you to specifically focus on the applications in scope for migration. | 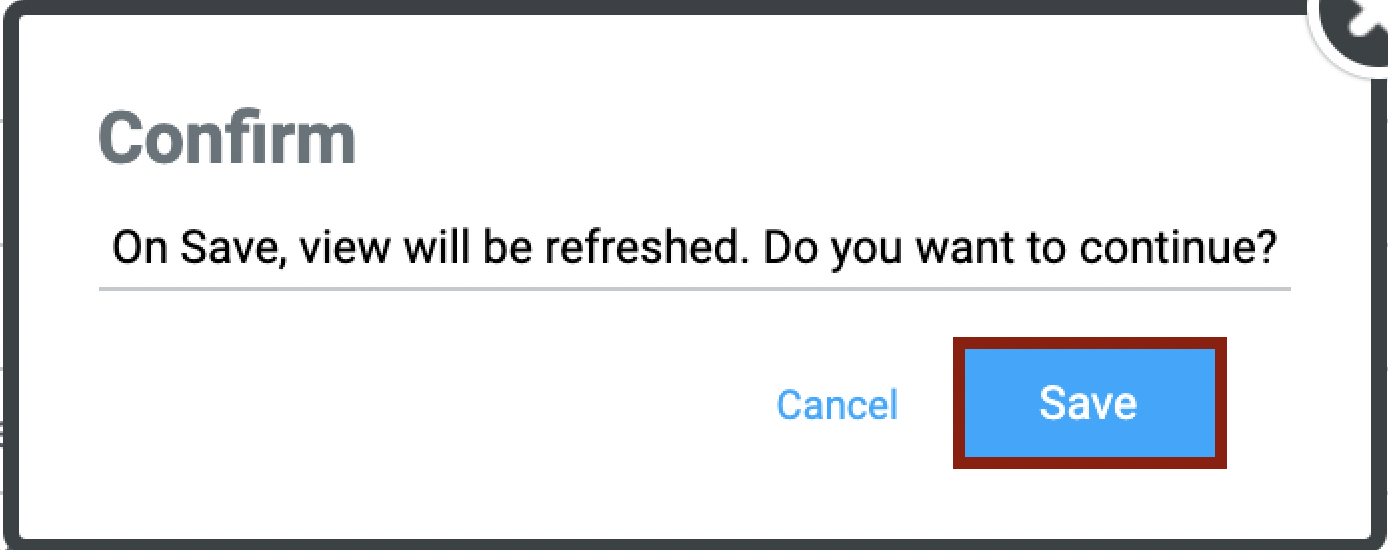 |
Build Application-Based Move Groups
Move groups can be built in multiple ways, by default Move groups are built on application categories, the Cloudamize Platform allows for the creation of new groups or assets by creating Application-Based Move Groups.
To make adjustments, click on the More Tools button, and select Build-Application Based Move Groups |
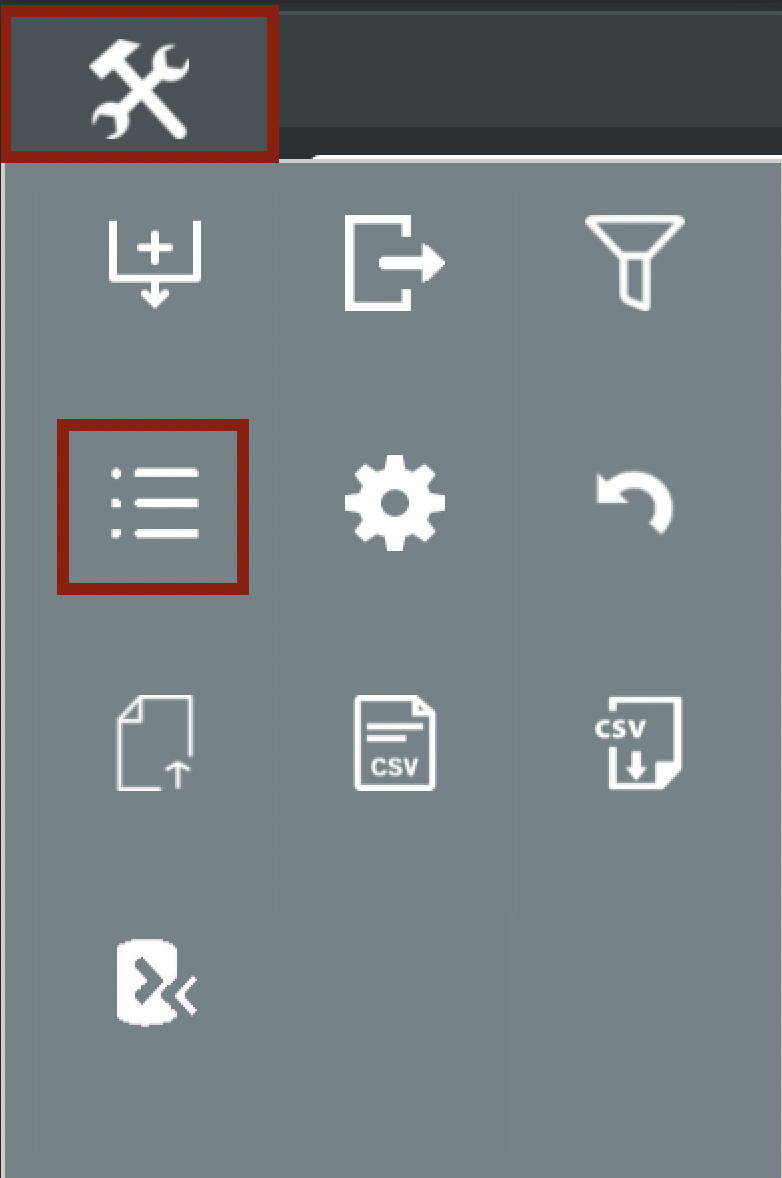
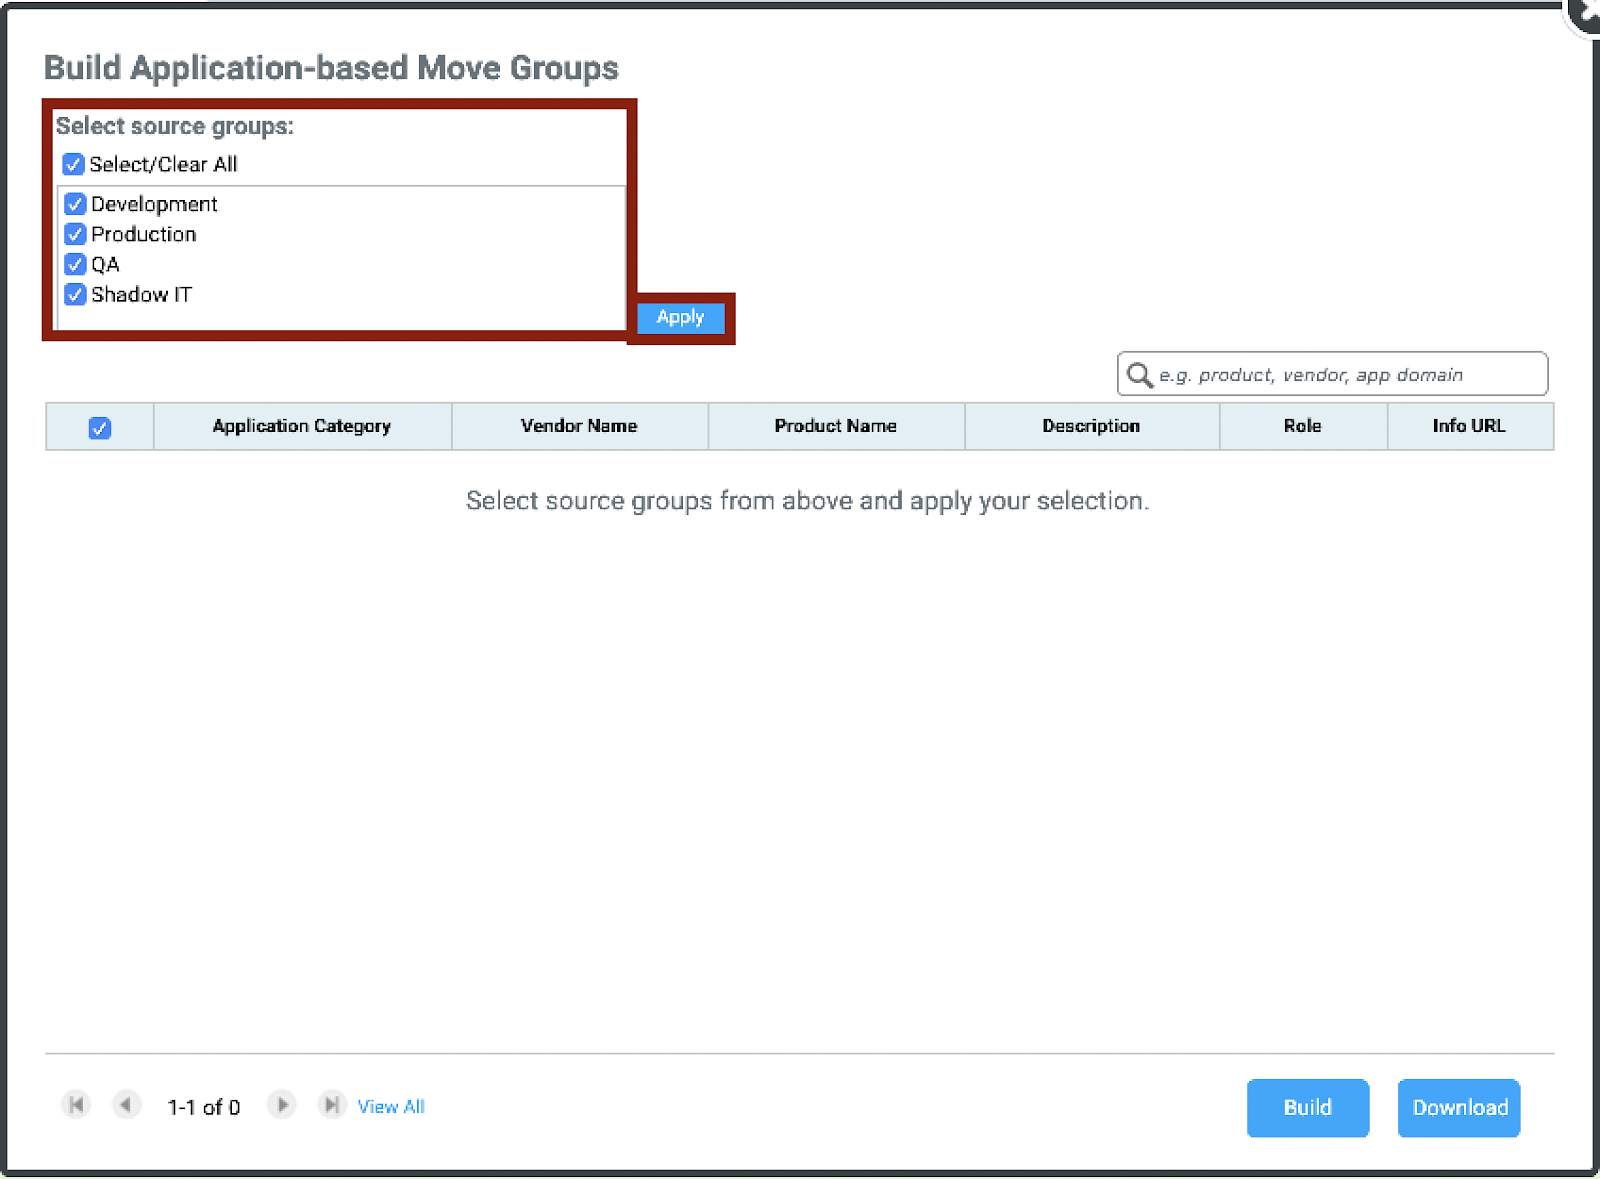
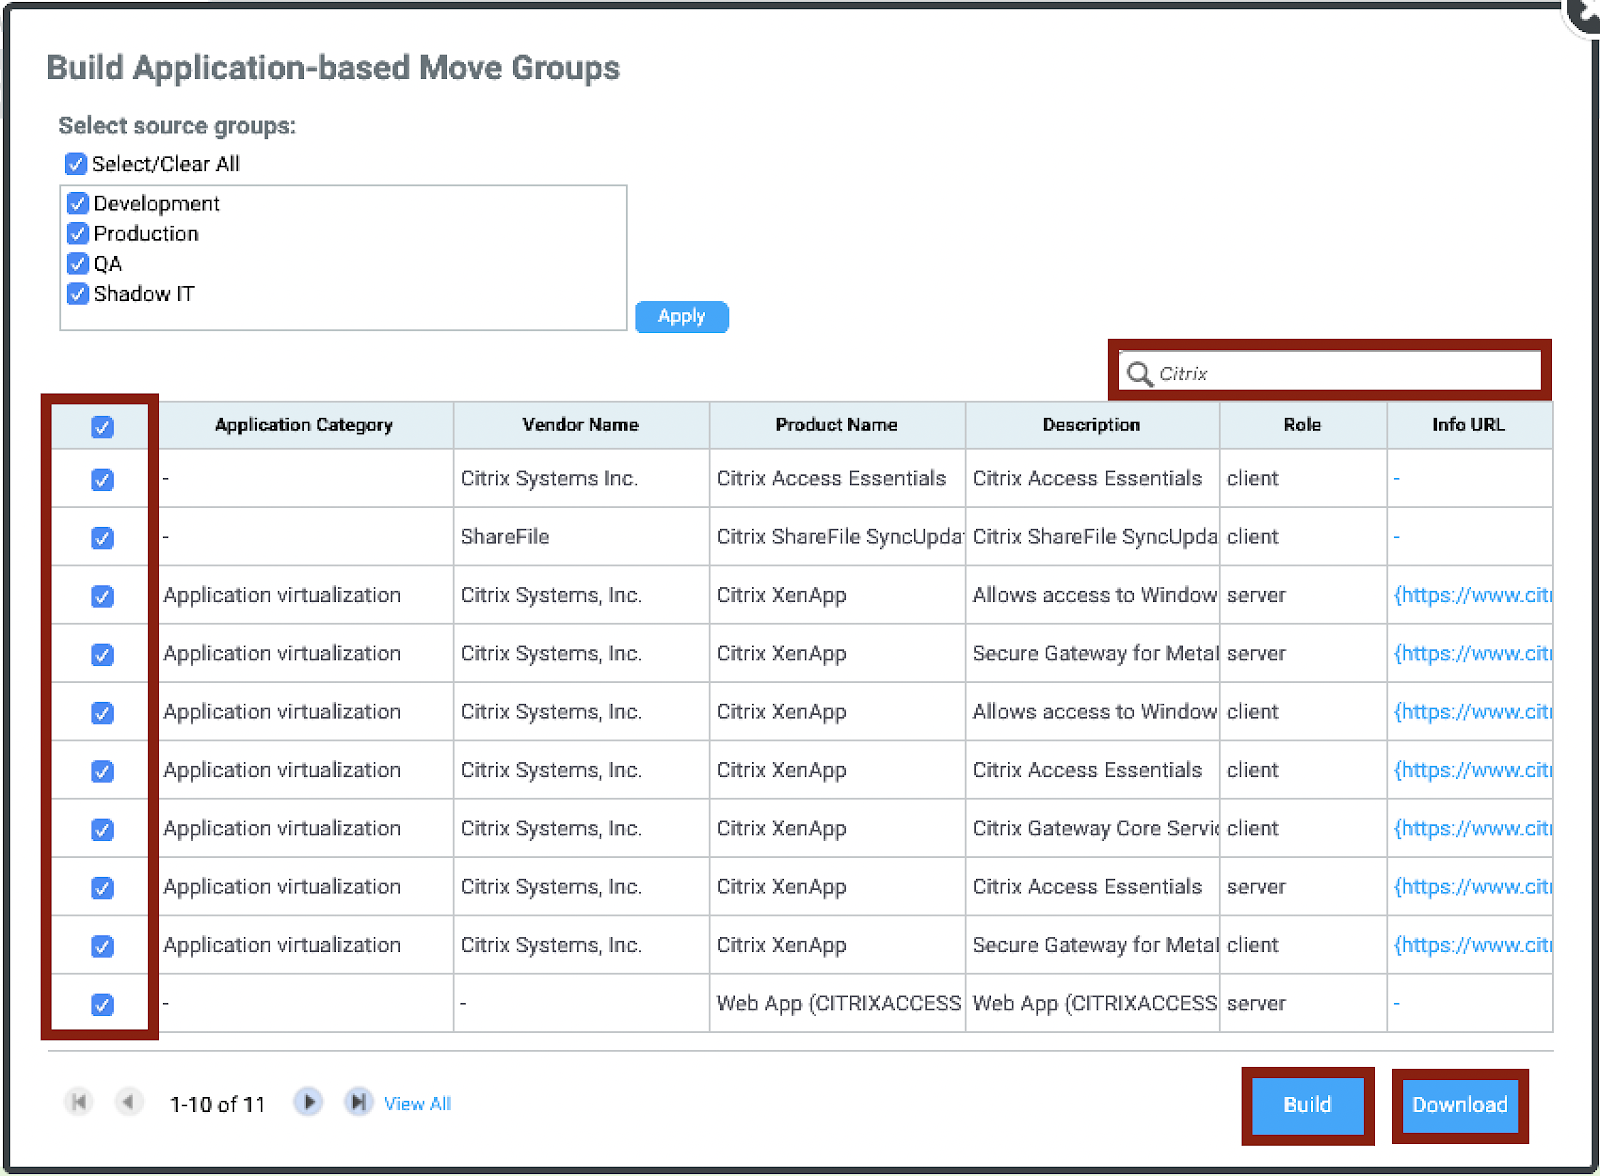
A new window will open where you can select the source, or source groups that you wish to filter from, and click Apply. By default all source groups are selected. |
The Chart at the bottom of the screen will populate with any applications that fall within your selected source groups. From here you can sort the groups by Application Category, Vendor Details, Product Name, Description, Role, or Info URL. There is also an option to view all machines in one page by clicking the View All button at the bottom of the page |
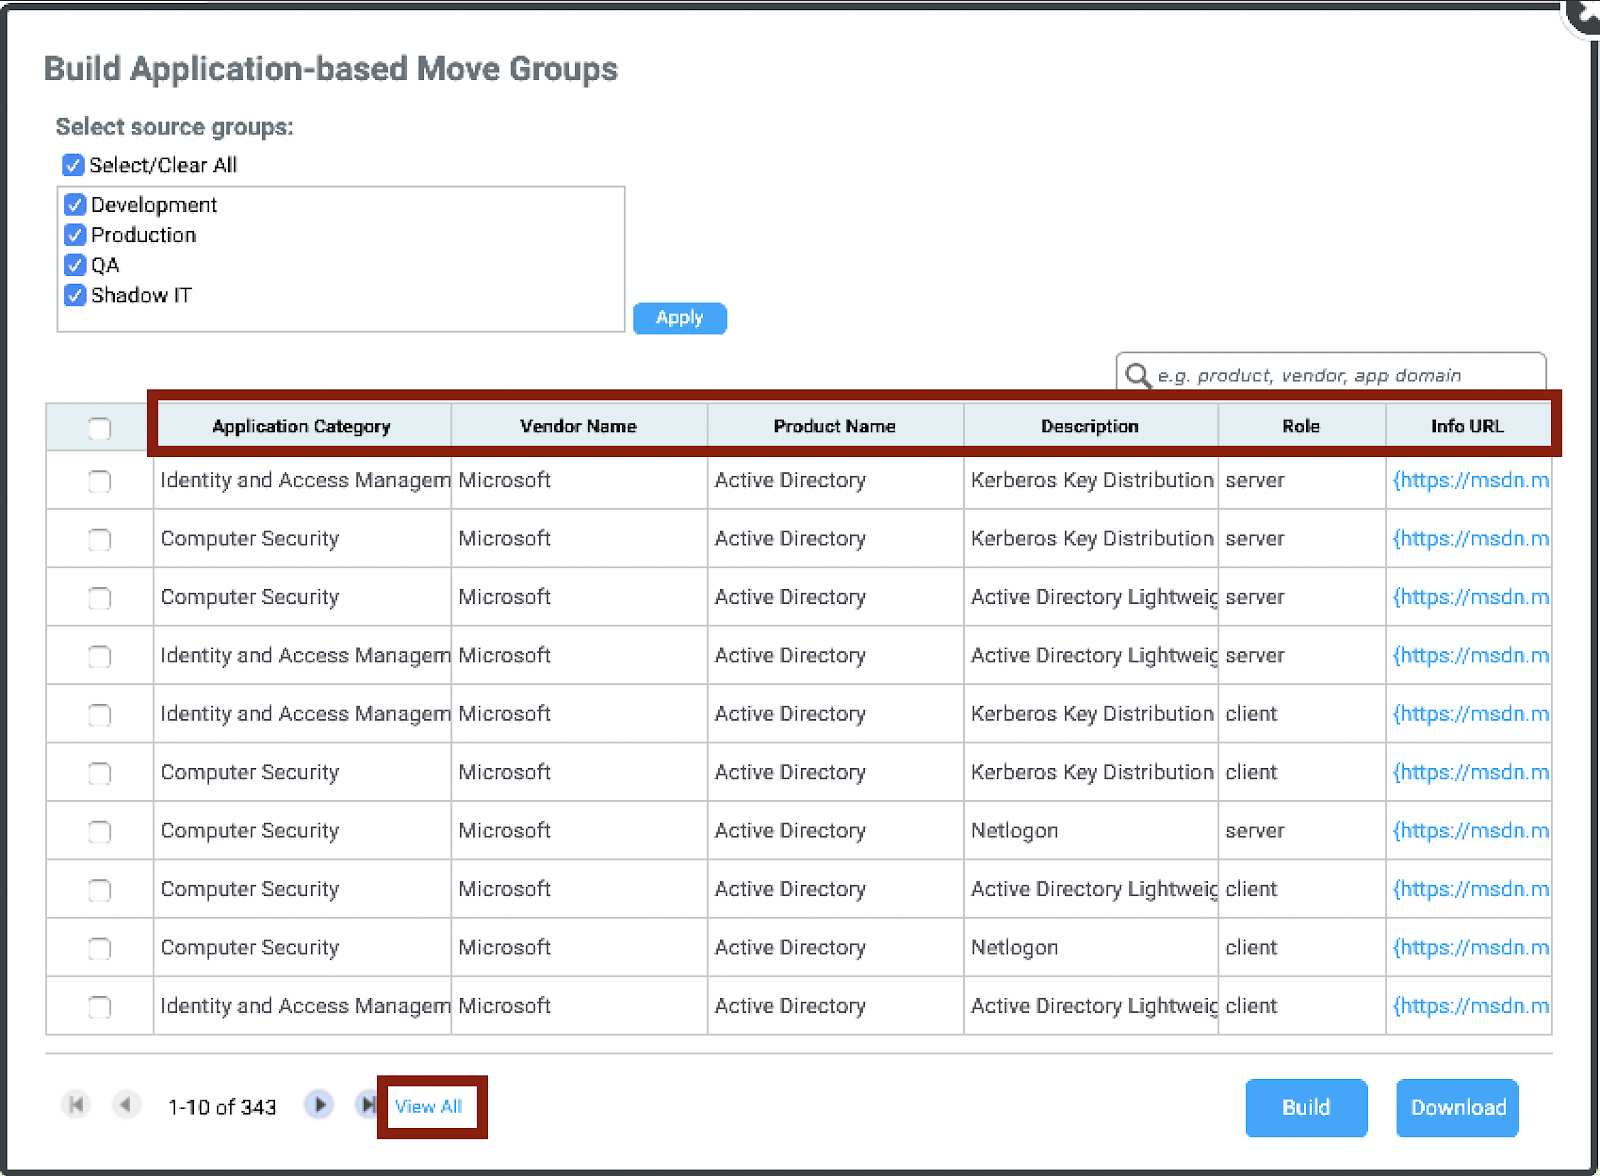 |
You can use the search bar to filter by specific application, the chart will filter based on your input, and show only those machines with the specified application.Select the machine, or machines you wish to add this group. At the bottom of the screen you have two choices, clicking Download will create a CSV file with the information included in your new move group Clicking Build will continue the group creation process.A new screen will open, allowing you to select an Existing Group, a New Group, an Existing Asset, or a New Asset | |
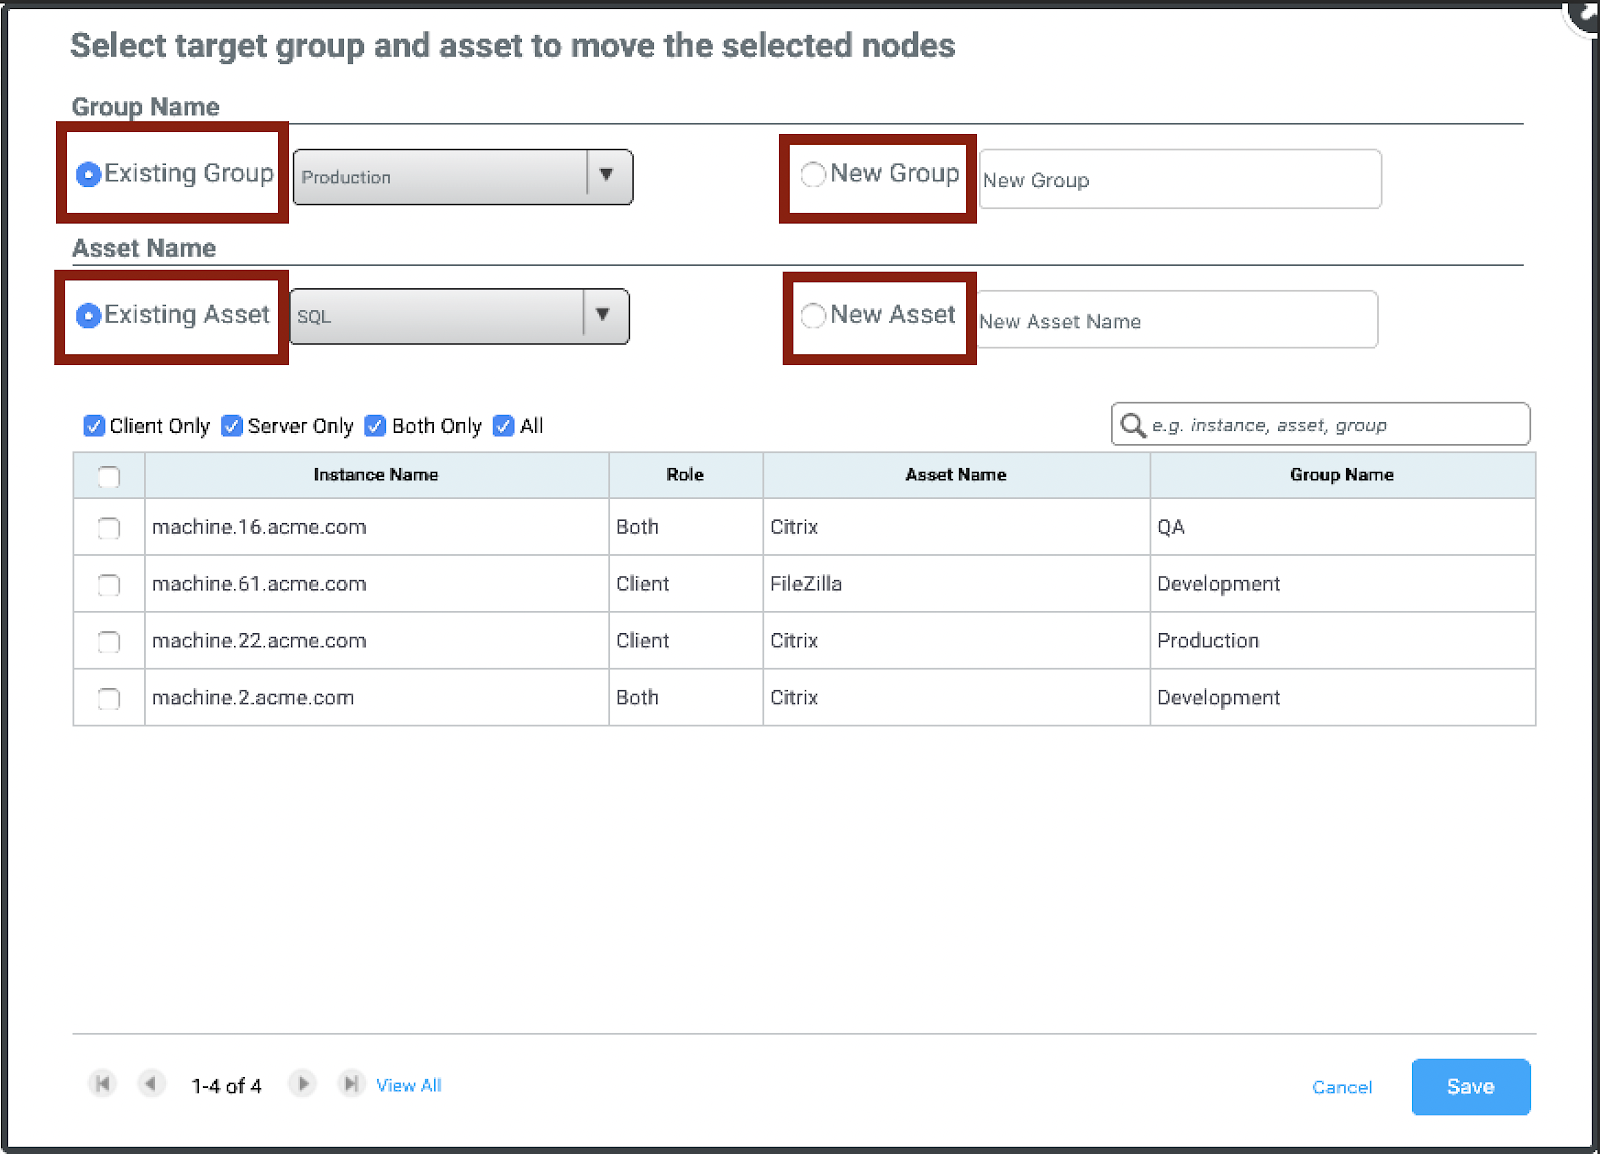 | |
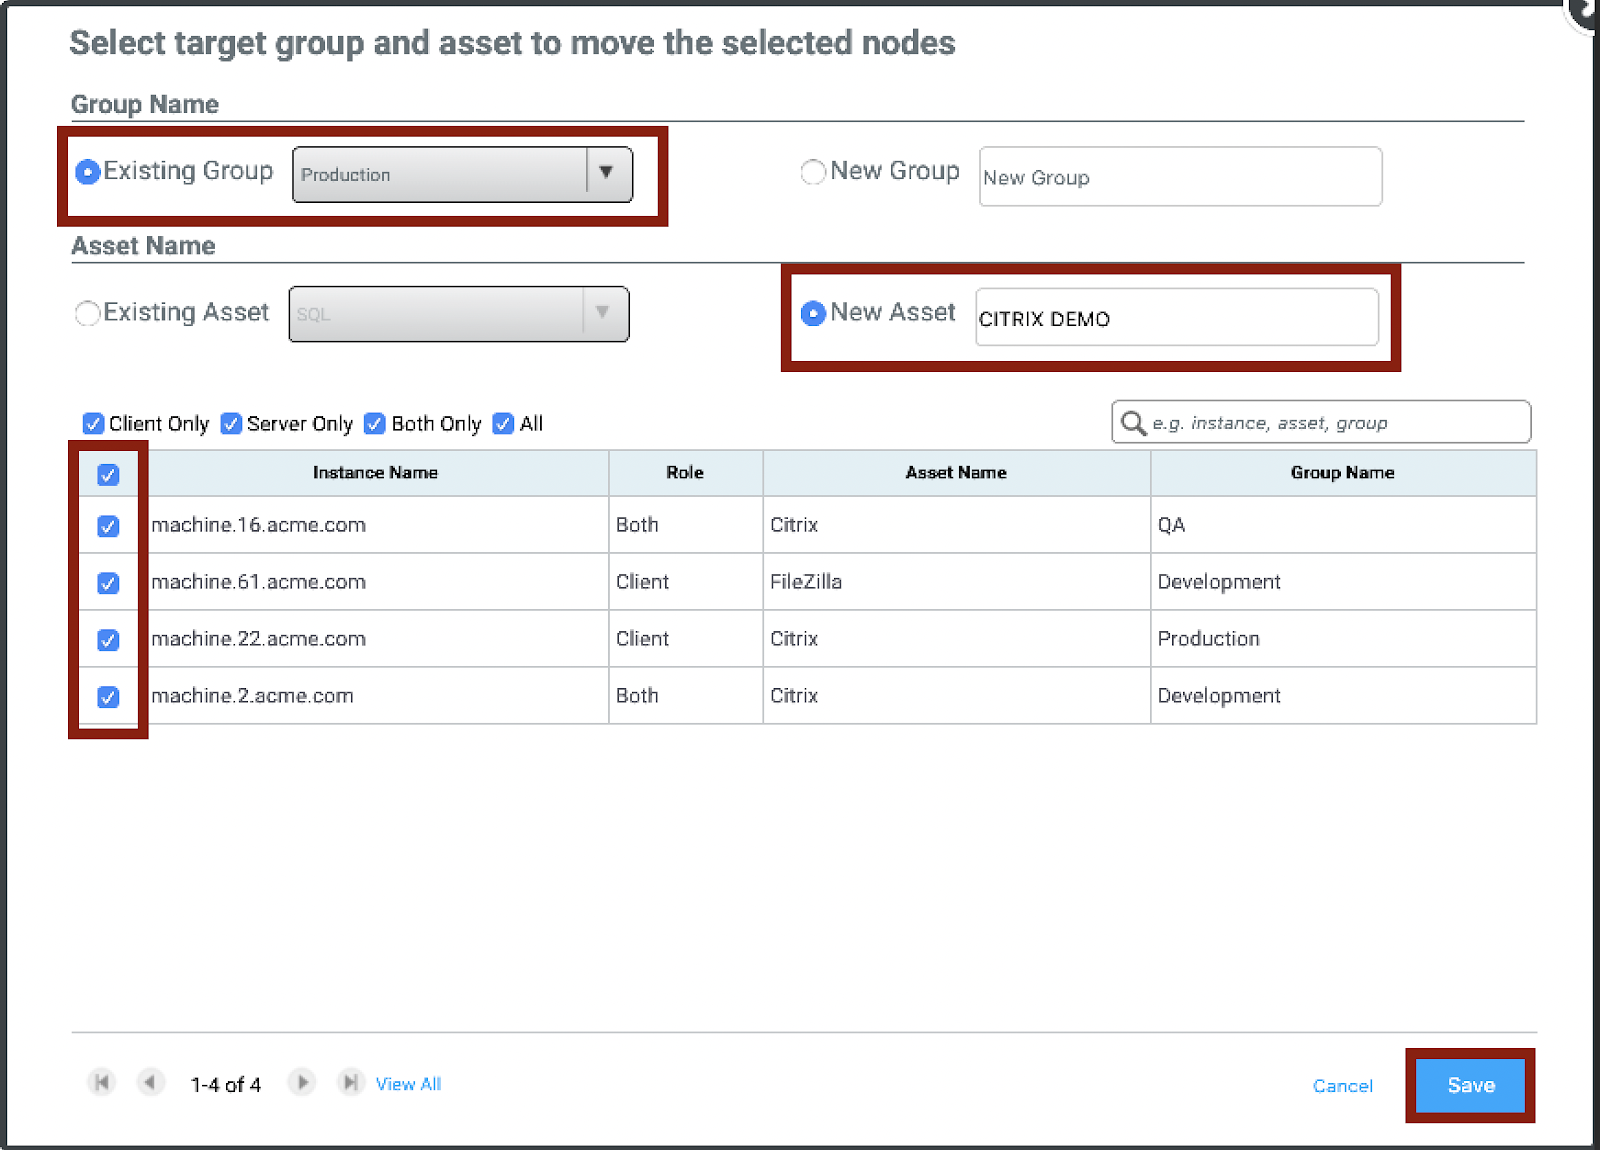
Under Group Name, there are two options, Existing Group, or New Group. | 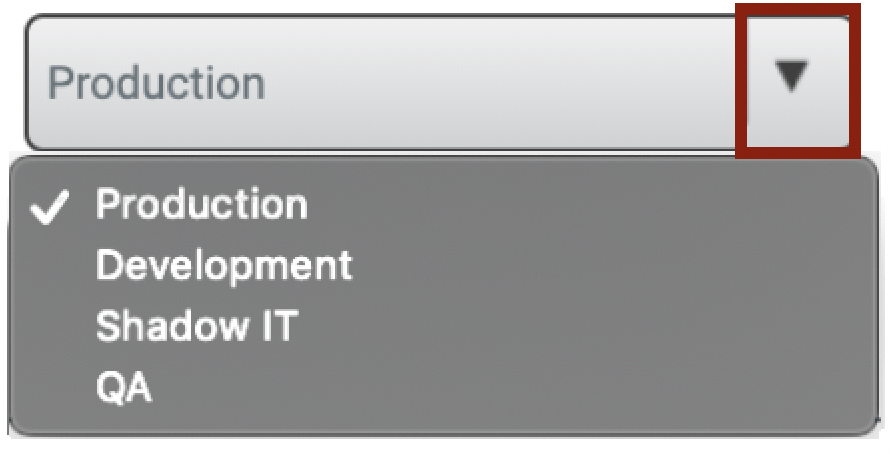 |
If you want to create a New Group, click the Circle next to New Group, and then add the name to the box. | |

Any asset groups you create in Migration Planner cannot be used in the CMZ Designer, unless they are manually pushed by Engineering from the Planner to Assess.
Under Asset Name, there are two options, Existing Asset, or New Asset.. | 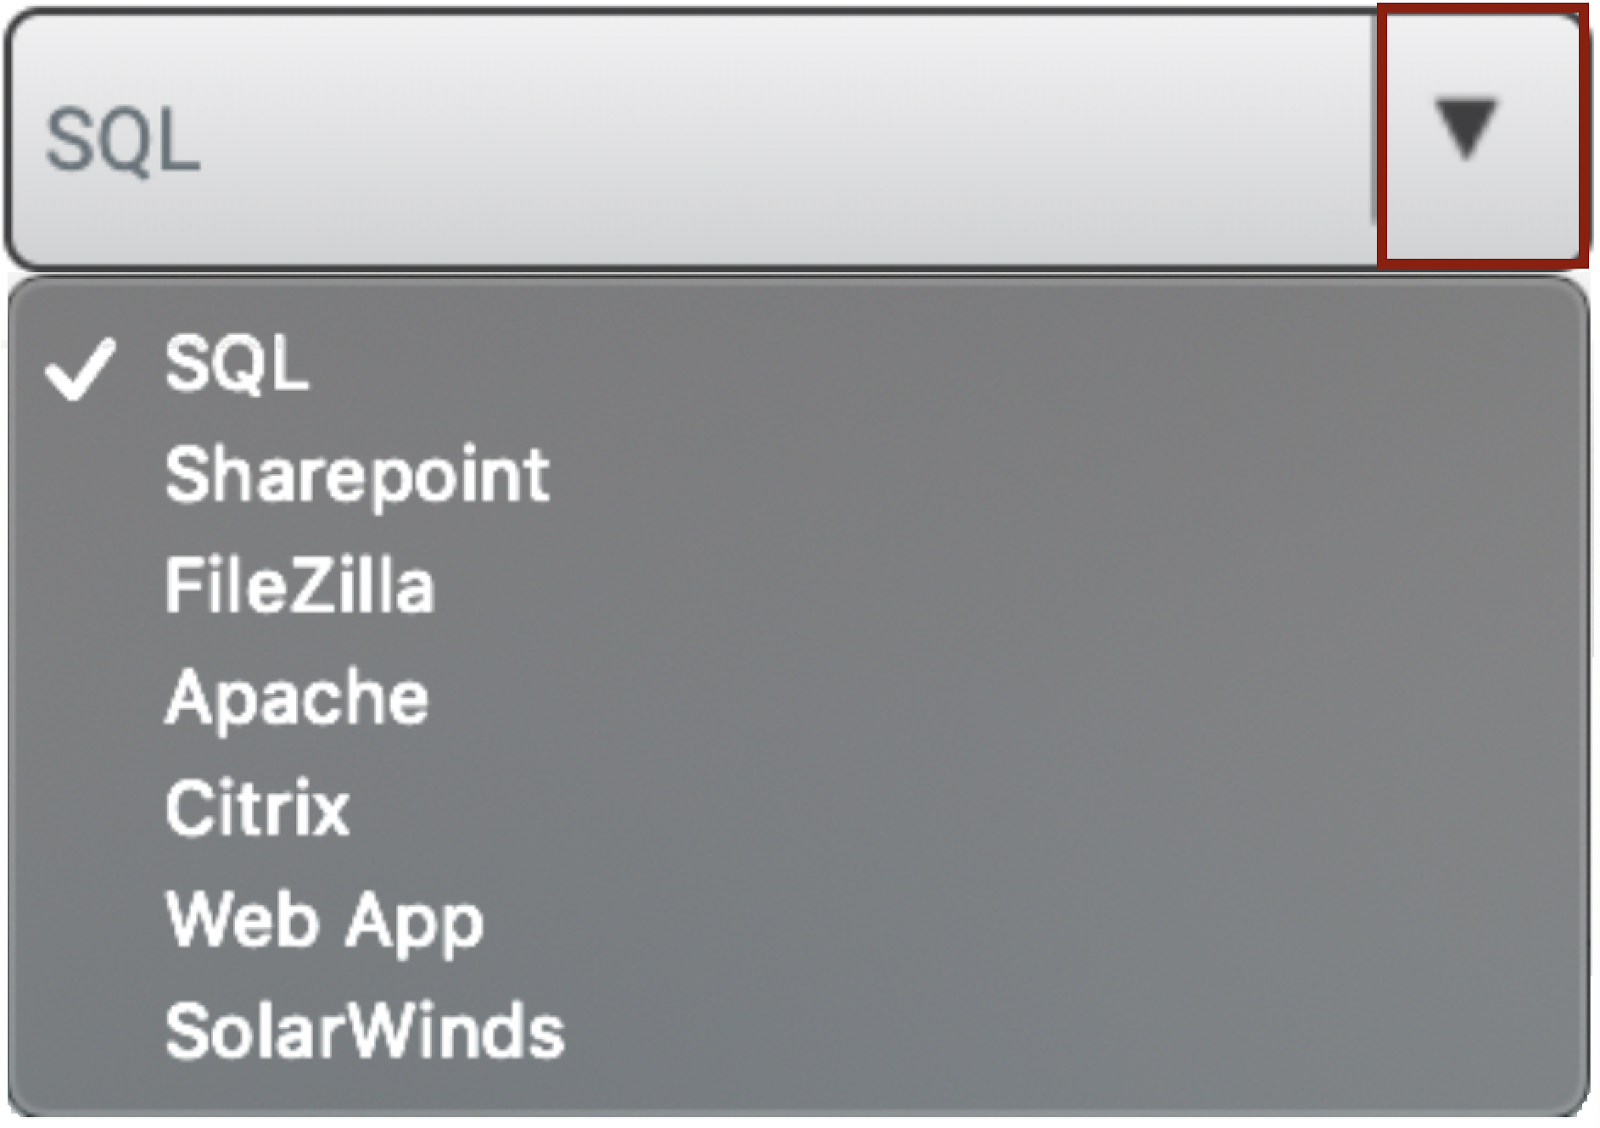 |
If you want to create a New Asset, click the Circle next to New Asset, and then add the name to the box. |  |
Please Note, that if you are creating a New Group, you must create a New Asset for that group. However, if you are creating a New Asset, you have the option to add that asset into an Existing Group.
Here we will create a New Asset. First, select the Existing Group, you want you asset to be located in, and then name your New Asset. You have the ability to add individual machines to add to this asset, or select all. When finished click Save. After clicking save, you will be returned to the canvas, and your New Asset will be created. Follow the same process to continue making other Application-Based Move Groups
Build Machine-Based Move Groups
In addition to Application-Based Move Groups, the Cloudamize Platform allows for the creation of Machine-Based Move Groups
To make adjustments, click on the More Tools button, and select Build-Machine Based Move Groups. | 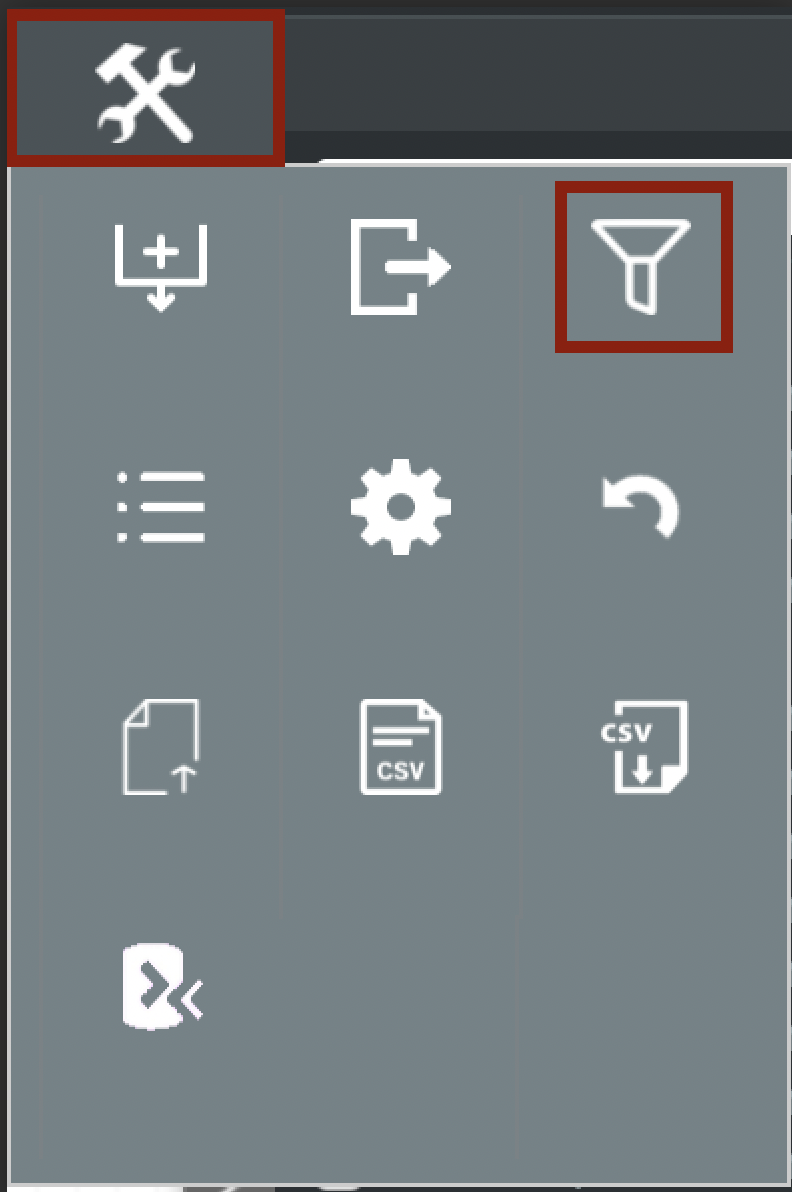 |
A new window will open with two sections, the bottom section lists all processes found during the assessment and the top section, is where we will be adding rules for these machines. |
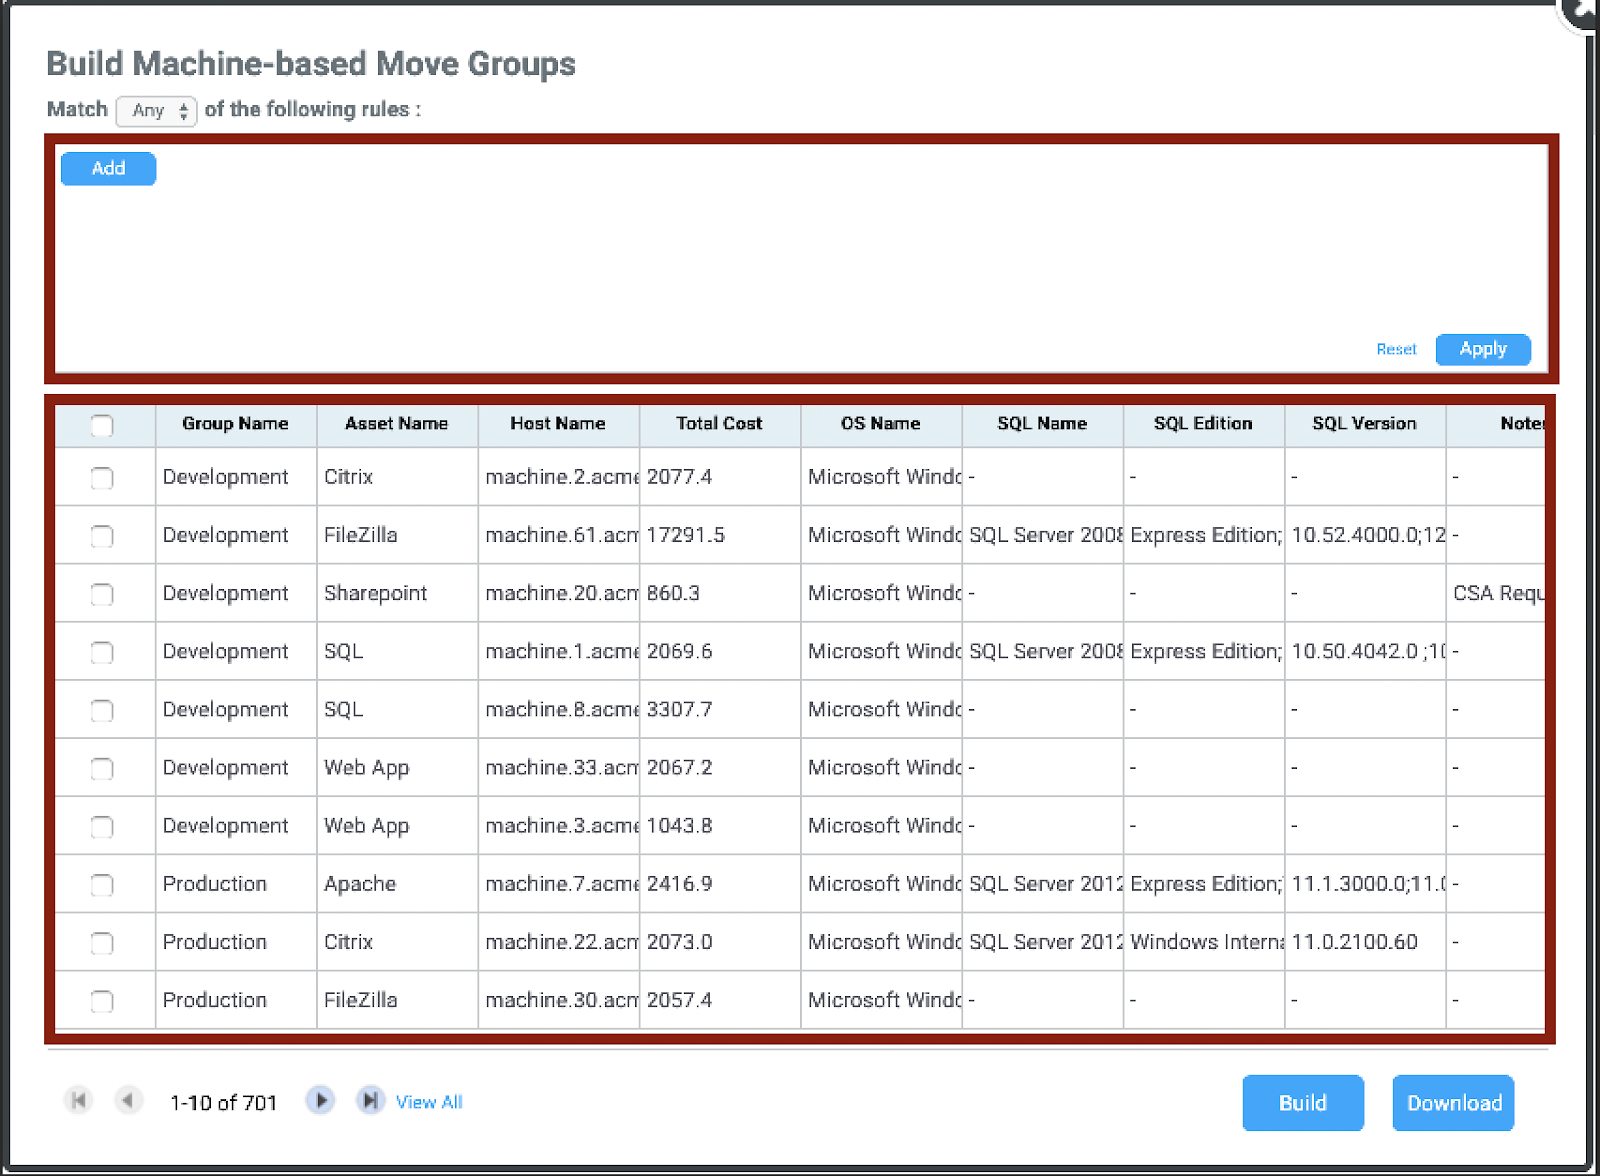
First, click the Add button, new values will appear that allow you to choose the column, condition, and value, or enter a customer value. |
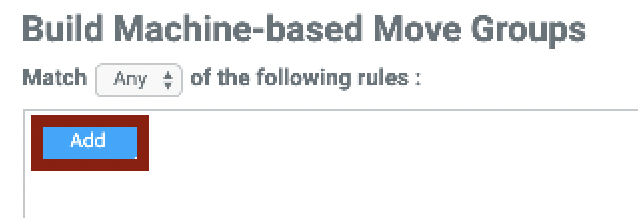
Under Column, you can select which of the column names in the table at the bottom, you will begin to filter. | |
Filters include, Group Name, Asset Name, Host Name, Total Cost, OS Name, SQL Name, SQL Edition, SQL Version, Tag Key, and Tag Value. Please note that Tag Keys & Values are added through the Project Management [tab] discussed in the Migration Planner overview. | |
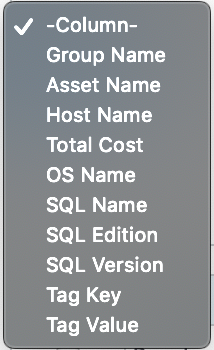

For this example, we will select OS Name. |
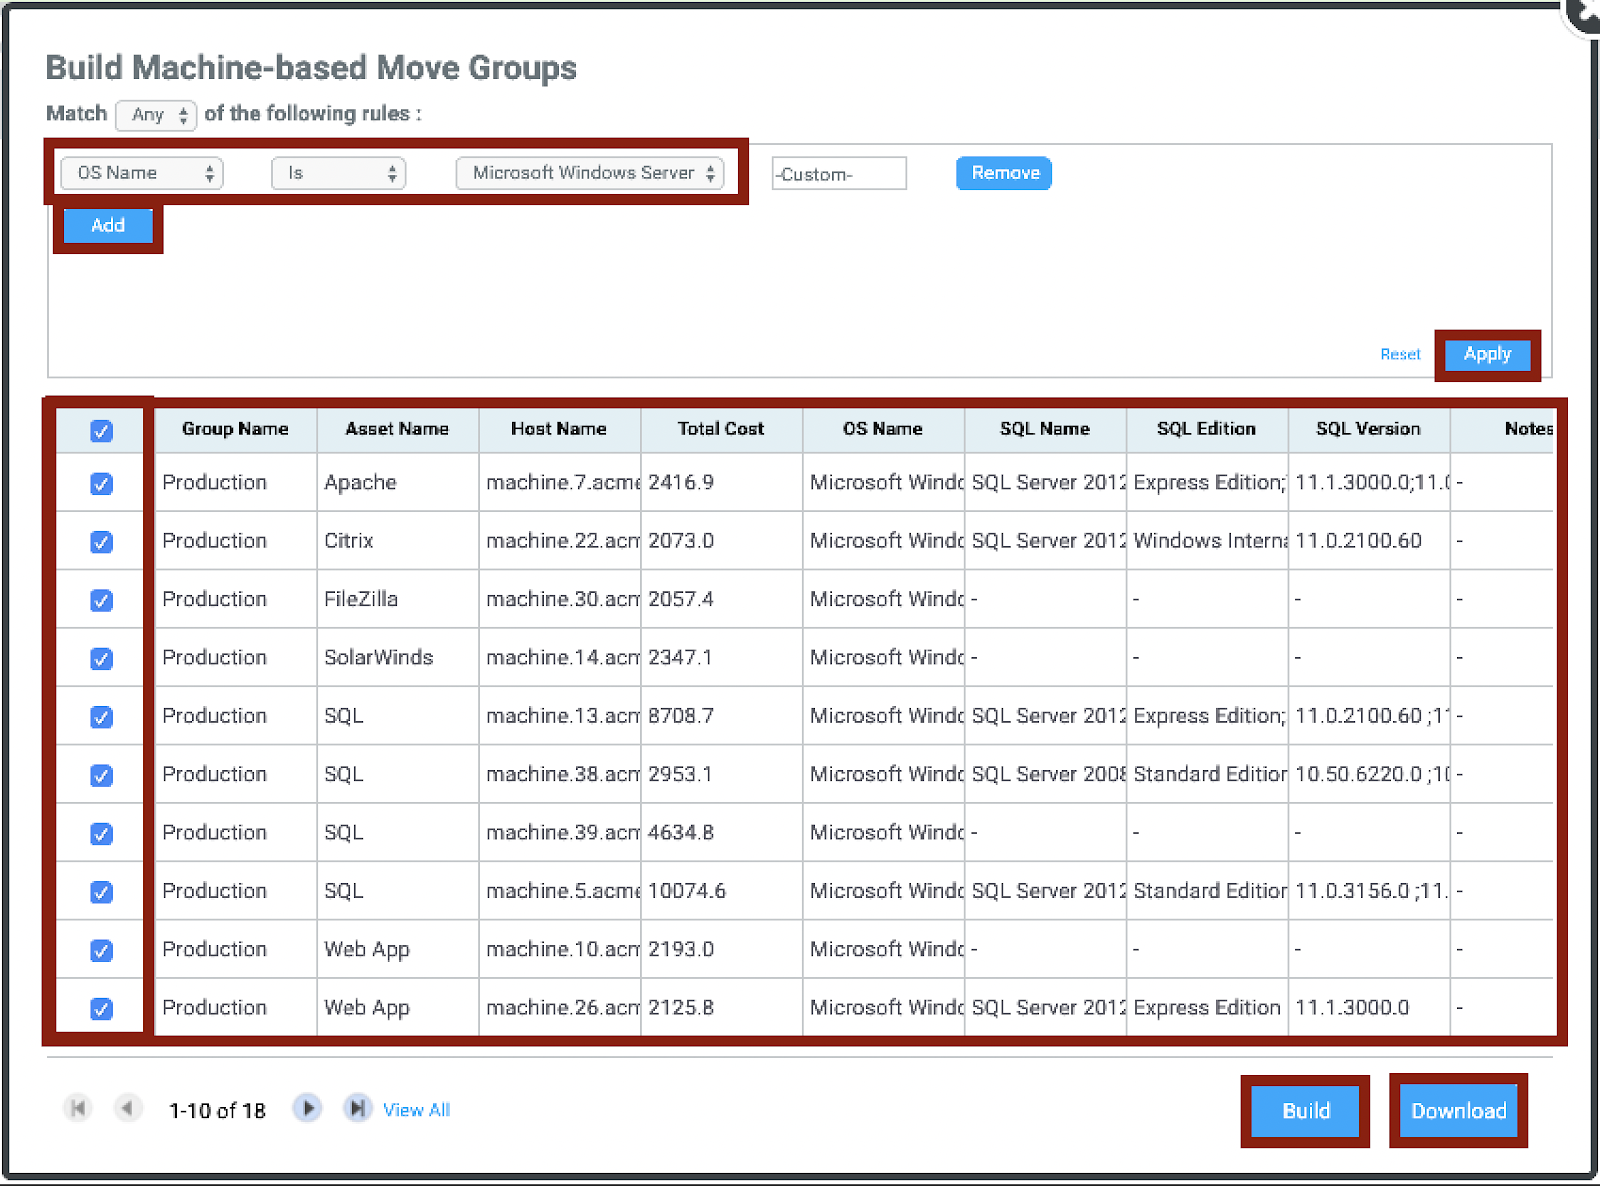 |
The table at the bottom of the window will update, and show only the hosts that fall within the specified rule. Select the node, or nodes you wish to add to this group. |
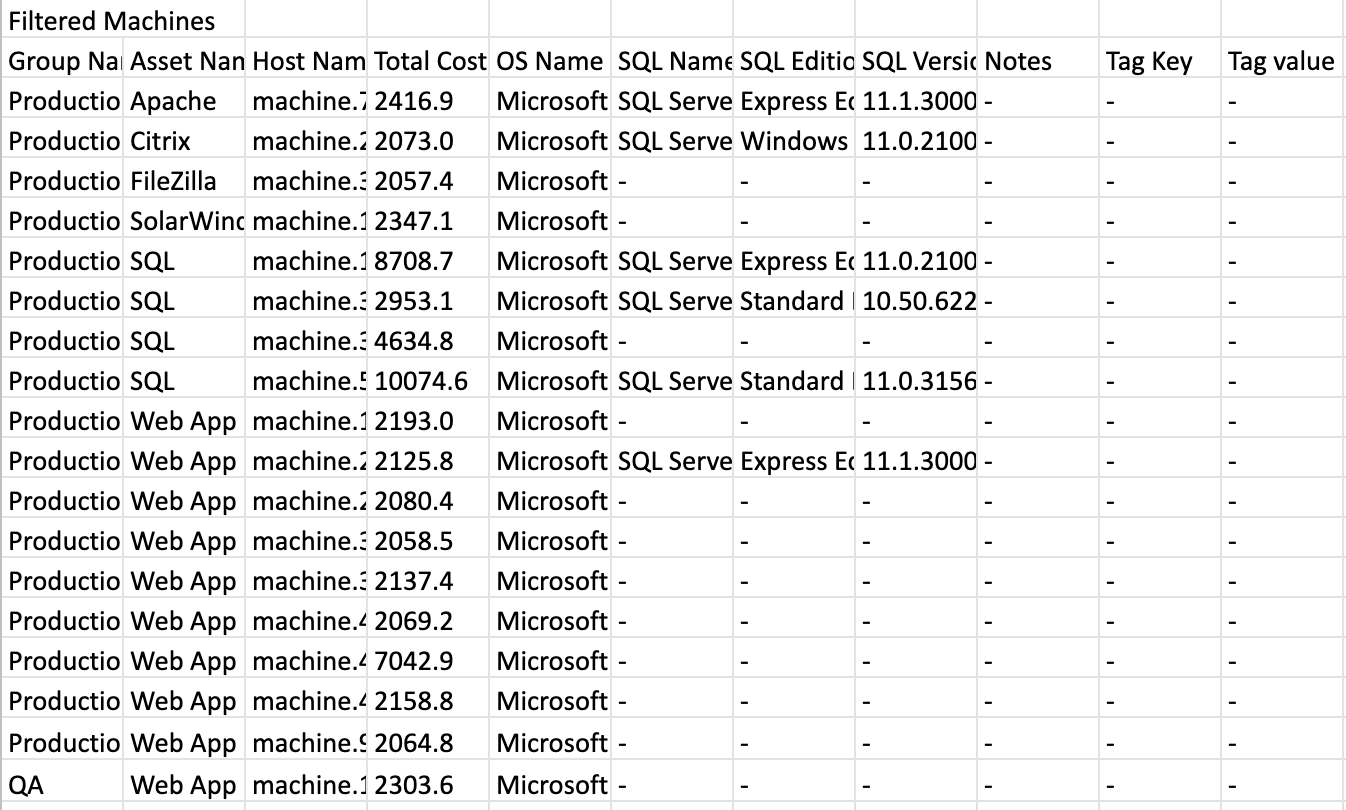
At the bottom of the screen you have two choices, clicking Download will create a CSV file with the nodes included in your new move group |
You can use the search bar to filter by specific application, the chart will filter based on your input, and show only those machines with the specified application.Select the machine, or machines you wish to add this group. 
At the bottom of the screen you have two choices, clicking Download will create a CSV file with the information included in your new move group 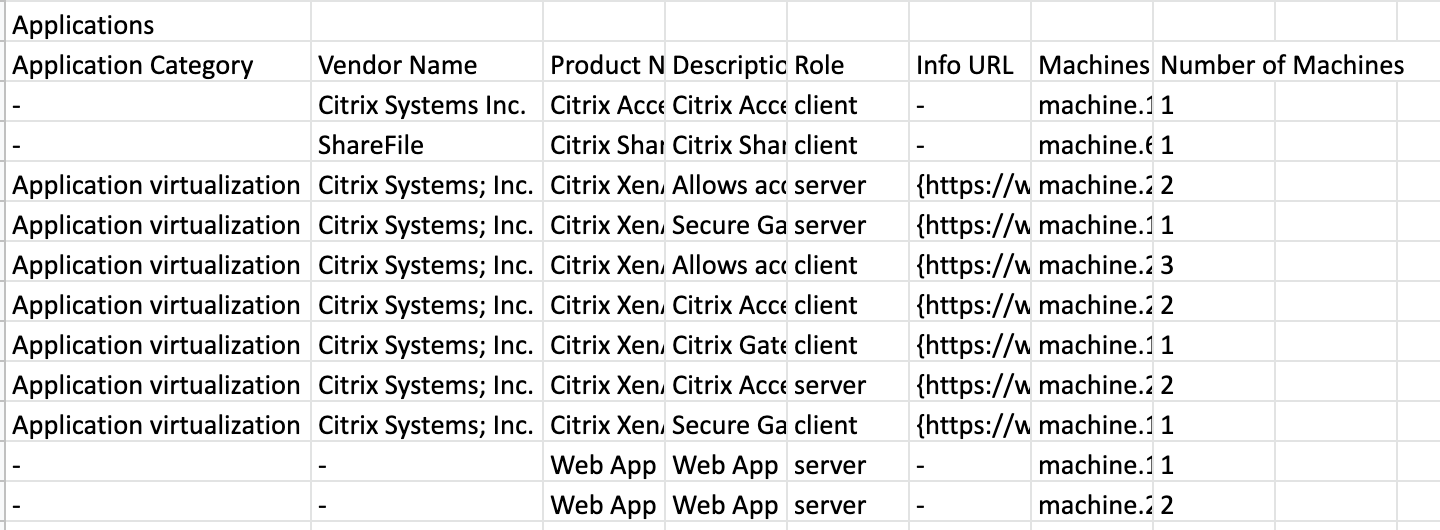
Clicking Build will continue the group creation process. | |
 | |
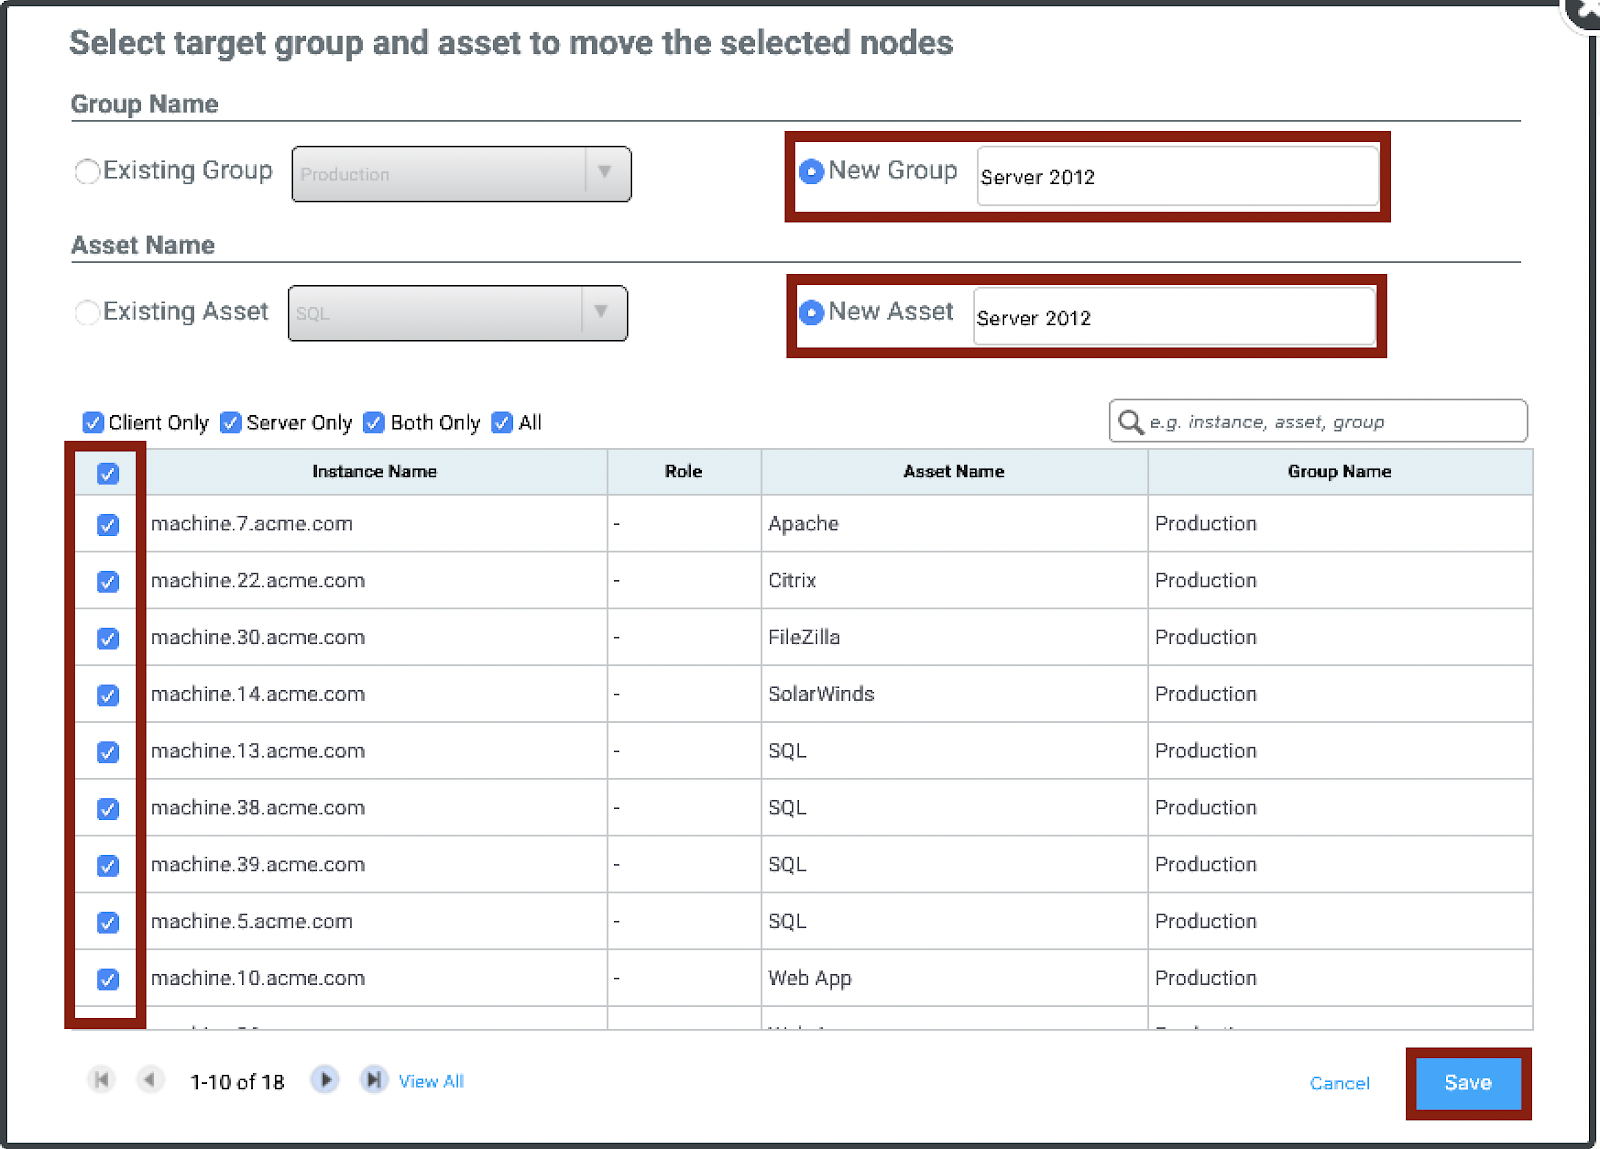
Under Group Name, there are two options, Existing Group, or New Group. |  |
If you want to create a New Group, click the Circle next to New Group, and then add the name to the box. | |

Any asset groups you create in Migration Planner cannot be used in the CMZ Designer, unless they are manually pushed by Engineering from the Planner to Assess.
Under Asset Name, there are two options, Existing Asset, or New Asset.. |  |
If you want to create a New Asset, click the Circle next to New Asset, and then add the name to the box. |  |
Please Note, that if you are creating a New Group, you must create a New Asset for that group. However, if you are creating a New Asset, you have the option to add that asset into an Existing Group. Here we will create a New Group, and a New Asset. First, enter the name for the New Group, and the New Asset. You have the ability to add individual machines to add to this asset, or select all. When finished click Save. After clicking save, you will be returned to the canvas, and your New Group, and New Asset will appear, and allow you to look at the individual nodes, and view application interconnectivity, or the asset summary. Follow the same process to continue making other Machine-Based Move Groups
How to Use Advanced Filtering
Another method of creating move groups is through Advanced Filtering.
Advanced Filtering allows you to create move groups based on nearly any metric collected by the Cloudamize platform.
To begin, navigate to the Migration Planner from the asses Dashboard. Once there click on the ‘More Tools’ button, followed by Advanced Filtering | 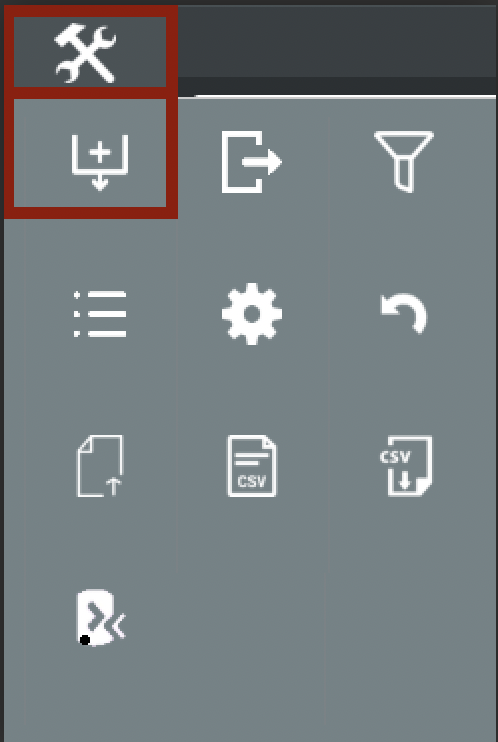 |
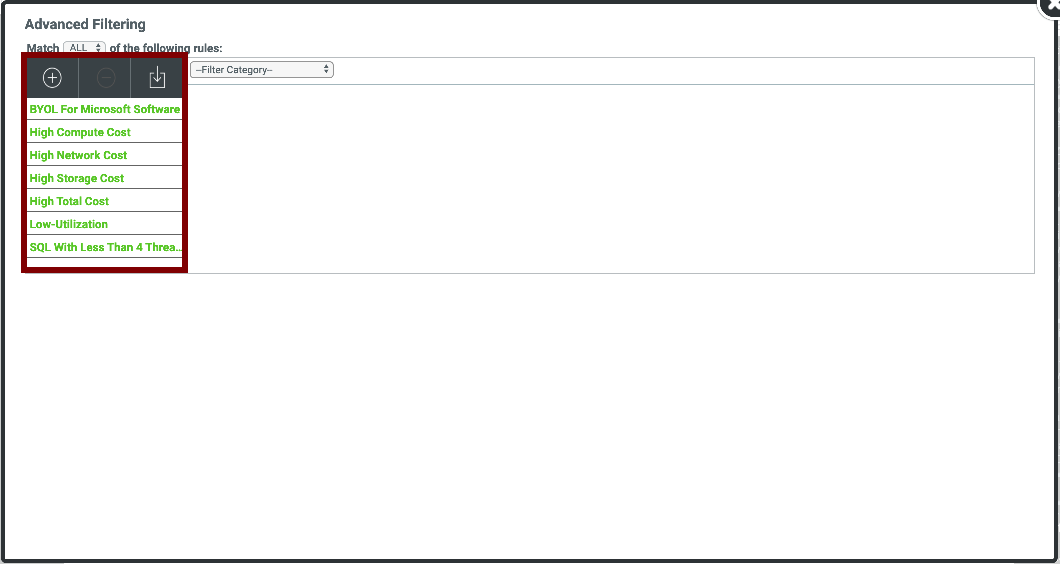
In the window that opens, on the left-hand side are some stock filters that Cloudamize provide for you, such as, high-compute, high-storage, or high-network cost amongst others. |
 |
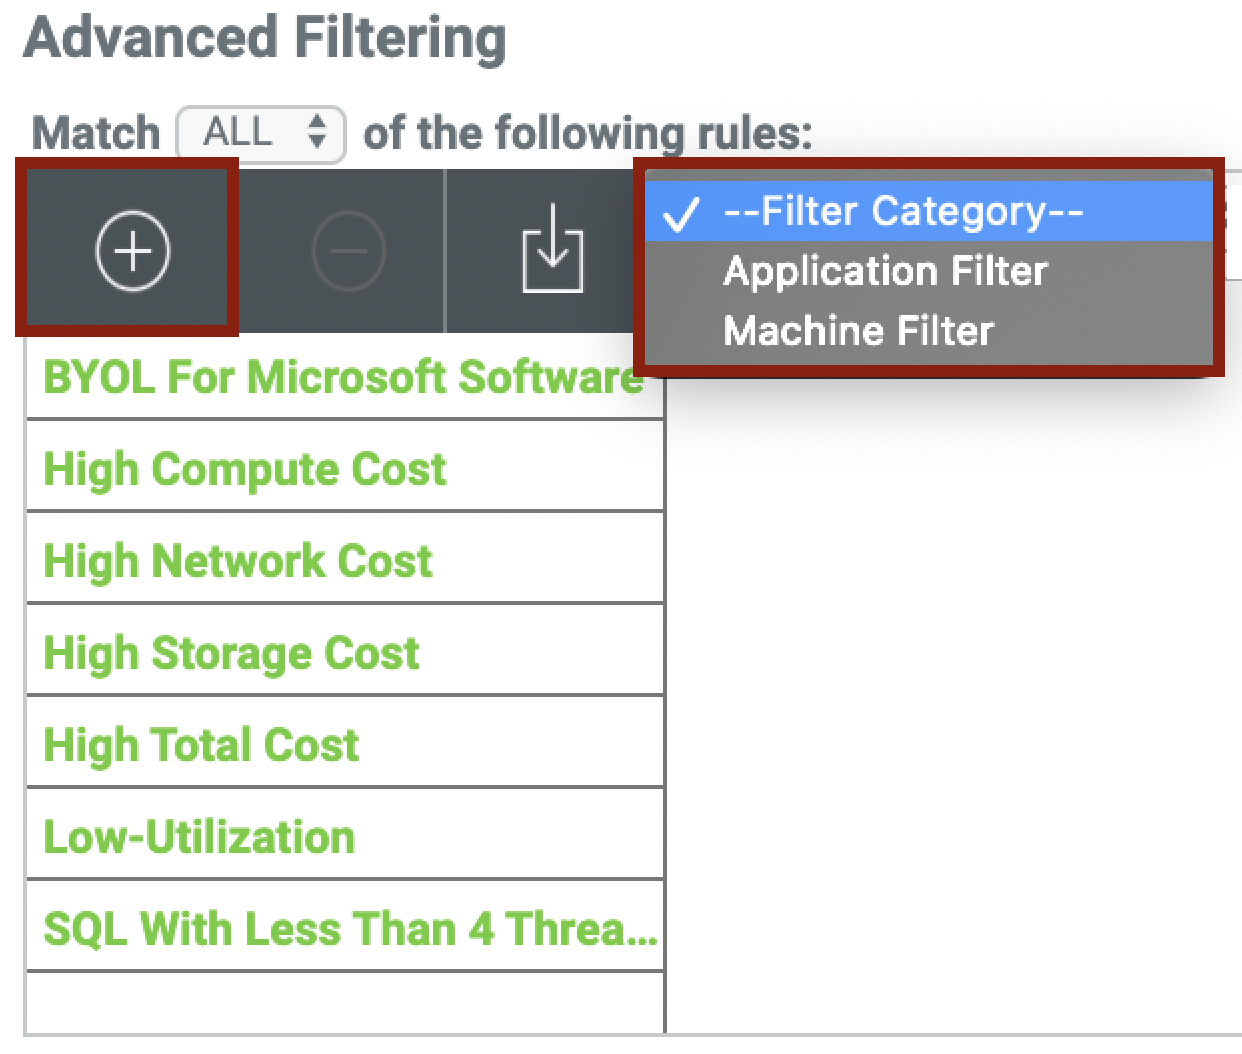
To create a new filter, click the ‘+’ button. After clicking the ‘+’ button, select either Application Filter or Machine Filter from the dropdown box to begin.
|  |
In the example below, we will create a Machine Filter. Click Add, and a new line will appear allowing you to filter by any field found within the selected category. In this example, we are creating a Compute Filter with a role looking for machines where the Bottleneck is Memory. After ‘clicking’ Add, the chart at the bottom will update to show only the machines, where the Bottleneck is memory.
| |
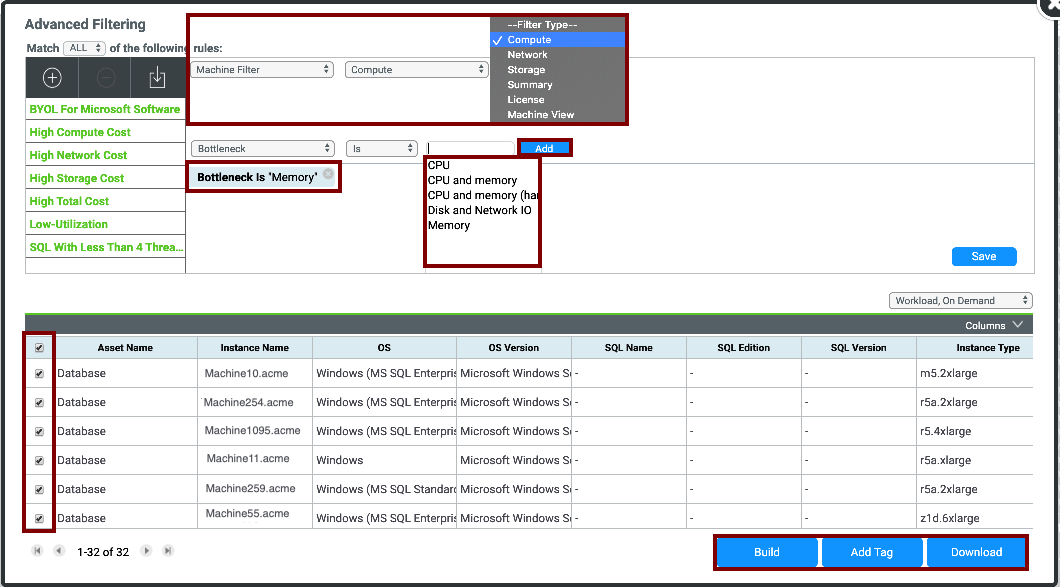 | |
You are able to change what information is included in the report by ‘clicking’ on the columns and ‘checkboxes’ within.
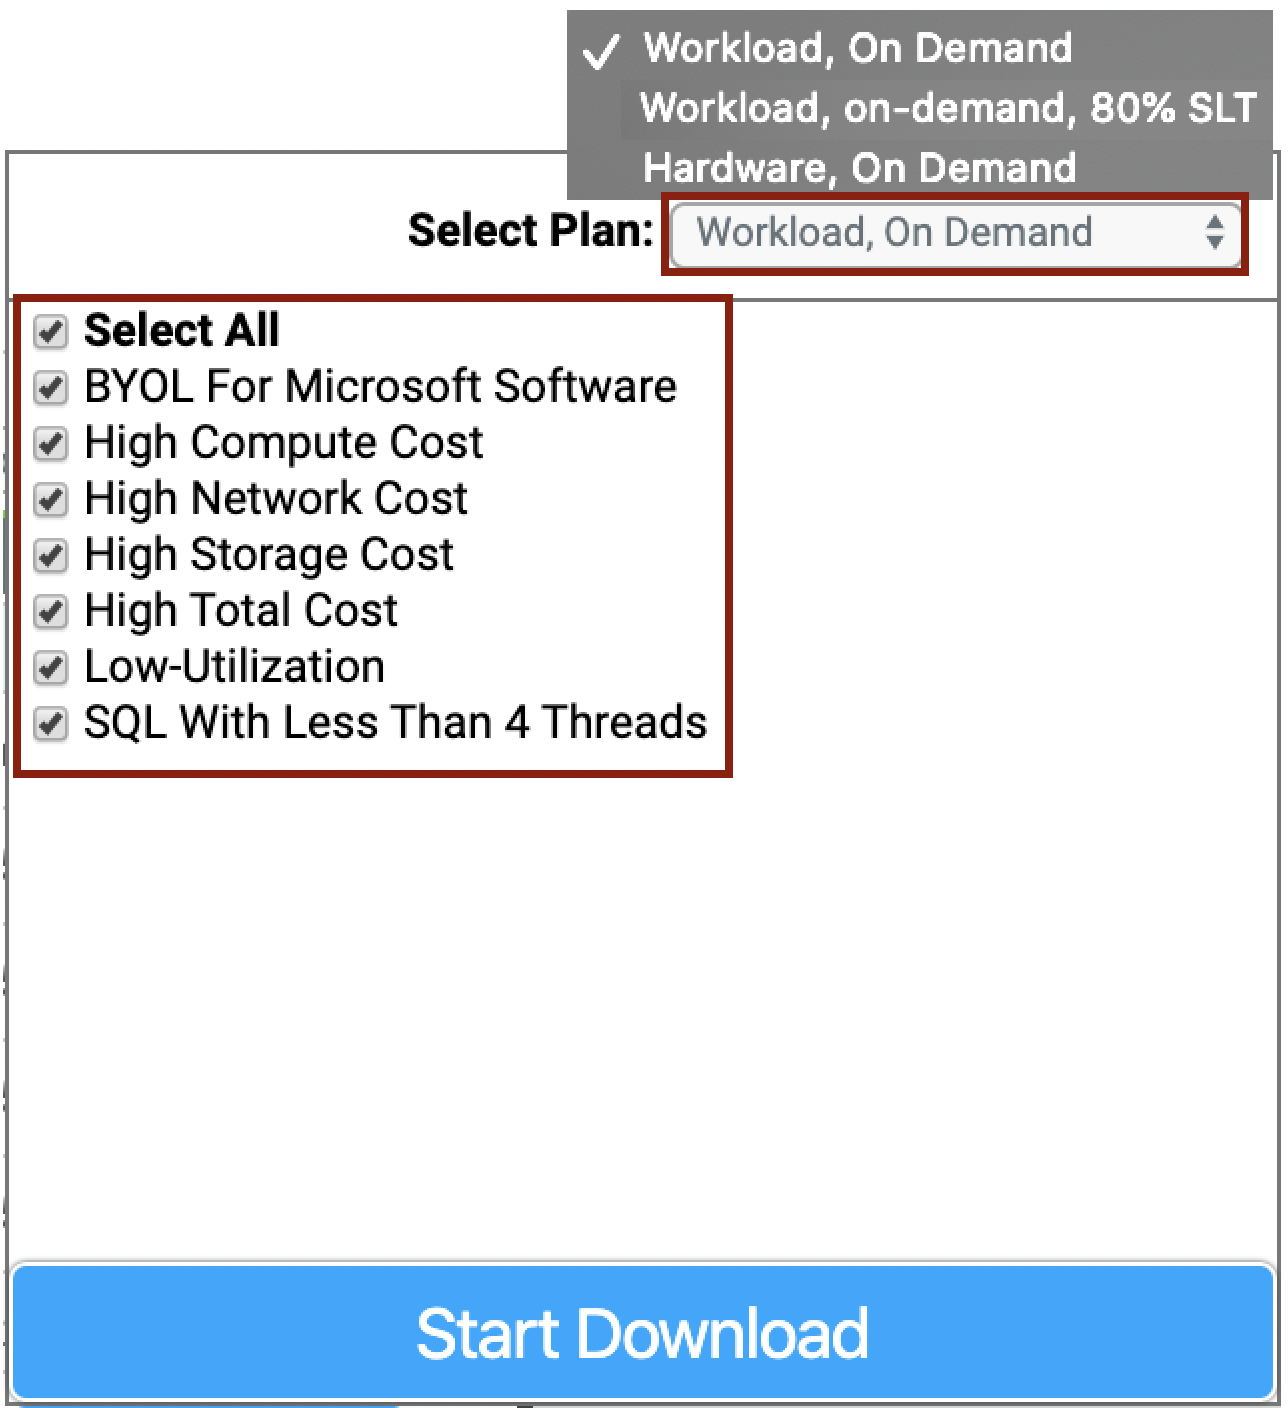 By clicking Build you will continue the group creation process. A new screen will open, allowing you to move the new selected to an Existing Group, a New Group, an Existing Asset, or a New Asset
Here we will create a New Asset called Bottleneck. First, select the Existing Group, you want you asset to be located in, and then name your New Asset. You have the ability to add individual machines to add to this asset, or select all. When finished click Save. After clicking save, you will be returned to the canvas, and your New Asset will be created. Follow the same process to continue making other move groups with Advanced Filtering.Any asset groups you create in Migration Planner 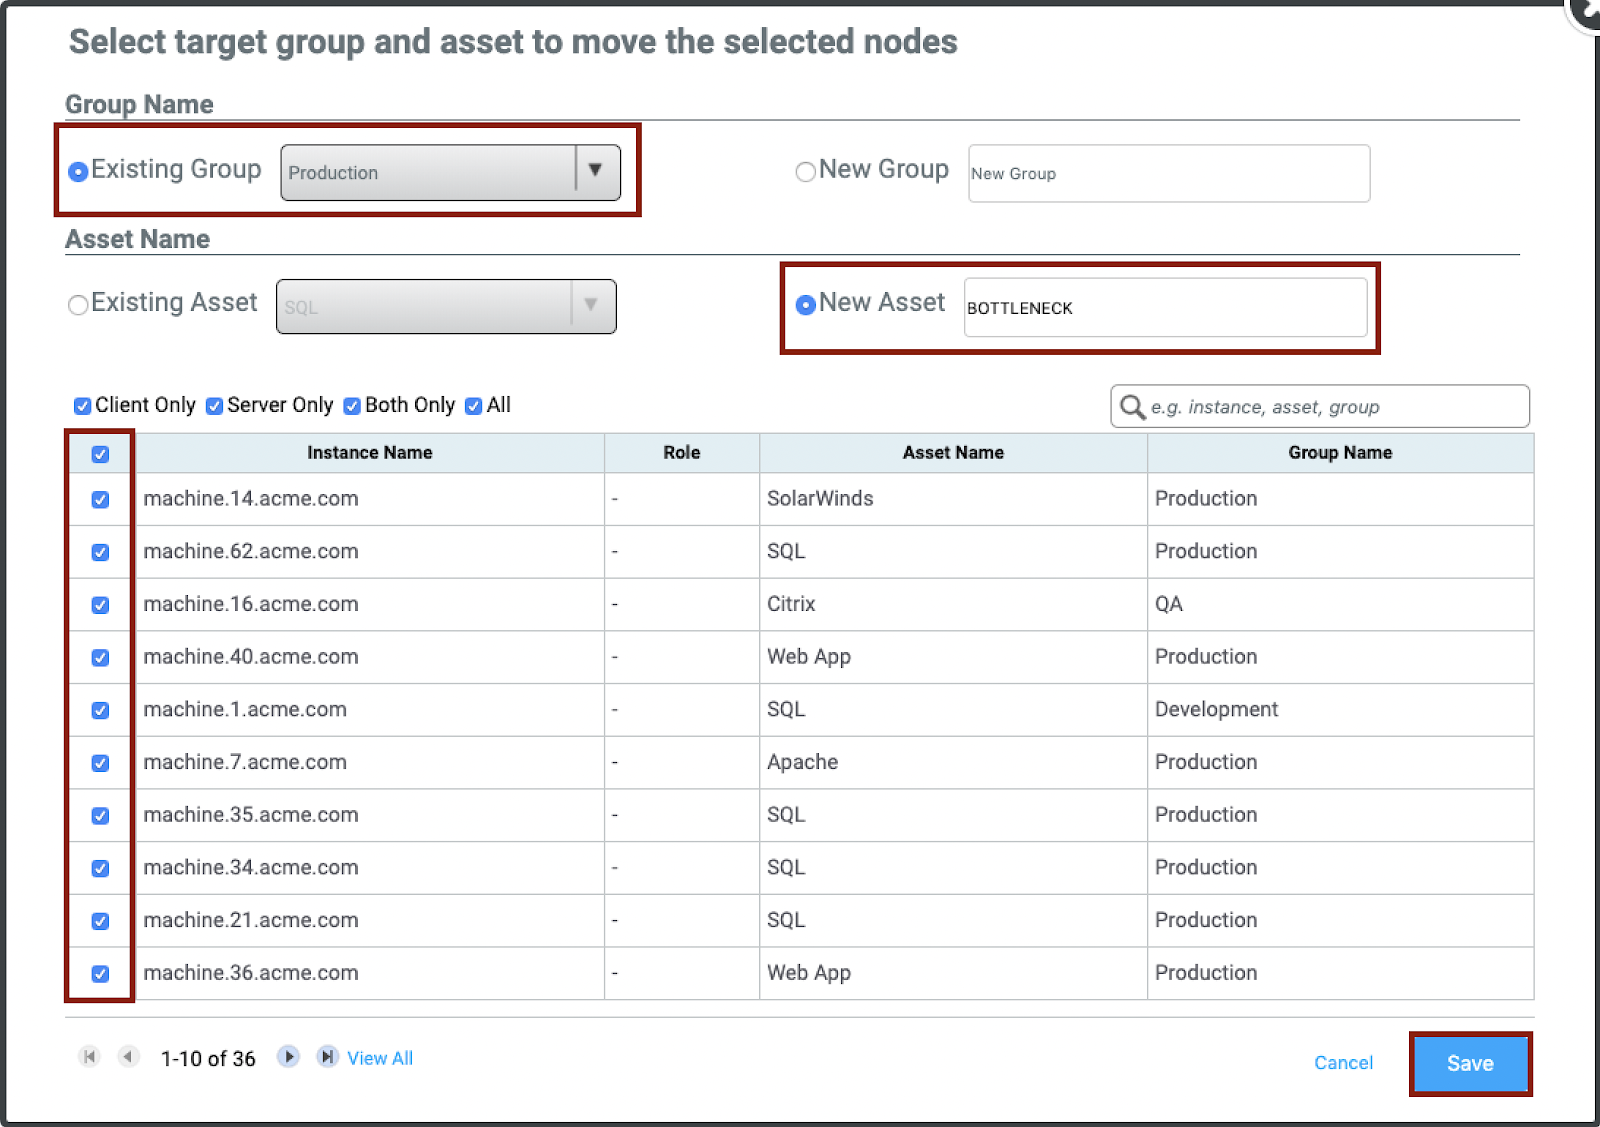 cannot be used in the CMZ Designer, unless they are manually pushed by Engineering from the Planner to Assess. | |
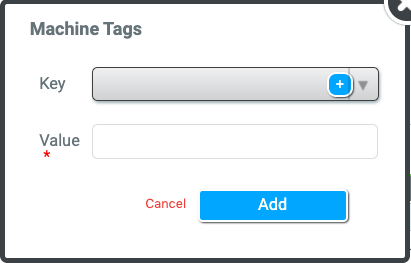
By clicking Add Tag you are presented with the option of applying a previously created ‘tag’ from the Project Management section of the Migration Planner, and allows you to assign tags, owners, migration type and any other notes, you can later search based on these tags, and build migration groups. |
SQL Server and License Usage
Cloudamize now provides a more in-depth look at the SQL Servers found in the assessed infrastructure.
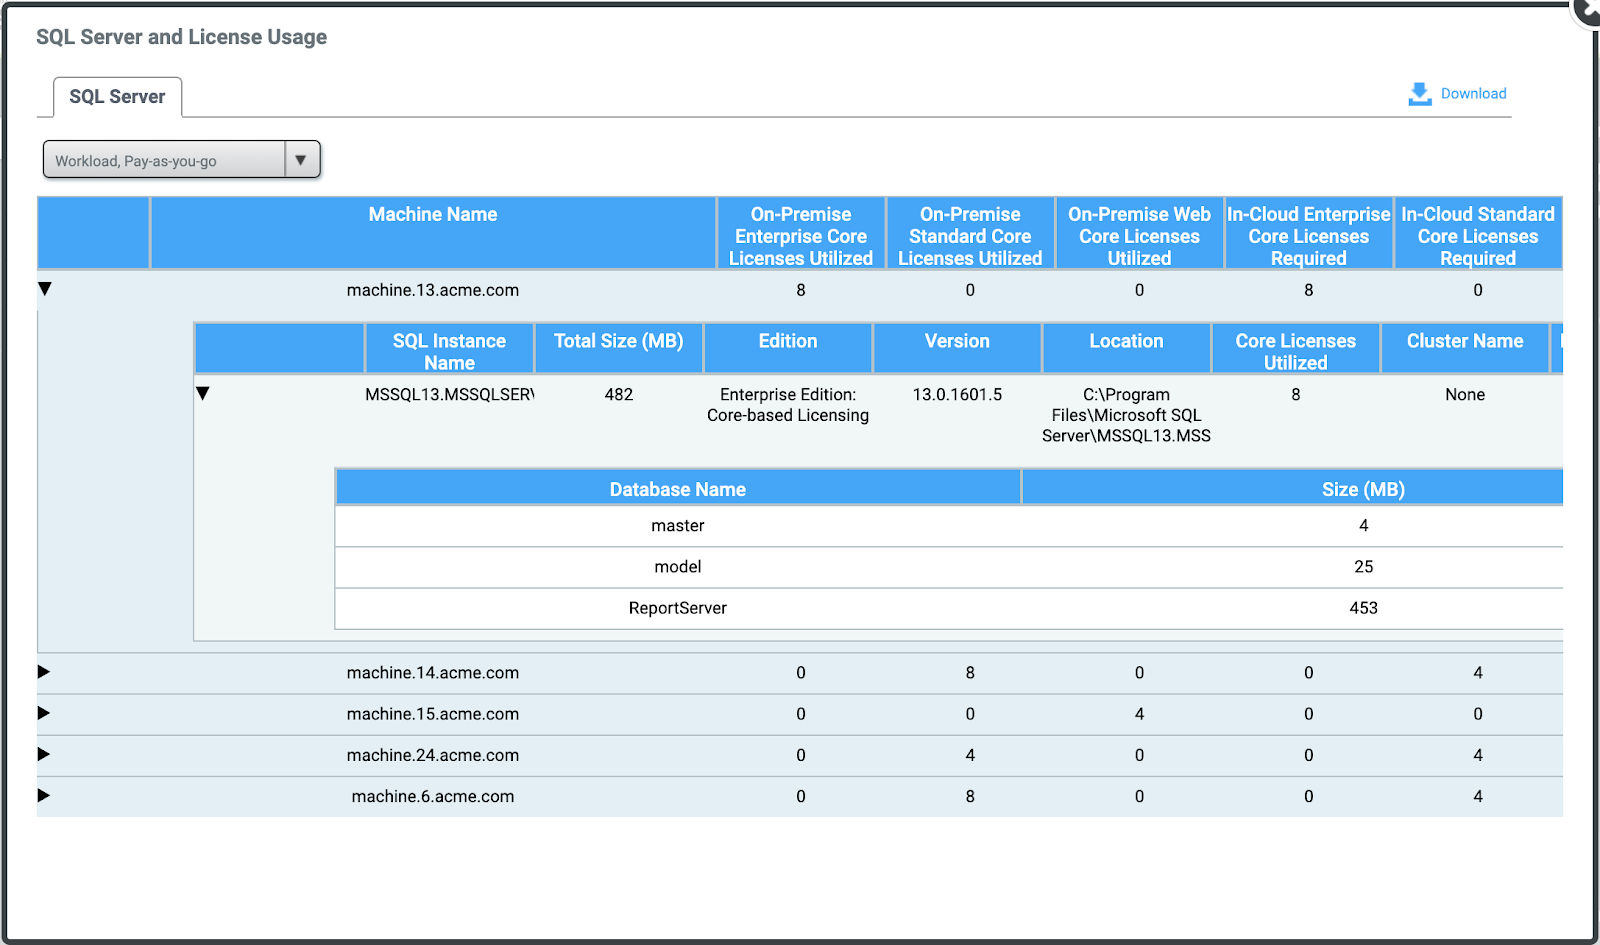 |
Using the Migration Planner, Cloudamize now provides a more in-depth look at the SQL Servers found in the assessed infrastructure. The information provided within the SQL Server and License Usage machine allows you to gain further insight into the on-premise licensing data and view a comparison of host-based versus VM-based SQL licensing. This feature also provides an overview of necessary on-cloud SQL licensing.
SQL Server
Provides a breakdown of the SQL Instances assessed and provides an overview including the number of licenses utilized and SQL database information such as size, edition, version, location and more.
On-Cloud License Usage
Provides a breakdown of license usage on-cloud including information such as the On-Cloud Instance type, Number of Hardware Threads, SQL Edition, and whether or not the SQL license is part of the BYOL program.
On-Premise Physical
View how many SQL licenses are needed on-cloud based on the observed on-premise configuration and Cloudamize recommended instances. The chart also includes information such as the Number of Hardware Threads, CPU Information, and number of required SQL Enterprise or Standard licenses. This chart also informs you as to whether or not any of the following services are running:
SQL Server Analysis Services
SQL Server Integration Services
SQL Server Report Services
SQL Server Master Data Services
On-Premise VMware
View how many SQL licenses are needed on-cloud based on the observed on-premise VMware configuration and Cloudamize recommended cloud instances. The chart also includes information such as the Number of Hardware Threads, CPU Information, and Number of Required SQL Enterprise or Standard licenses. Also provided is a summary of the VM-based and host-based SQL licenses broken down by Standard and Enterprise editions. This chart also informs you as to whether or not any of the following services are running:
SQL Server Analysis Services
SQL Server Integration Services
SQL Server Report Services
SQL Server Master Data Services
On-Premise HyperV
View how many SQL licenses are needed on-cloud based on the observed on-premise Hyper-V configuration and Cloudamize recommended cloud instances. The chart also includes information such as the Number of Hardware Threads, CPU Information, and Number of Required SQL Enterprise or Standard licenses. Also provided is a summary of the VM-based and host-based SQL licenses broken down by Standard and Enterprise editions. This chart also informs you as to whether or not any of the following services are running:
SQL Server Analysis Services
SQL Server Integration Services
SQL Server Report Services
SQL Server Master Data Services
Create CSV Move Groups
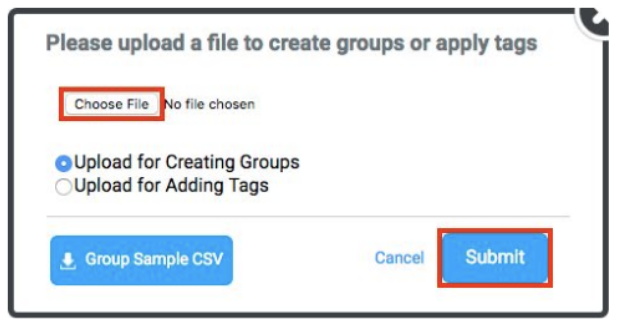
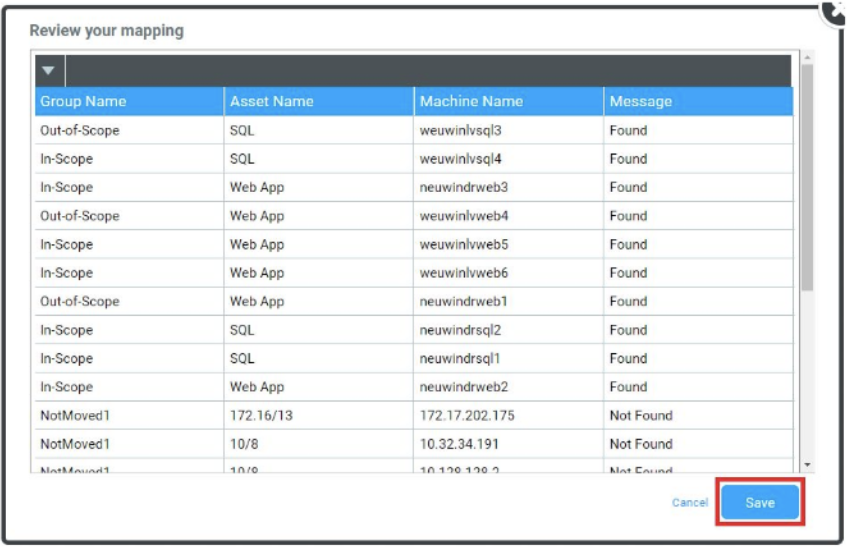
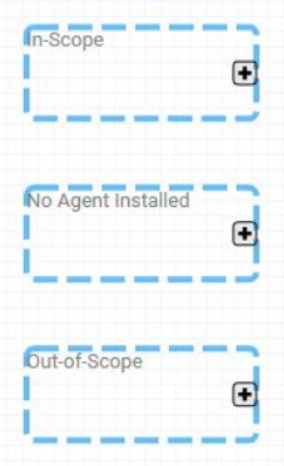
This section will walk you through creating a CSV-based move groups in the Migration Planner. You will learn how to format the CSV file, upload the file, select which columns to map groupings to, and then view the results.
Create a CSV format which will be used to regroup your machines. The layout of this file can vary significantly based on your specific use-case, however, you will always need a column with the machine names and at least two other columns to map to Group name, and Asset name. These columns could be anything relevant to the environment - Production/Non-Production, Migration Type, Application, Scope etc...
|  |
|  |
| 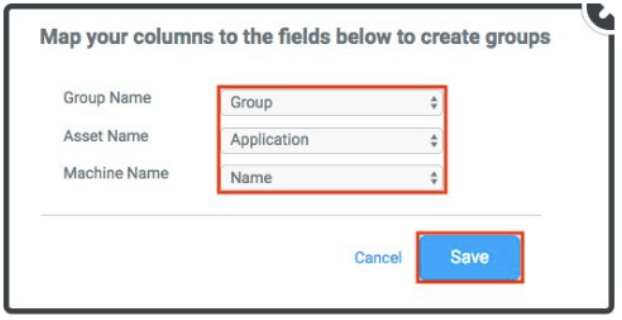 |
Click Save to apply the changes and return to the Migration Planner. | |
 |
|  |
Please Note: if there are duplicate machine names or IP addresses, the file will not upload. In order to resolve this, please submit a ticket to helpdesk with the info we need.
Create Custom CSV Output
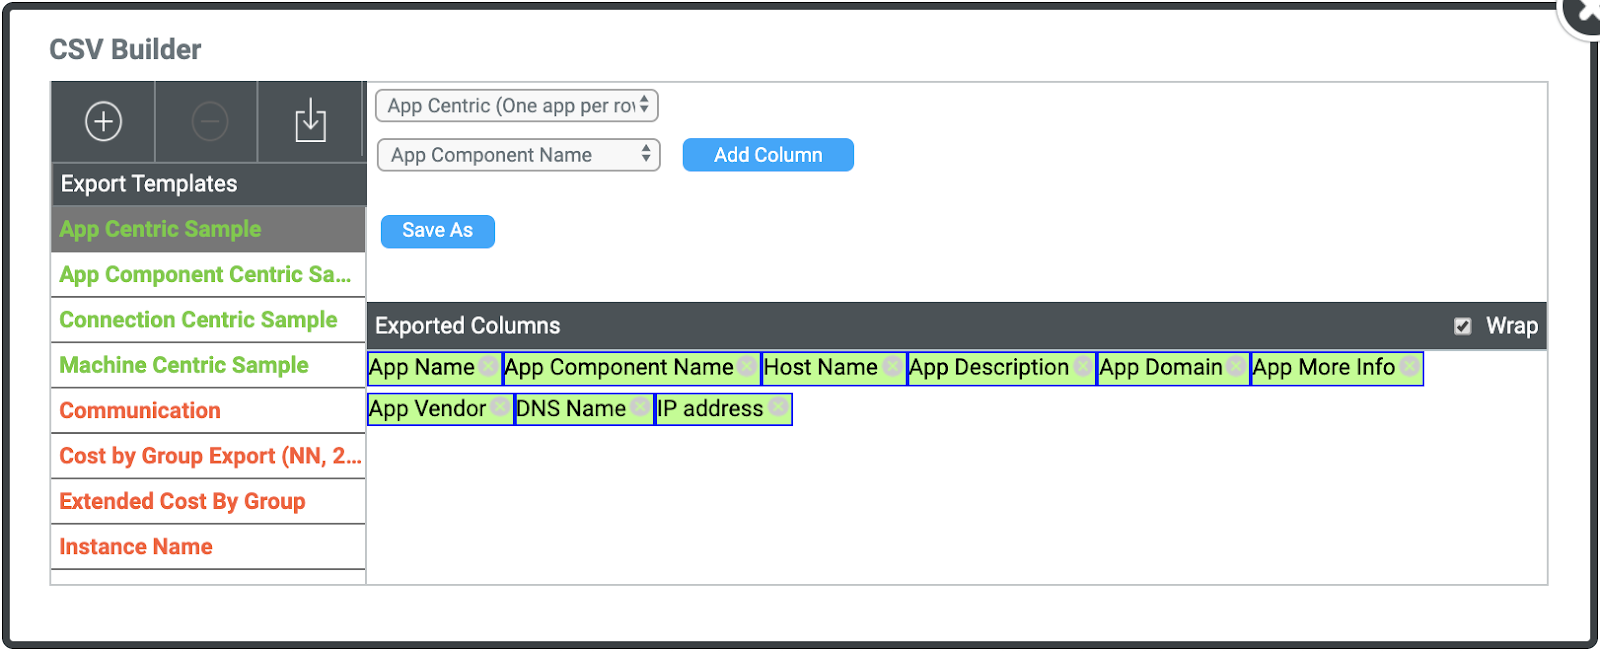
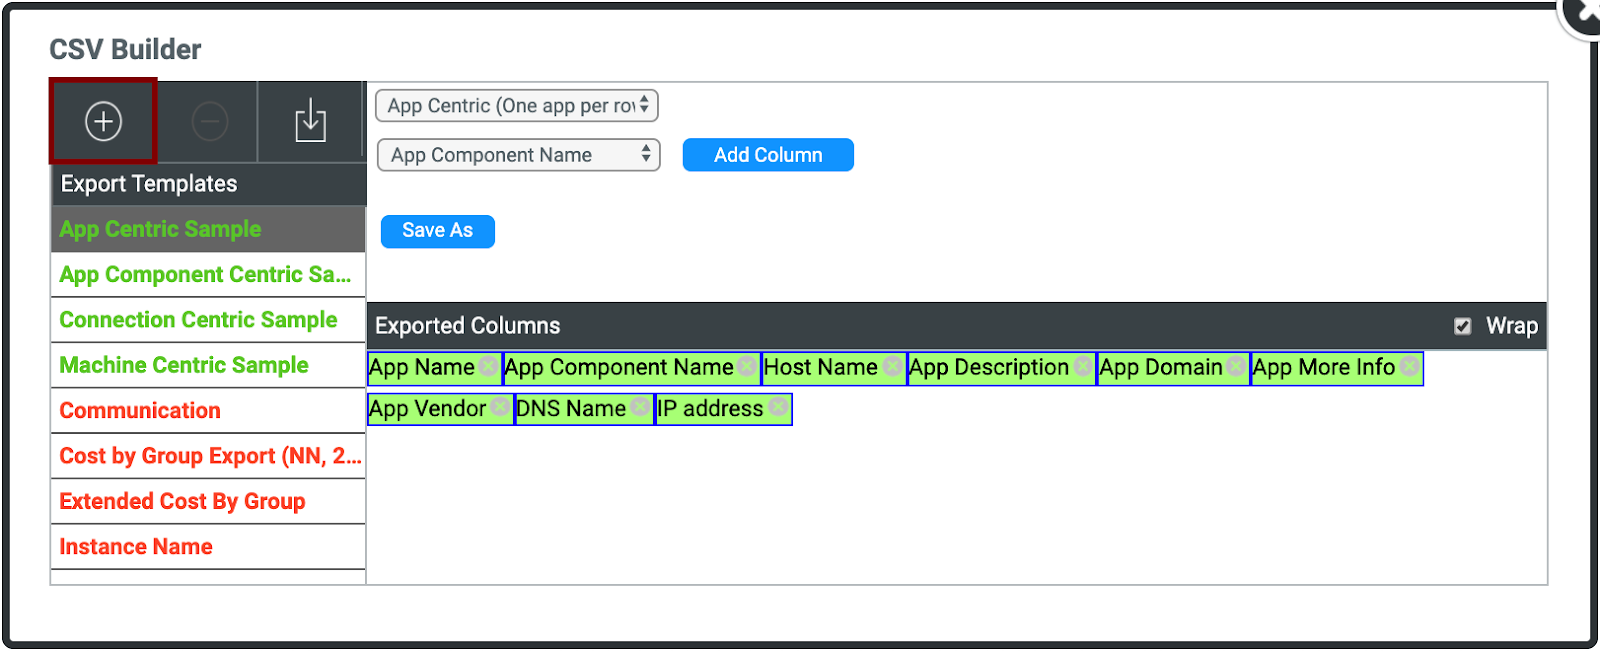
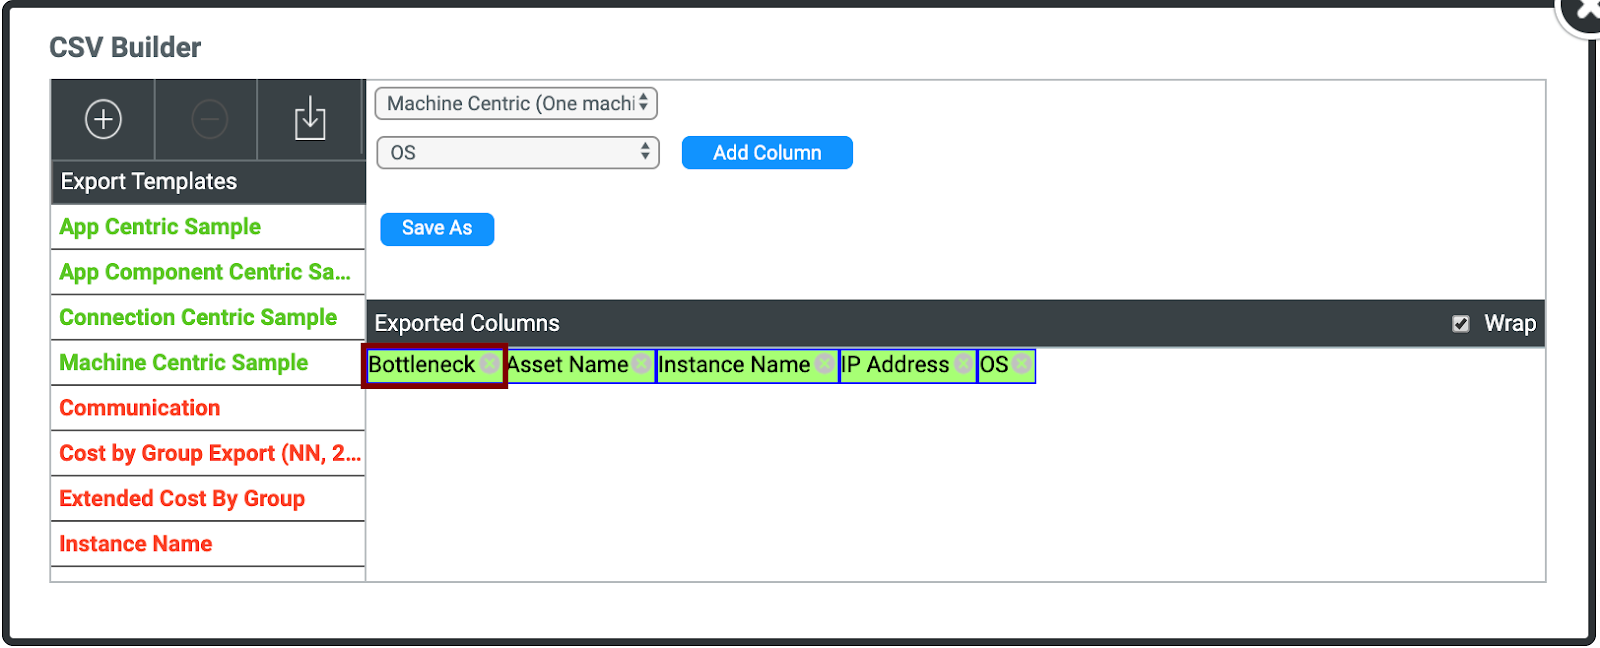
The Cloudamize CSV Builder allows you to create custom CSV outputs to provide you with the data which is most important to you. You can choose the categories to display as columns in the downloadable CSV output and you can reorder the columns to fit your needs.
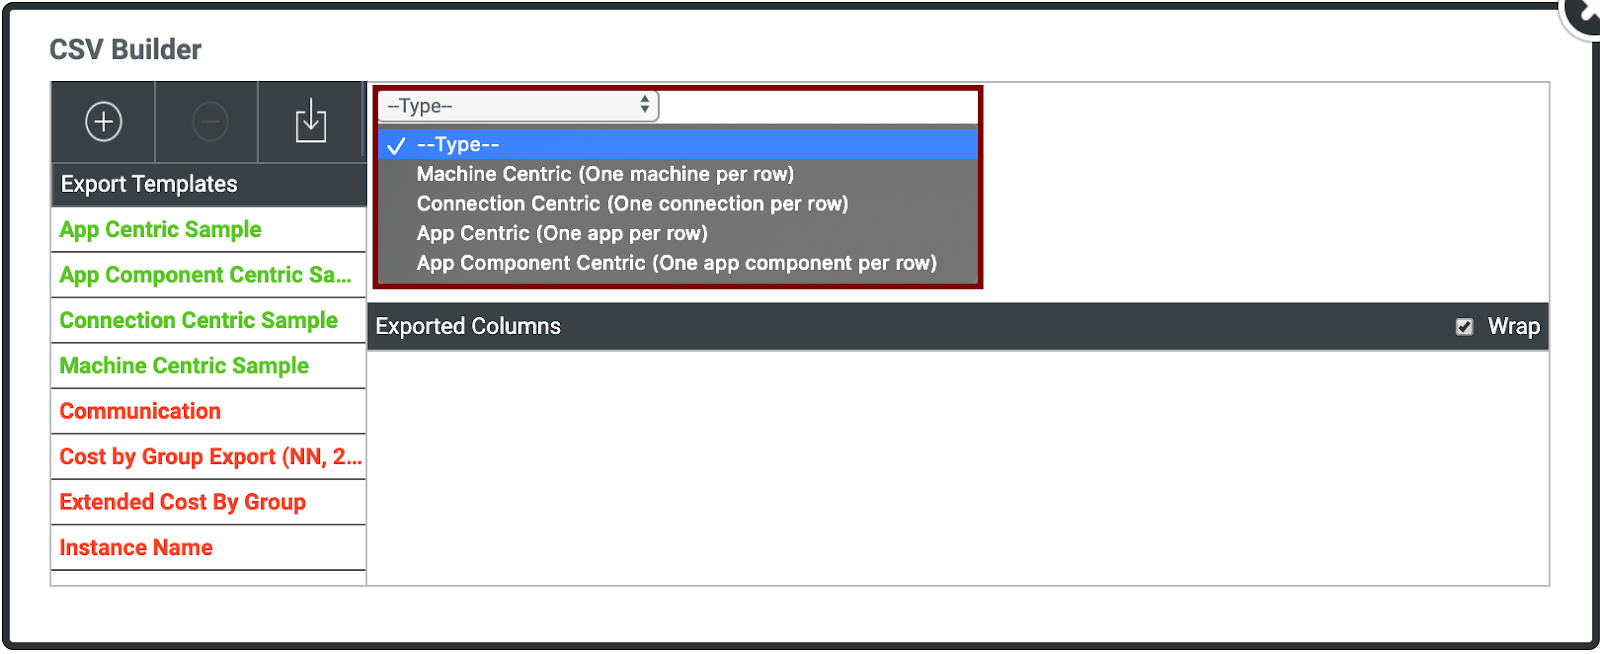
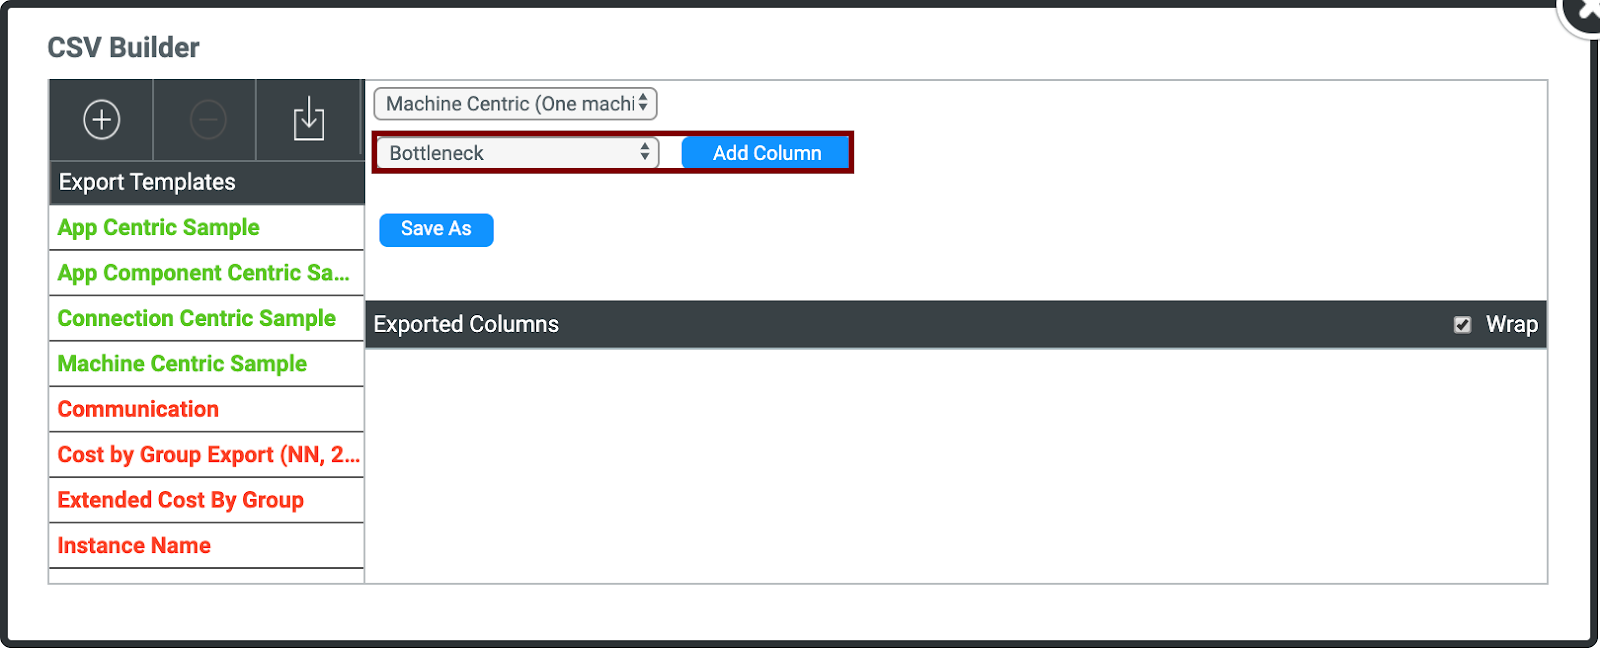
Select Columns based on machine-centric data such as observed and recommended number of CPU threads, allocated memory, operating system and many more. You can also create templates based on application-centric data such as the application category, description, vendor, process, etc.
Easily select the templates you need and choose a pricing plan to apply.
The CSV Builder is located in the Migration planner, inside the More Tools drop-down box. Click More Tools and then click CSV Builder. | 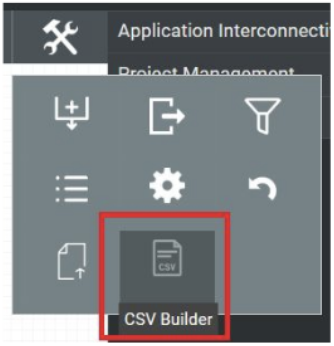 |
You will be presented with the CSV Builder window. | |
 | |
Create a New Template
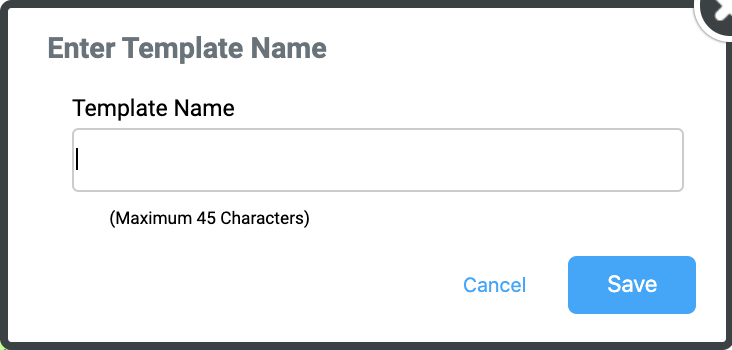
In the CSV Designer, you can create new templates, customize existing templates, and delete templates which you no longer need. Here you can also view existing templates
|
 |
|
 |
|
 |
|
 |
|
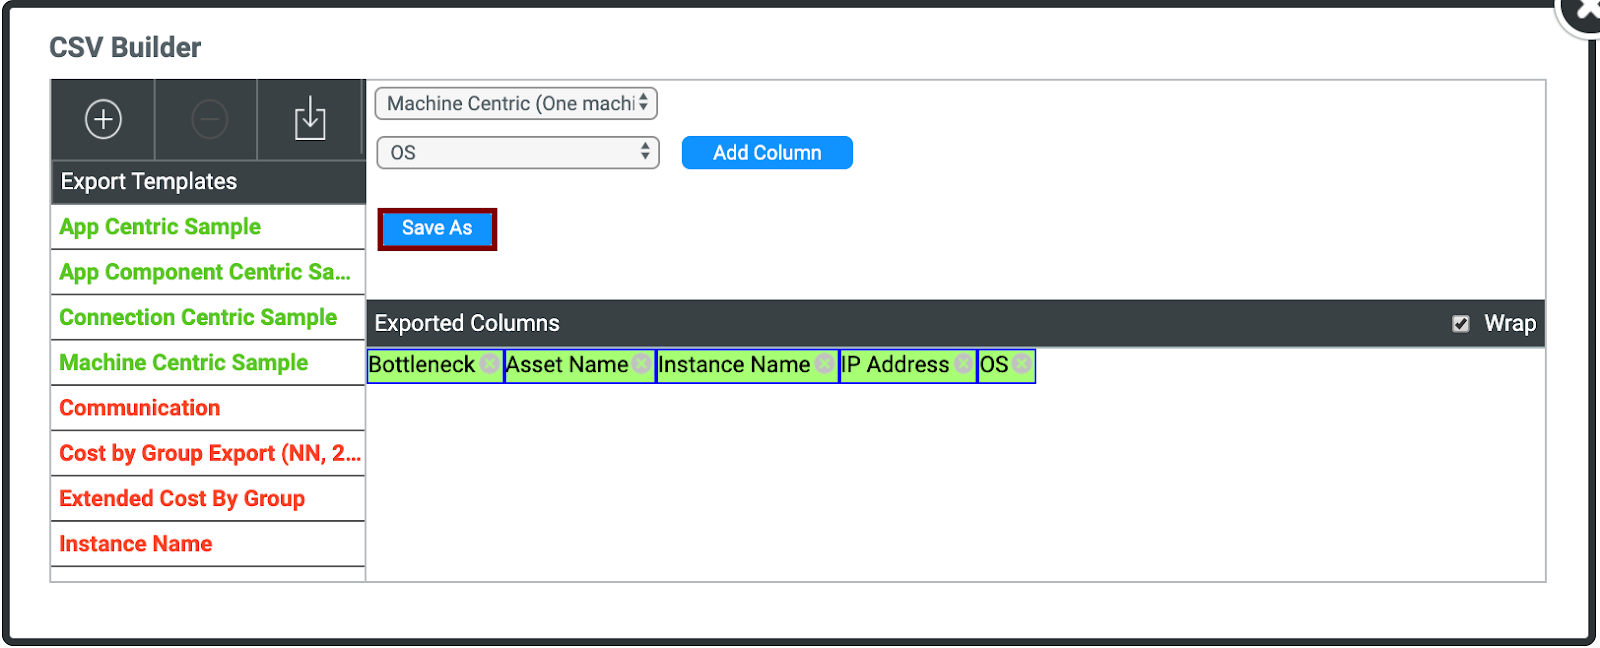 |
| 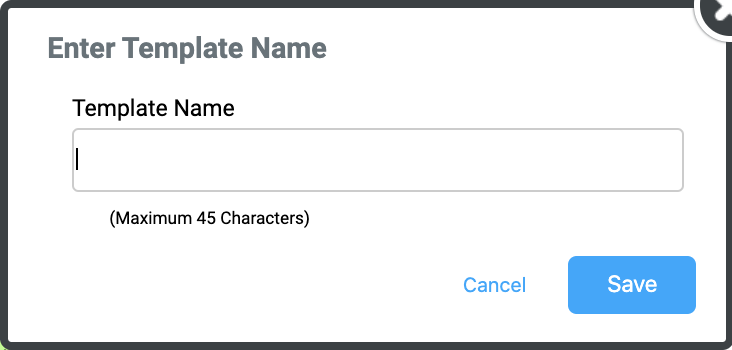 |
Edit an Existing Template
|
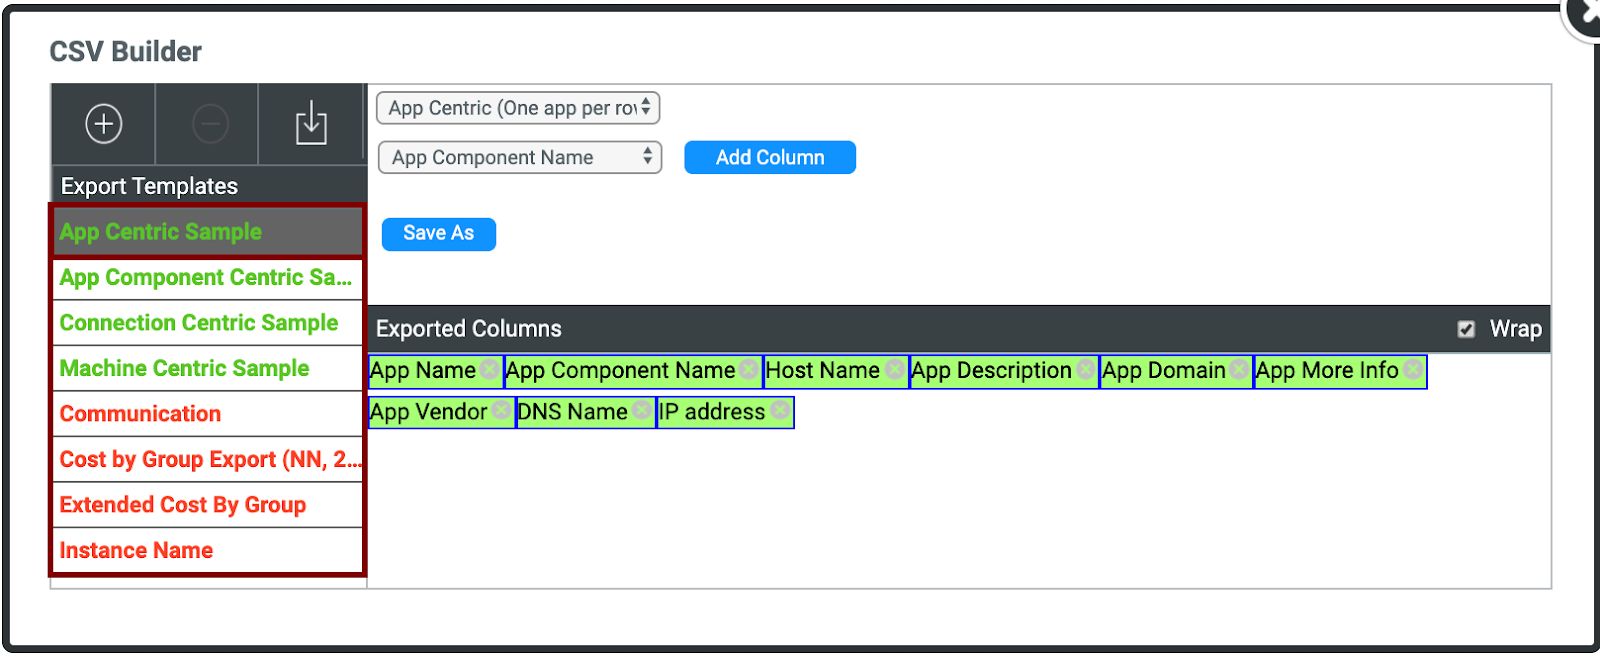 |
|
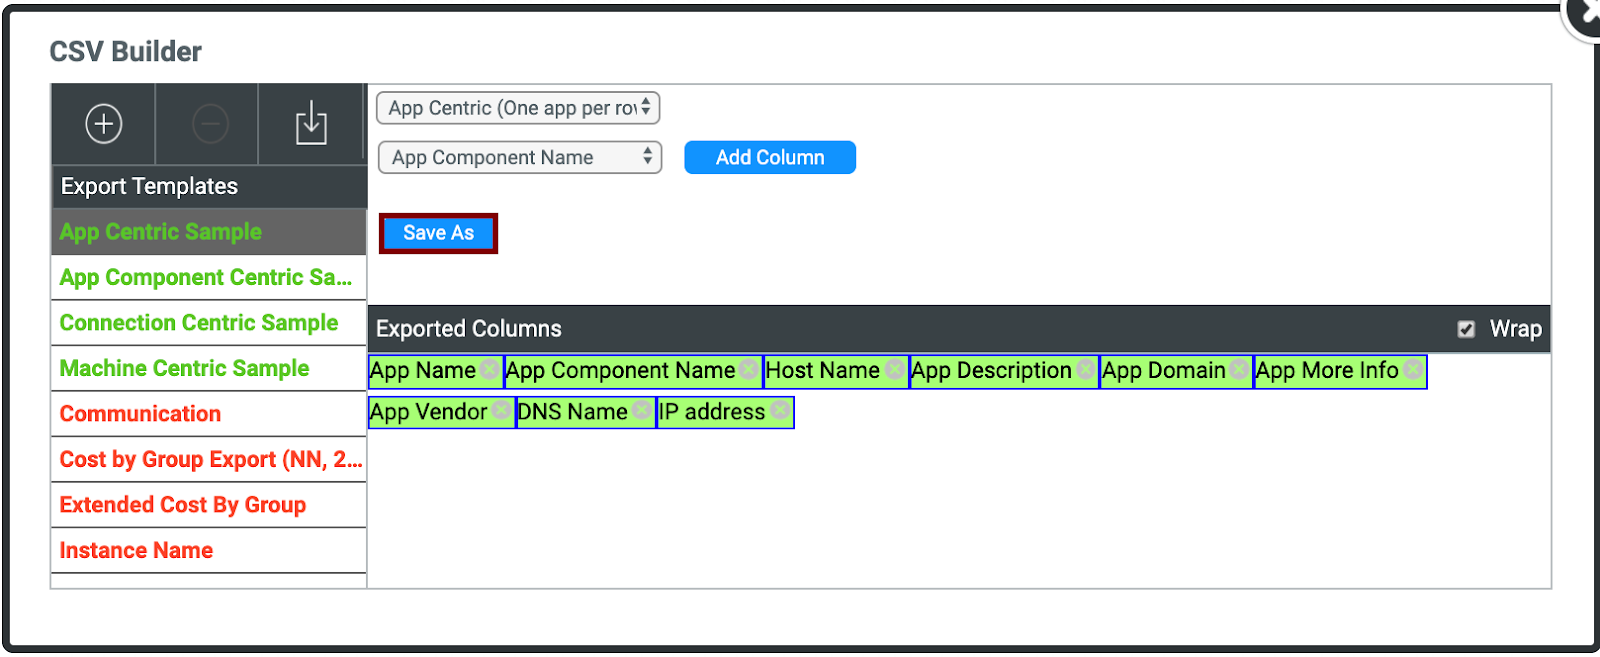
|
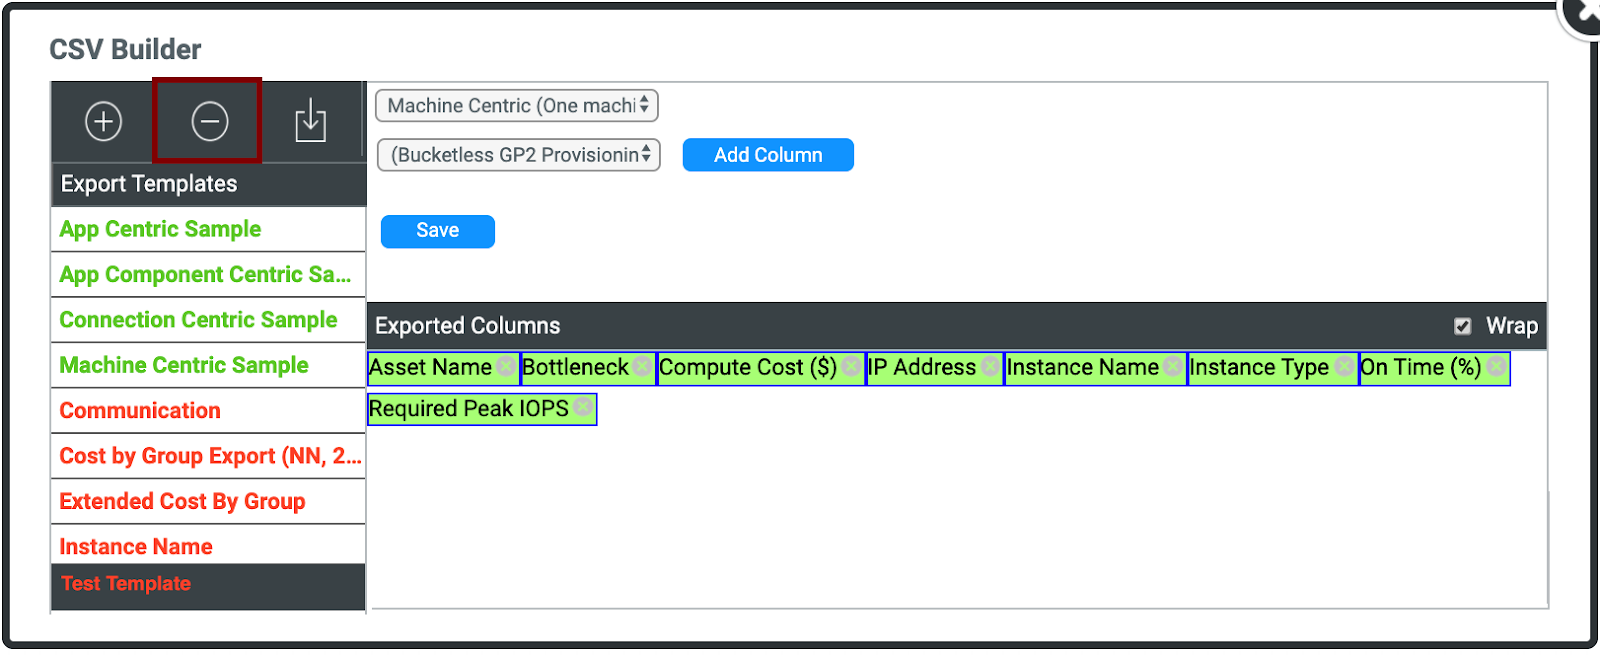
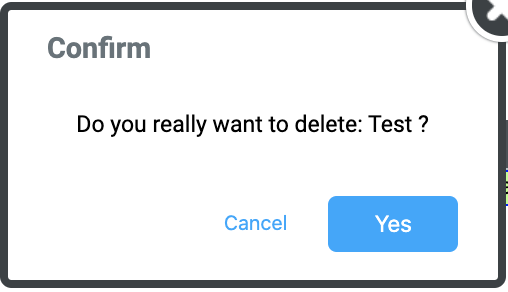
Delete a Template
Please Note: it is not possible to delete any of the pre-created templates
|
 |
|  |
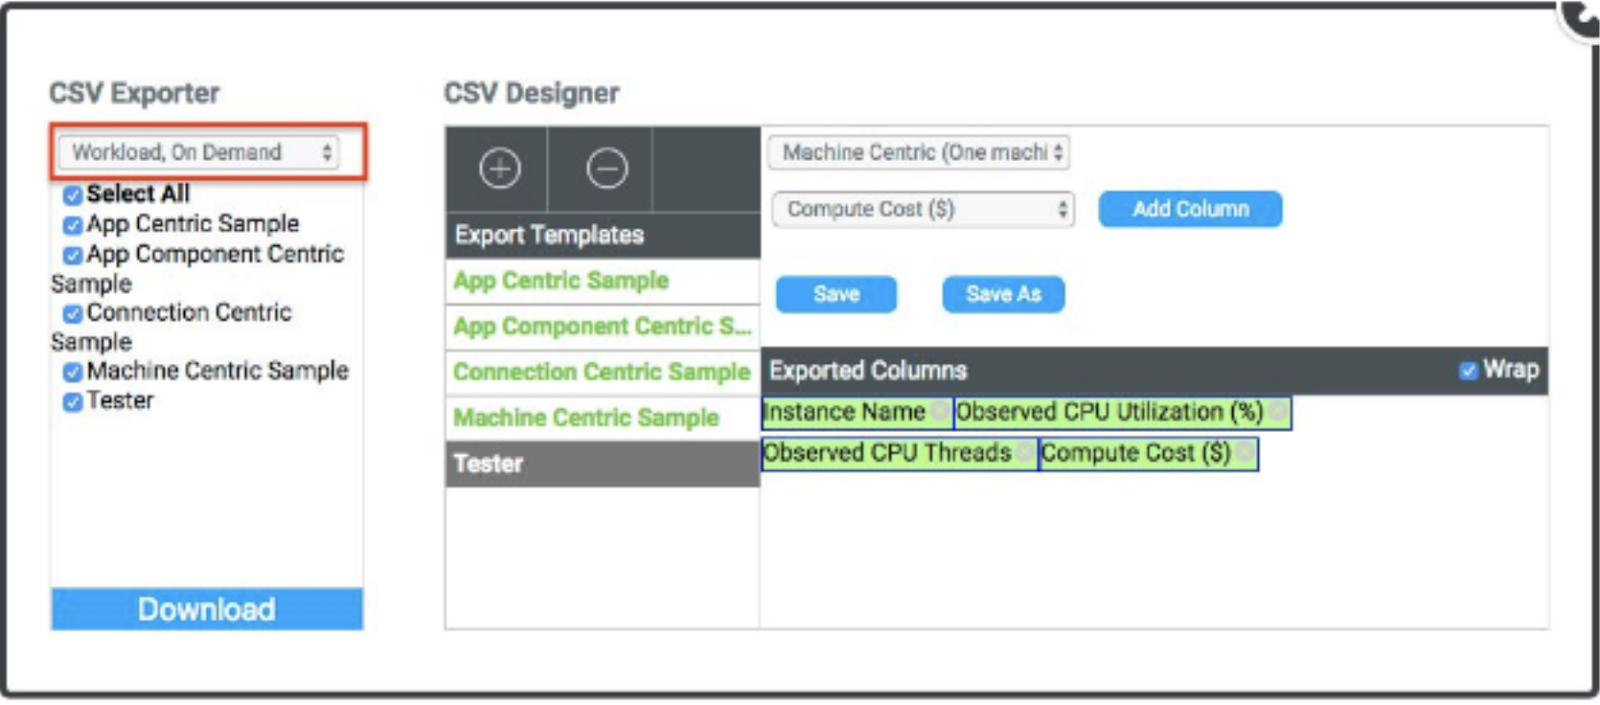
Export Custom Templates
|
 |
|
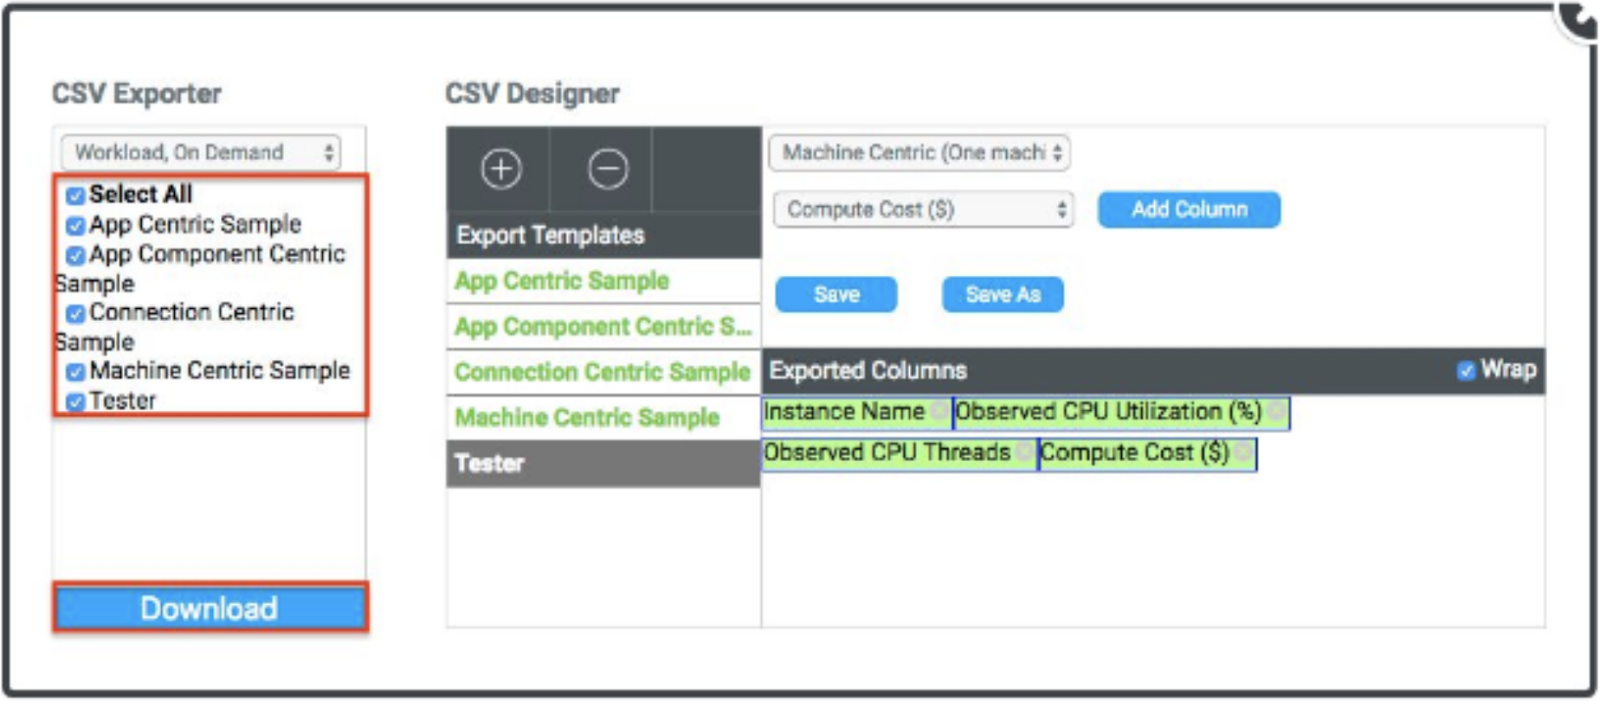 |
Undo Changes in the Migration Planner
As your migration plan is built, a timestamp is created to allow you to undo any changes you have made to the canvas.
| 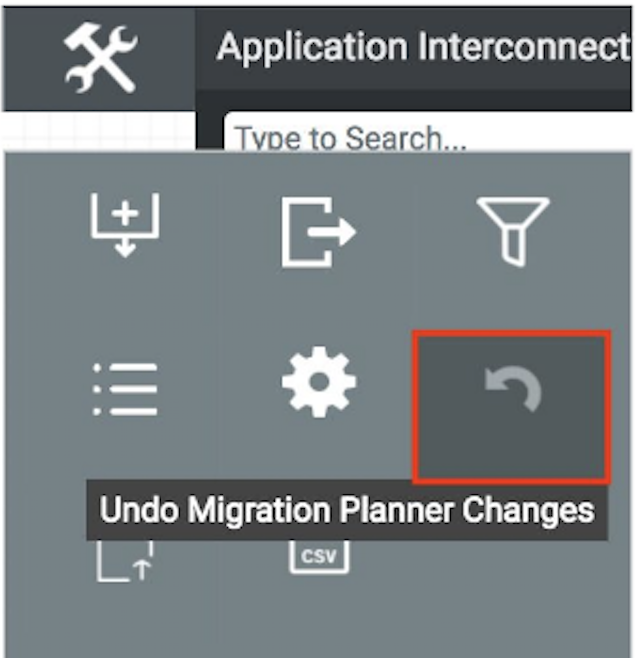 |
|
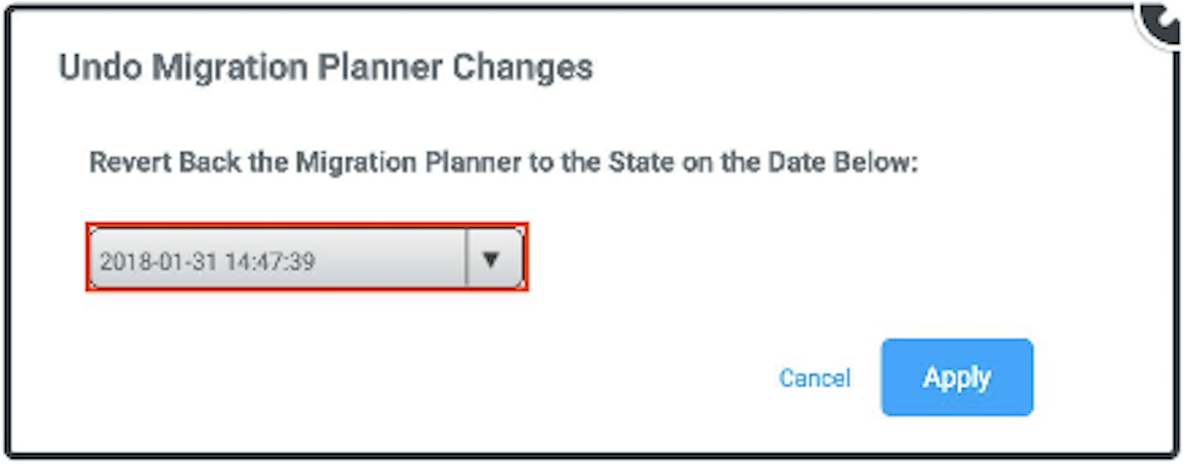 |
How to Use Pre-Built Reports in the Migration Planner
The Migration Planner provides many pre-populated reports, and also enables you to create your own.
First select, Group, Asset, or Node on the Canvas, or on the left-hand navigation panel. The reports will focus solely on that selected Group, Asset, or Node. After making your selection, you can find all the reports under the Summary [tab] in the lower corner of the right-hand navigation panel.
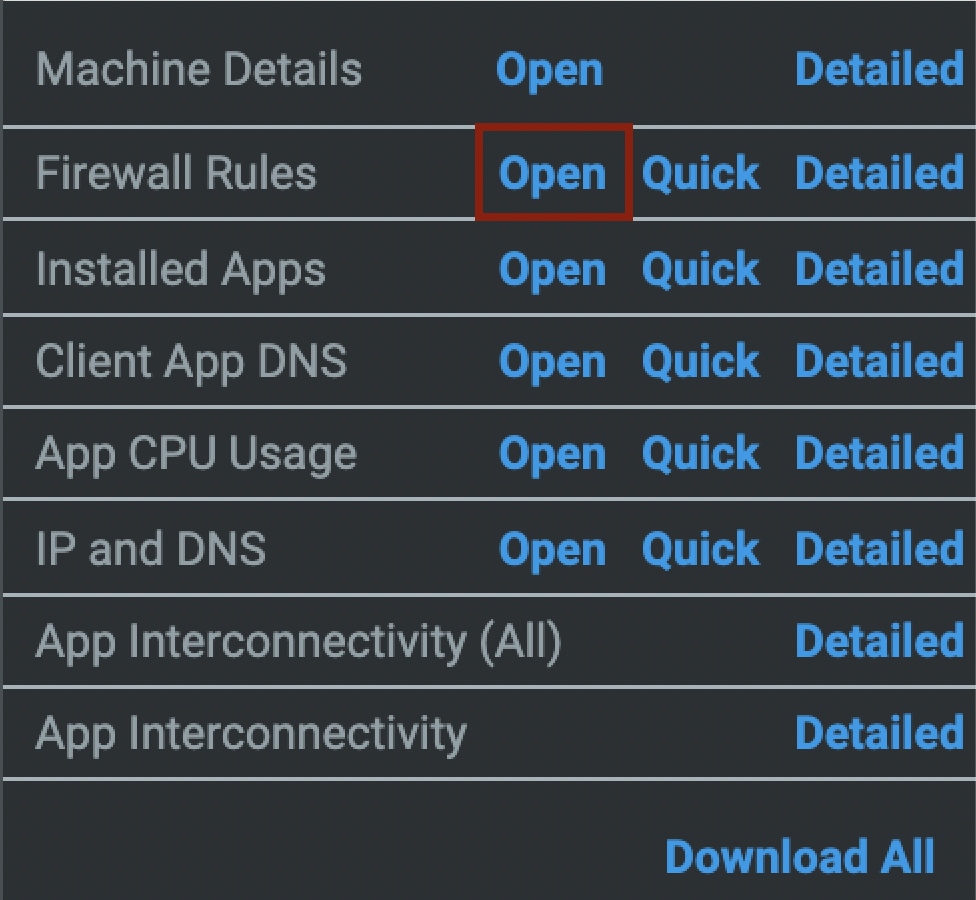
For the selected, Group, Asset, or Node you can view Cost, Firewall Rules, Installed Apps, DNS, App CPU Usage, IP & DNS, and Application Interconnectivity view.
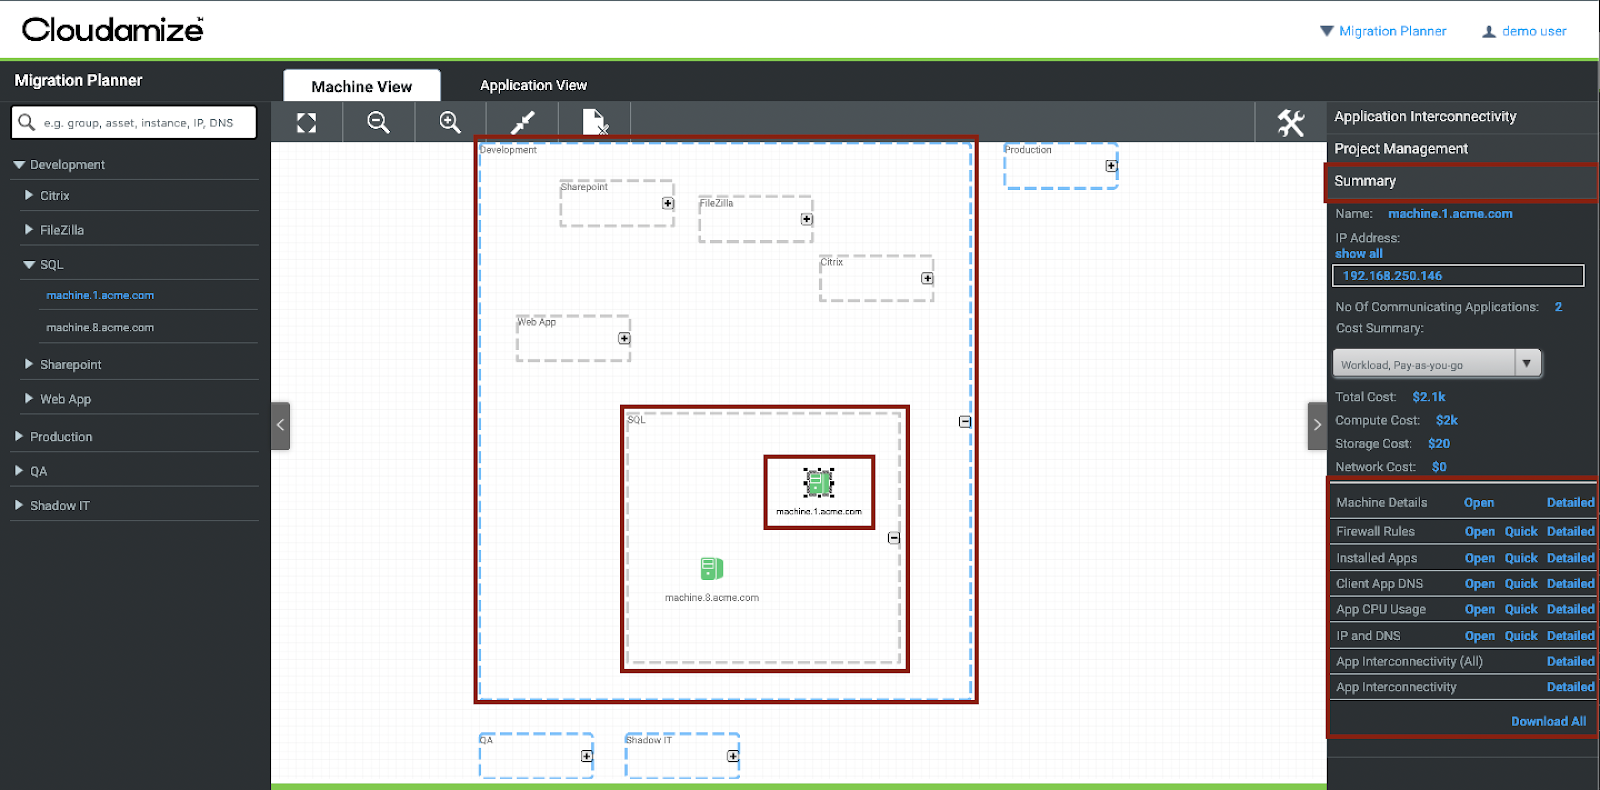
Firewall Rules
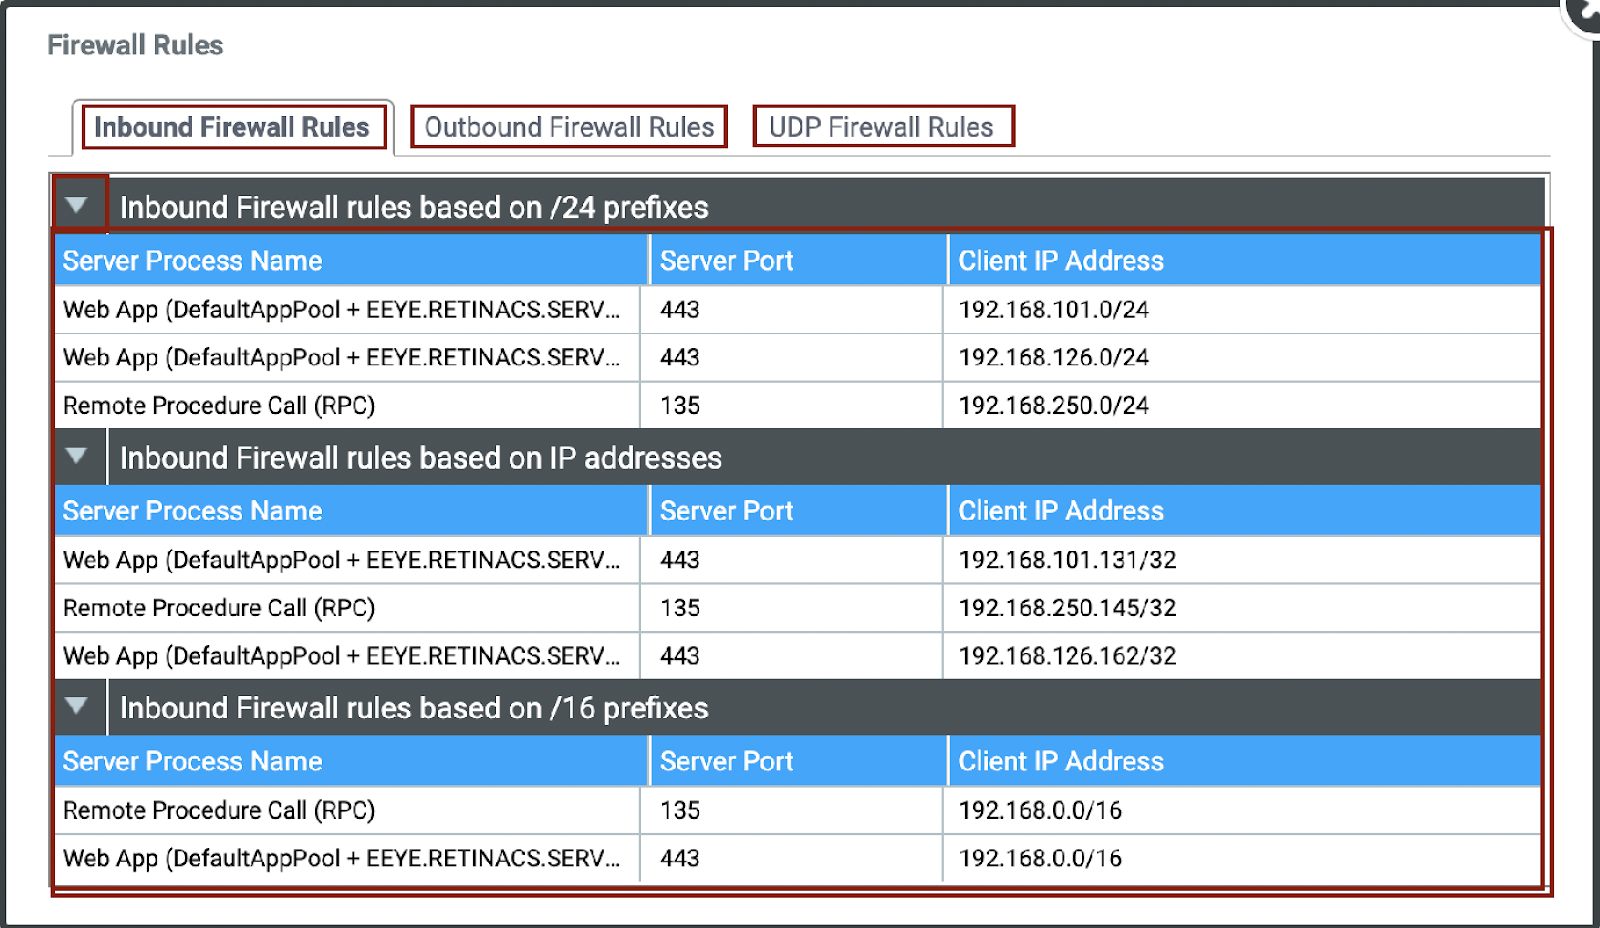
By ‘clicking’ on Firewall Rules, it will open a new window and present you with a [tab] for Inbound Firewall Rules, Outbound Firewall Rules, and UDP Firewall Rules.
Under each rule [tab] you will be presented with a process name, server port, and the Client IP Address.
|  |
Under the Inbound [tab] you can view /16, /24, or /32 Firewall Rules
Installed AppsBy ‘clicking’ on Installed Apps, it will open a new window and present you with a report for your selected Group, Asset, or Node. 
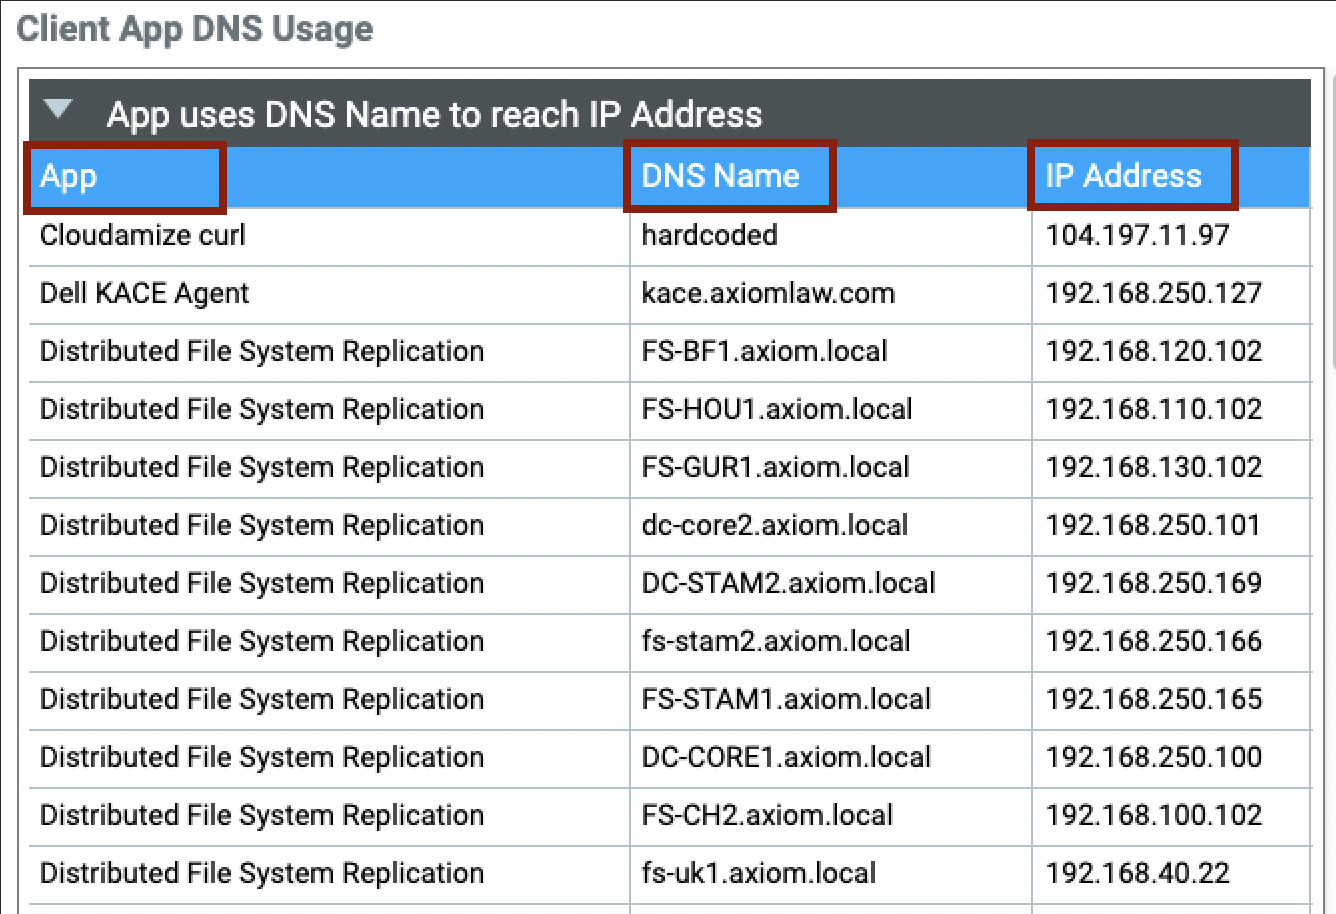
This report presents the name of the applications, their versions, and the application vendor. Please Note, that this is only available for projects with less than 400 nodes 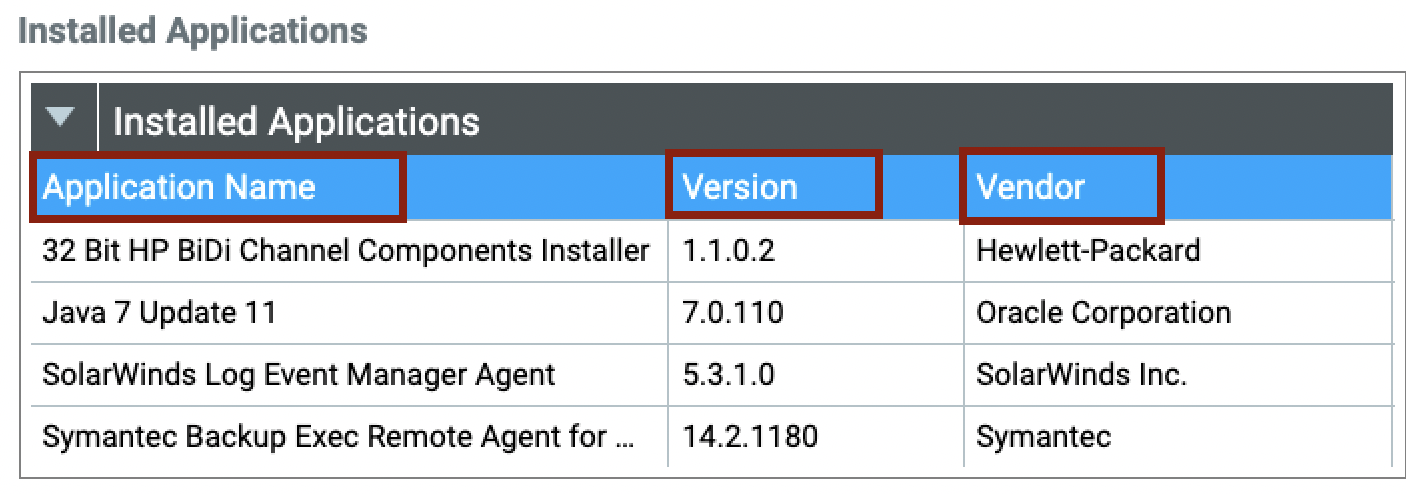 Client App DNSBy ‘clicking’ on Client App DNS, it will open a new window and present you with a report and provide you with the name of the application, along with the DNS name that application uses to reach the specified IP Address. 
 App CPU UsageBy ‘clicking’ on App CPU Usage, it will open a new window and present you with a report and list the individual process name, along with the observed CPU usage of that application. 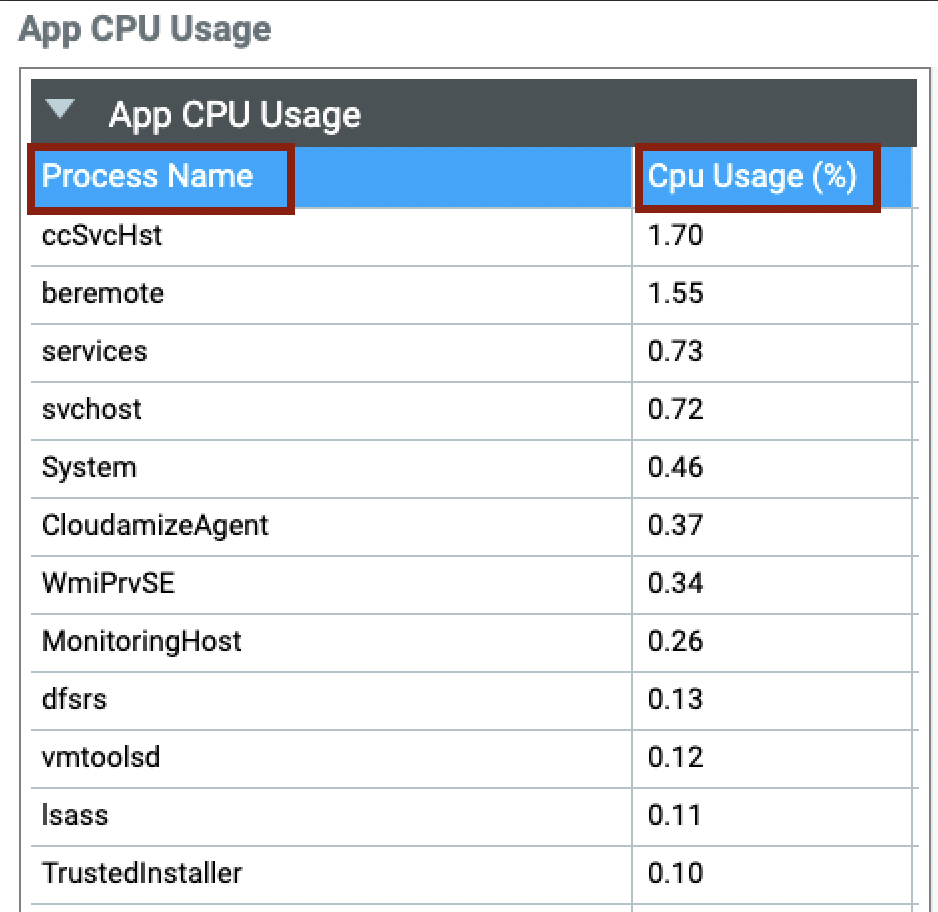  IP and DNSBy ‘clicking’ on IP and DNS, it will open a new window and present you with a report and list the IP Address and DNS Name for each observed machine.   App Interconnectivity (All)By ‘clicking’ on App Interconnectivity (All), it will open a new window and present you with an excel report, which will show all communication observed by Cloudamize. 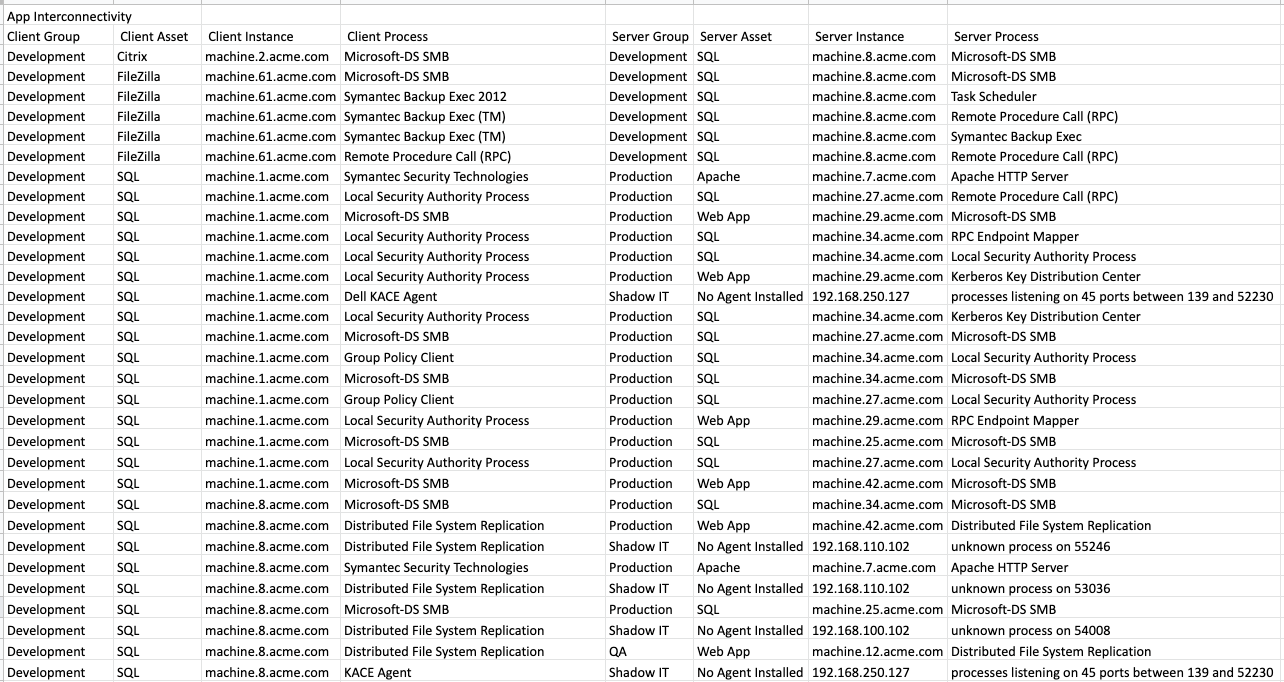  App InterconnectivityBy ‘clicking’ on App Interconnectivity, it will open a new window and present you with an excel report, which will detail only communication between applications being considered for migration. You can control what is being considered for migration by using the application inventory settings. 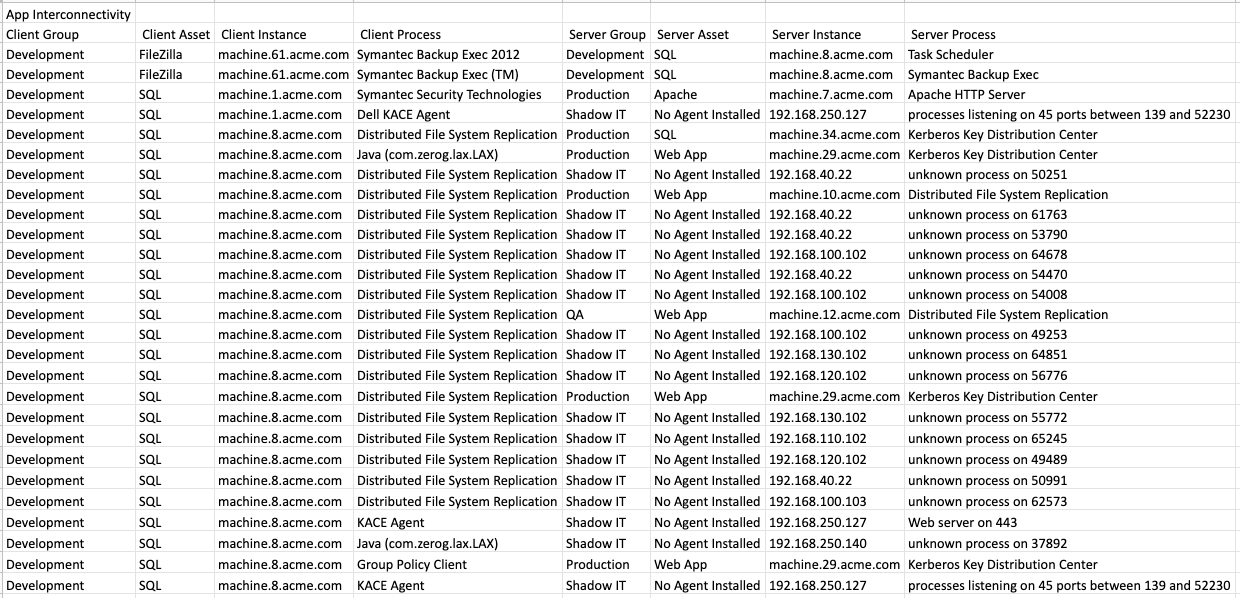  Inter-Node CommunicationBy ‘clicking’ on Inter-Node Communication, it will open a new window and present you with an excel report, which will show all the connections of a selected Group, Asset, or Node. This will allow you to view all the dependencies, and help prioritize applications for migration. For example, if there are too many outbound server connections, you are able to review and decide if that should be part of your ‘Phase One’ migration.
 
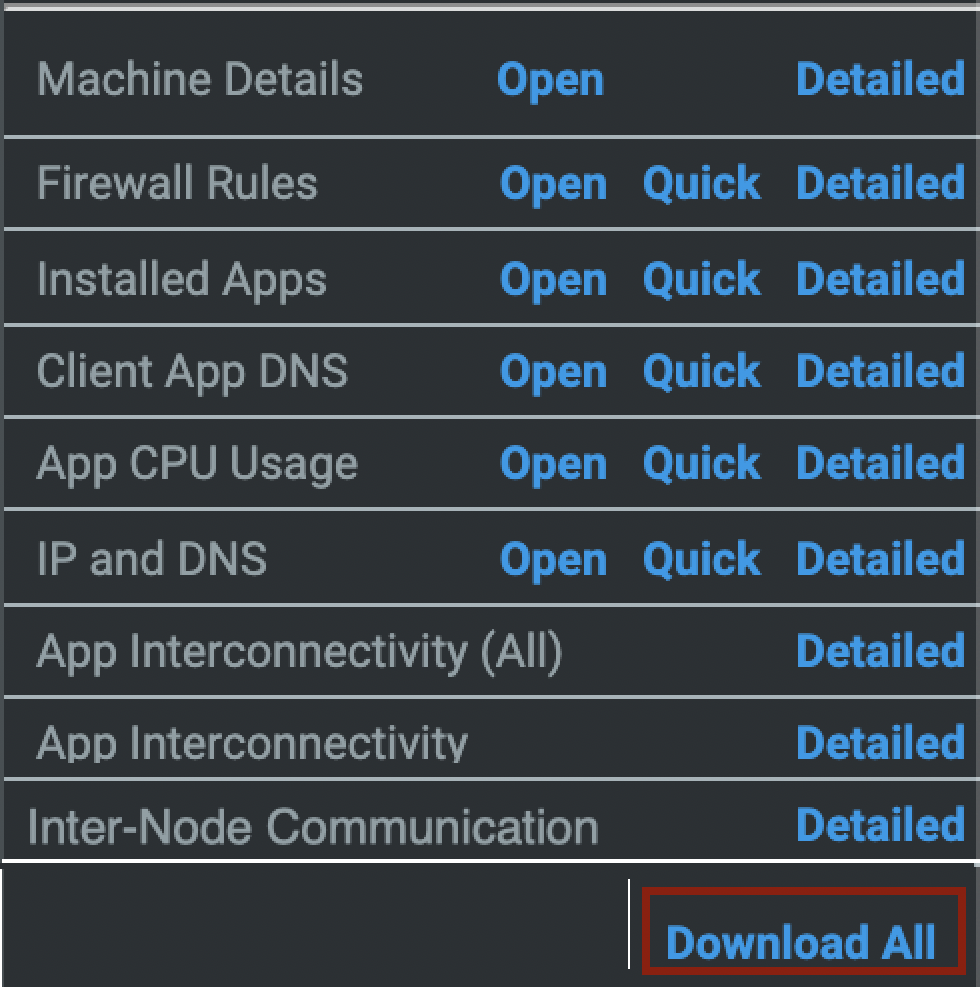
All reports are available for download, individually here, or you have the option to ‘Download All’ at the bottom of the report list. This will create an excel report detailing all of the information, except for the Application Interconnectivity due to the size of the interconnectivity report, it must be downloaded separately. This report also includes the Compute, Storage, and Network from the assess dashboard.
| |
No Agent
The No Agent group is used in the MIgration Planner to show workloads outside of the scope of the of the Cloudamize assessment. This group provides details of the machine within the scope of the assessment, along with any available information on the unmonitored server.
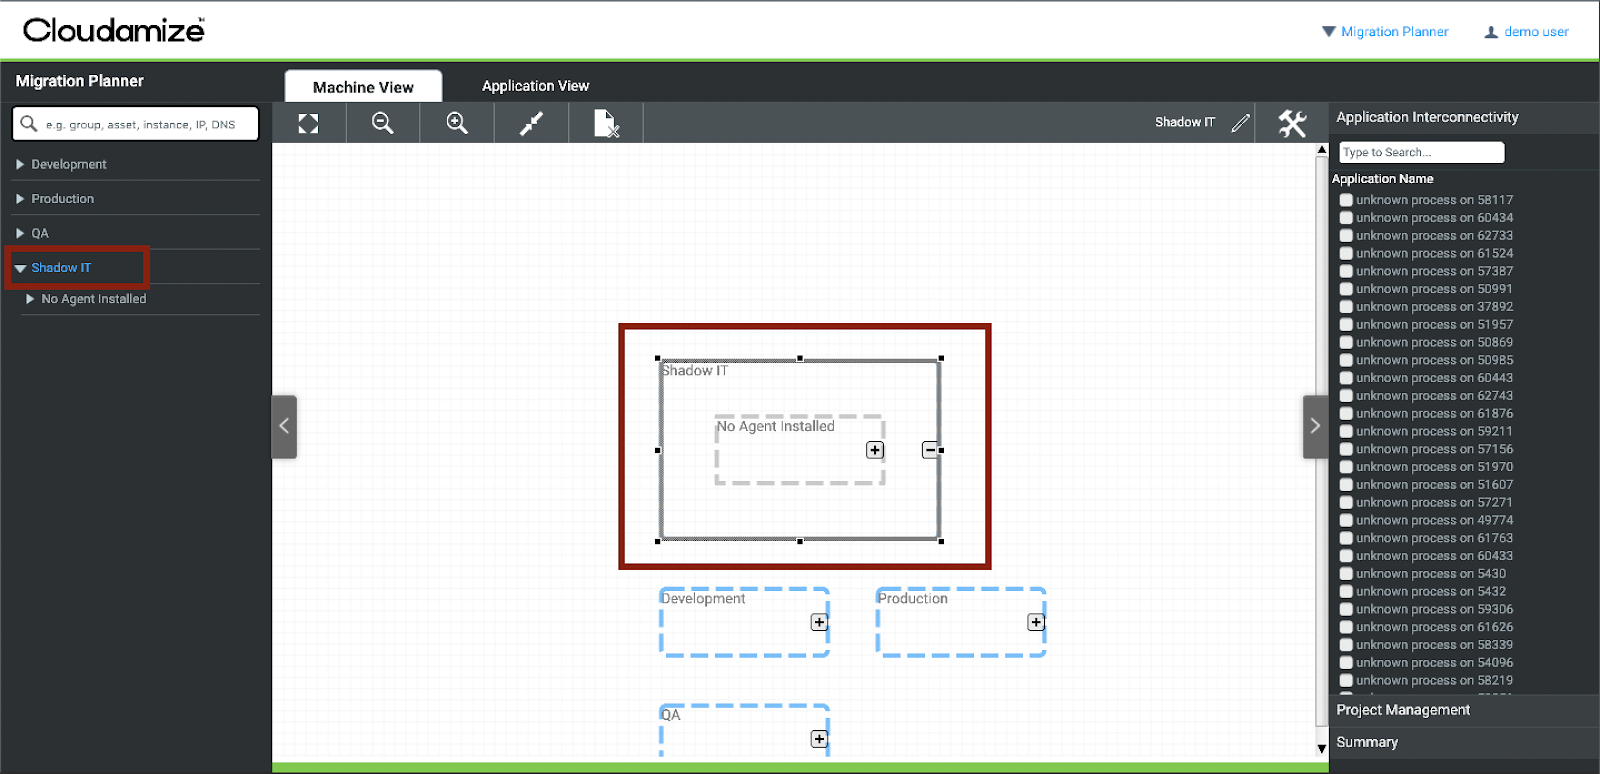 |
This allows you to monitor any unknown connectivity outside of the assessment scope, or any potential Shadow IT.
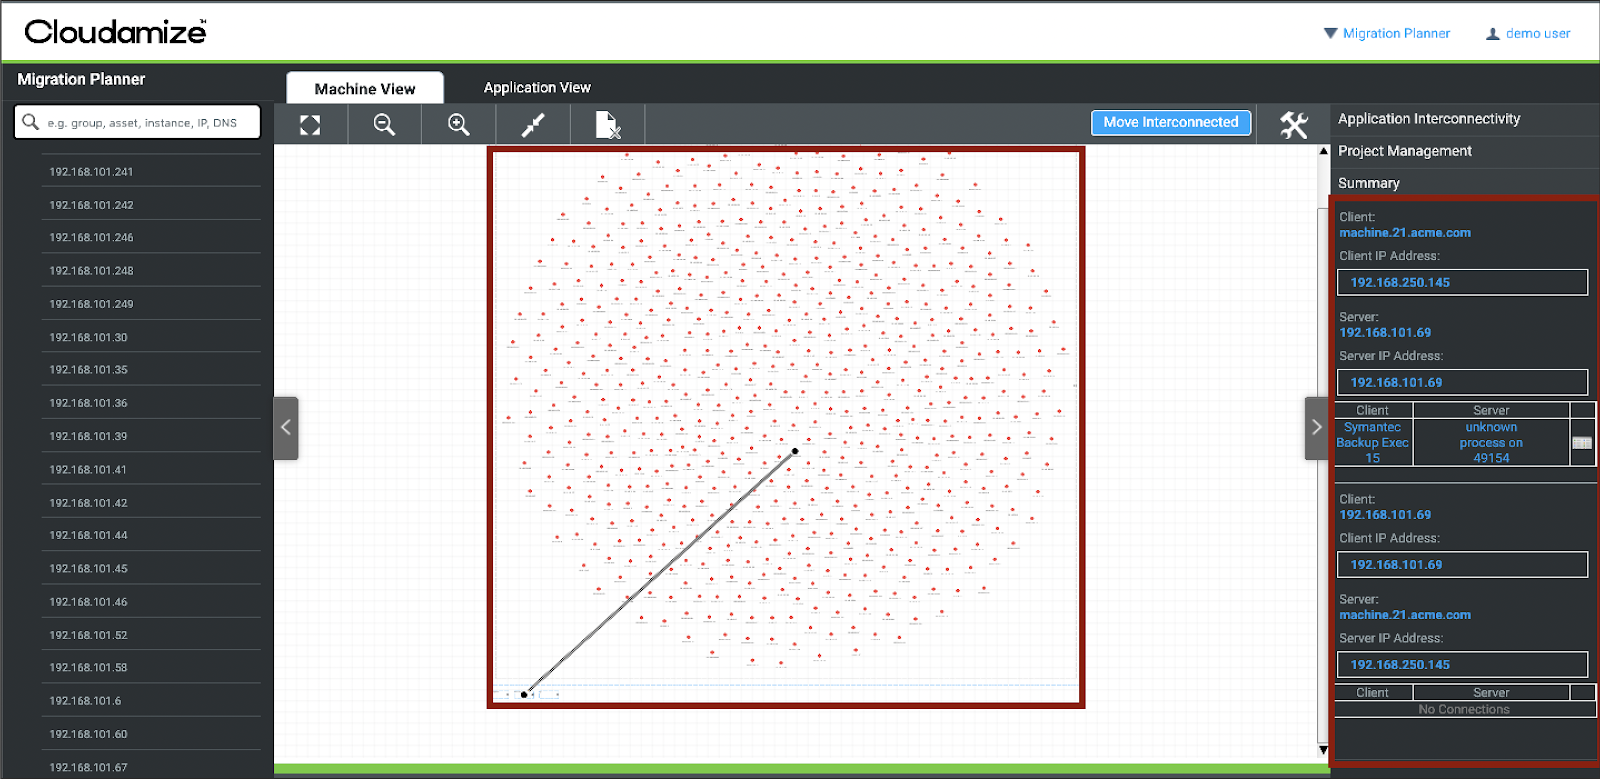 |
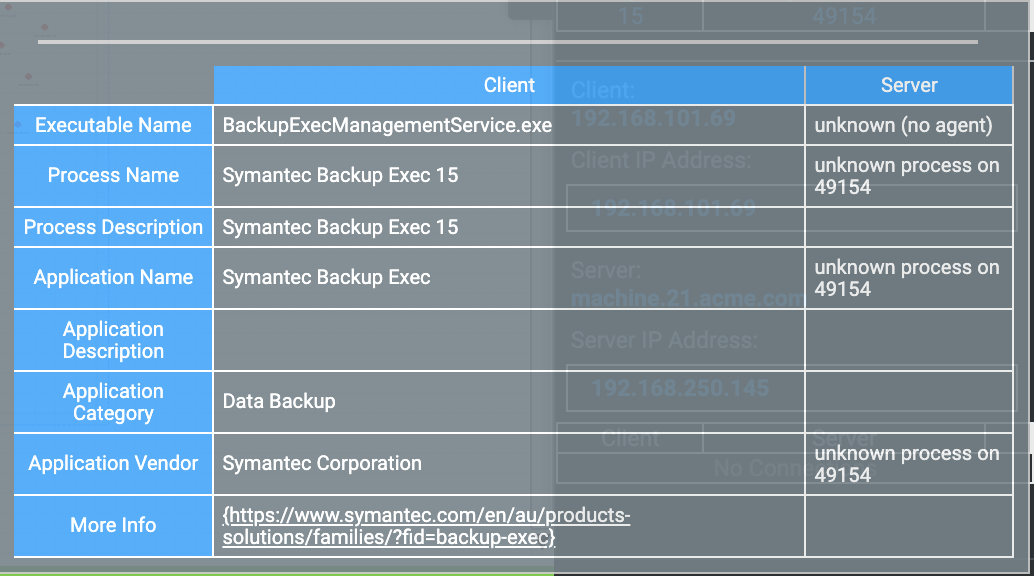
By clicking on an individual independency, you will be presented with a closer look at the monitored client, along with any available information on the unknown machine.
 |
