

Overview
Upon delivery of assessments that used Cloudamize Agent or Agentless Data Collectors, the Analyze page will contain a button to download the Observed Infrastructure Report:
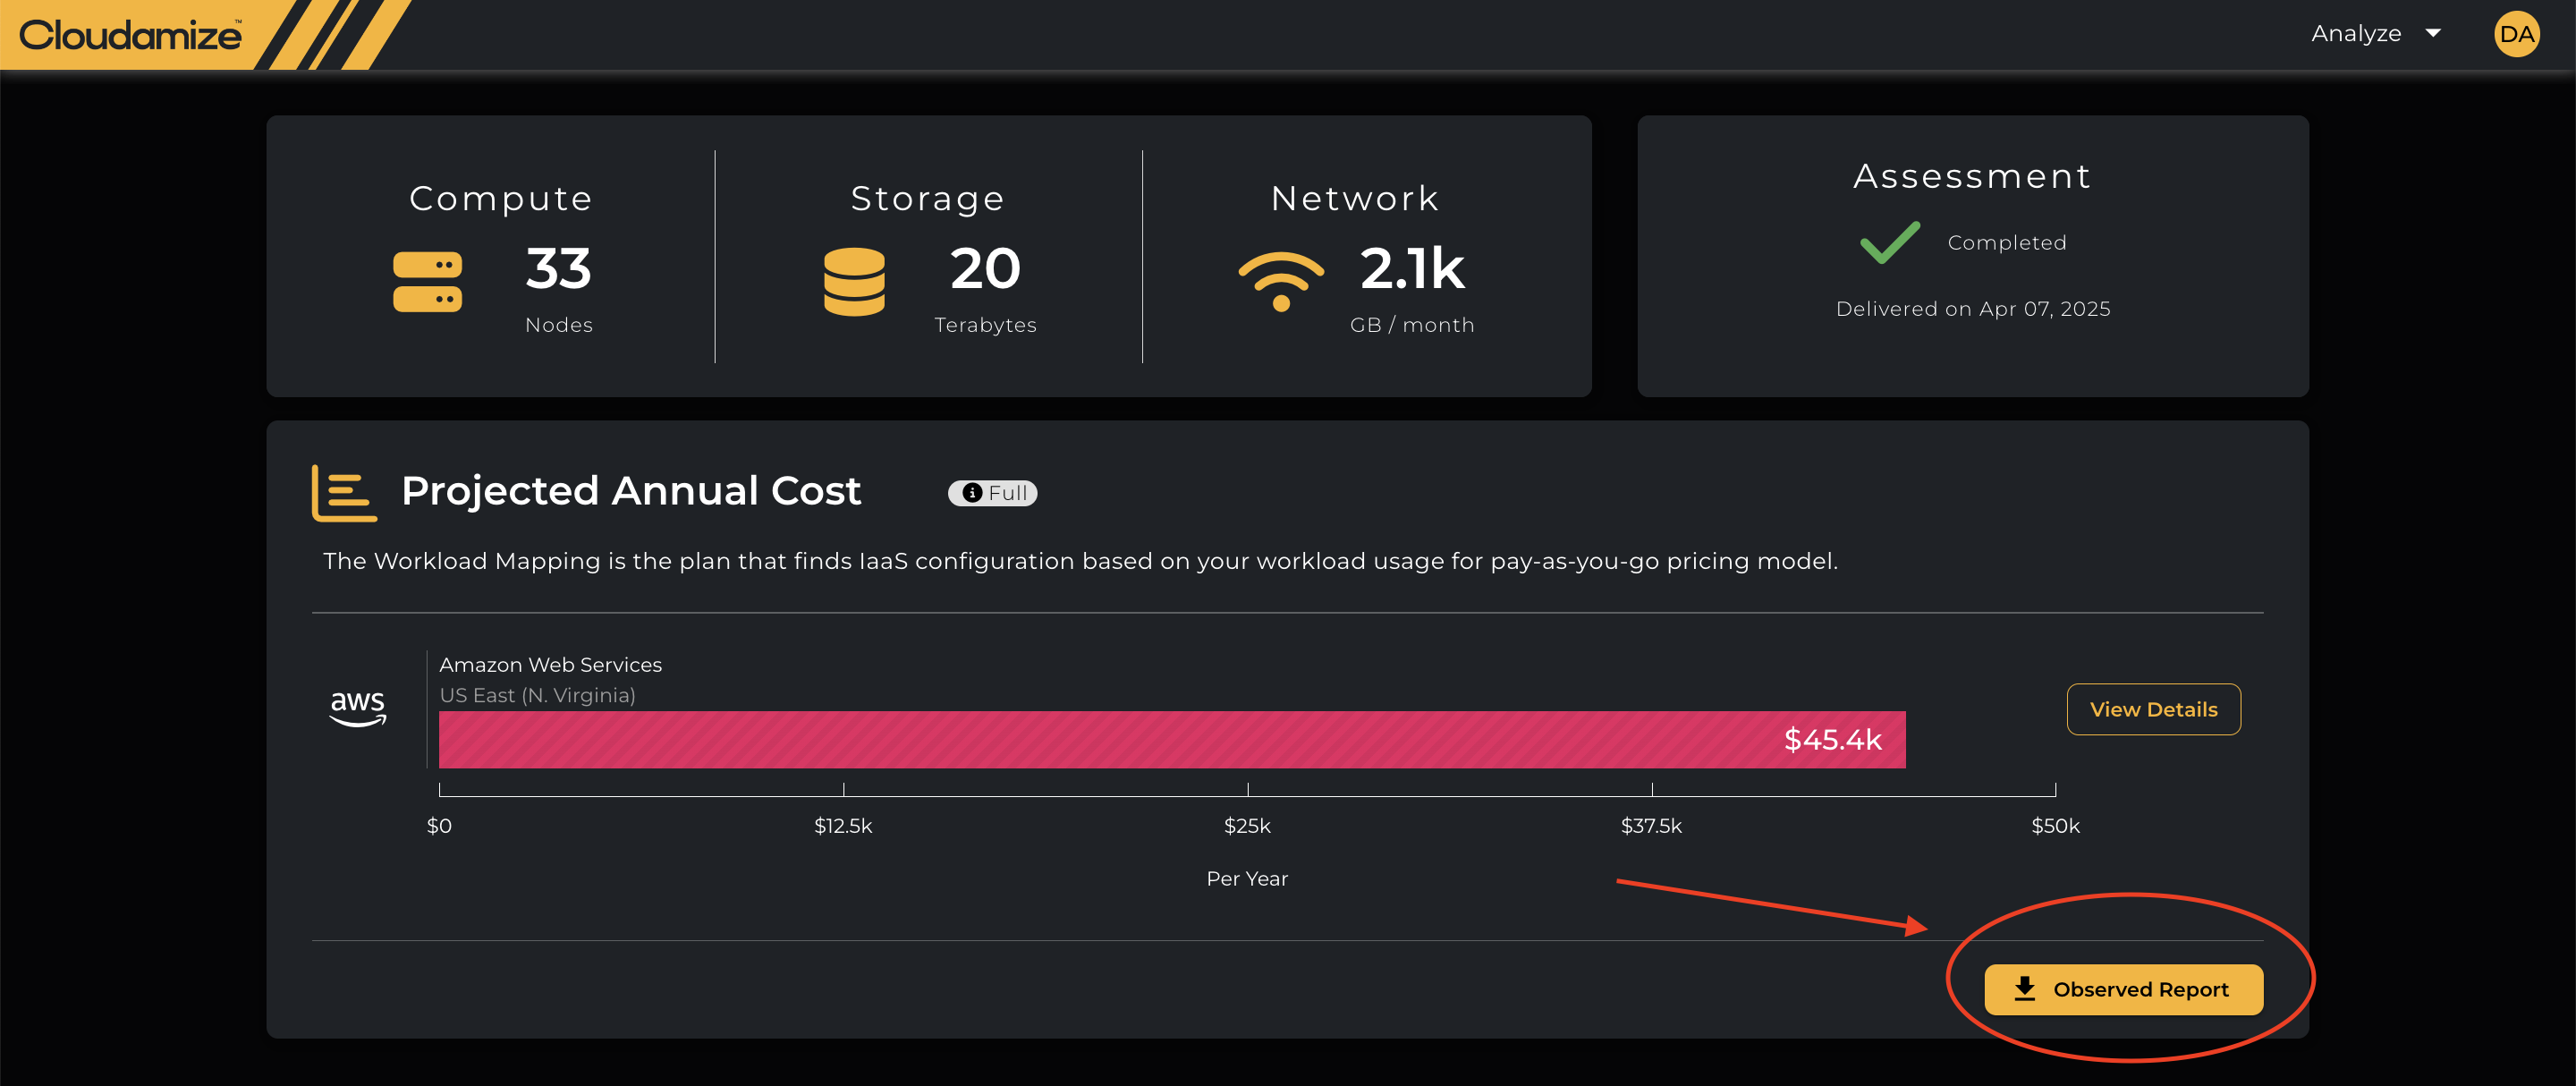
The report contains details of all infrastructure that the Cloudamize Agent and Agentless DCs have observed for this assessment. The report is organised to match the layout of the Analyse results screens, with similar data present. This will allow a rapid and detailed overview of all infrastructure that should be included in the processed results for the assessment.
Sample Report
Column Descriptions of the Headers for Observed Infrastructure Report
|
Compute Table |
|
|
Hierarchy |
|
|
Group Name |
Name of the group |
|
Asset |
User-defined name of asset group. |
|
Server Name |
It indicates the Name of the server |
|
IP address |
It indicates the IP address of the server |
|
Instance Type |
|
|
OS |
Installed operating system. |
|
OS Version |
Version of the operating system. |
|
MS SQL Edition |
It provides the Edition of MS SQL Server |
|
SQL Version |
It provides the SQL version on the MS SQL instance |
|
On Time |
|
|
On Time (%) |
Amount of time the machine was powered on during the assessment. |
|
CPU Threads |
|
|
Current (Observed Vcpu) |
The number of cores/threads on the current machine. |
|
CPU Utilization |
|
|
Current CPU Utilization(%) |
An observed significant CPU utilization peak in the current environment. By default, this is calculated using the daily peak in the 95th percentile. |
|
Observed Memory |
|
|
Observed Memory Provisioned (GB) |
Amount of allocated memory present in the current machine. |
|
Peak Memory Used (GB) |
Largest memory usage peak observed during the assessment. |
|
ID (server name + uid) |
It provides the ID (Server Name and its UID) |
|
Storage Table |
|
|
Hierarchy |
|
|
Group Name |
Name of the group |
|
Asset |
User-defined name of asset group. |
|
Information |
|
|
Server Name |
It indicates the Name of the server/Instance |
|
Disk |
Name of disk. |
|
Observed Storage |
|
|
Observed Disk Capacity (GB) |
This is the allocated capacity of the observed disk. |
|
Observed Disk Occupancy (GB) |
This is the occupied capacity of the observed disk. |
|
Performance |
|
|
Observed Throughput (MBps) |
This gives the information on Observed throughput |
|
Peak IOPS |
It gives the information on Observed Peak IOPS |
|
Network Table |
|
|
Hierarchy |
|
|
Asset |
User-defined name of asset group. |
|
Group Name |
Name of the group |
|
Instance Type |
|
|
Server Name |
It indicates the Name of the server/Instance |
|
IP address |
It indicates the IP address of the server |
|
Network Utilization |
|
|
GB/Month to the internet/leaving server |
This is the estimated egress network traffic from the machine to anywhere. We don’t determine the traffic destination (anywhere). “Estimated” means given a time-series of network throughput (data rate), we determine egress network traffic. |
|
GB/Month from other servers/Devices |
This is the estimated ingress network traffic from anywhere to the machine. We don’t determine the traffic source (anywhere). |
|
Predicted Peak(%) |
It gives the information on the predicted peak % details |
|
ID (server name + uid) |
It provides the ID (Server Name and its UID) |
If you have any queries, please get in touch with the helpdesk via our Helpdesk Portal or by email at helpdesk@cloudamize.com.