

The SQL Server report is a downloadable Excel report available in the Assessment Reports section. This report provides detailed information on all discovered SQL servers, migrating and optimizing SQL Server instances to the cloud. It provides detailed inventory, performance, and licensing analysis (including BYOL options) for efficient right-sizing and cost optimization, streamlining your SQL Server cloud journey.
A Cloudamize SQL Server Report is an analytical output generated by the Cloudamize platform designed to help organizations plan and execute the migration of their on-premises Microsoft SQL Server databases to the multiple cloud platforms (e.g., AWS, Azure, GCP).
These reports leverage detailed data collected from your SQL Server instances and their underlying infrastructure. This data includes performance metrics (CPU, RAM, IOPS), database configurations, editions, versions, and even specific SQL Server features in use.
Essentially, it provides data-driven recommendations to ensure your SQL Server cloud migration is cost-effective, performs optimally, and proceeds efficiently.
Steps to Navigate to the SQL Server Report:
-
Log in to the console https://console.cloudamize.com/#/
-
Navigate to the Analyze page of your completed assessment.
-
Click the View Details button beside your AWS results.
-
Click the Reports tab on the right-hand side of the screen to see the following:
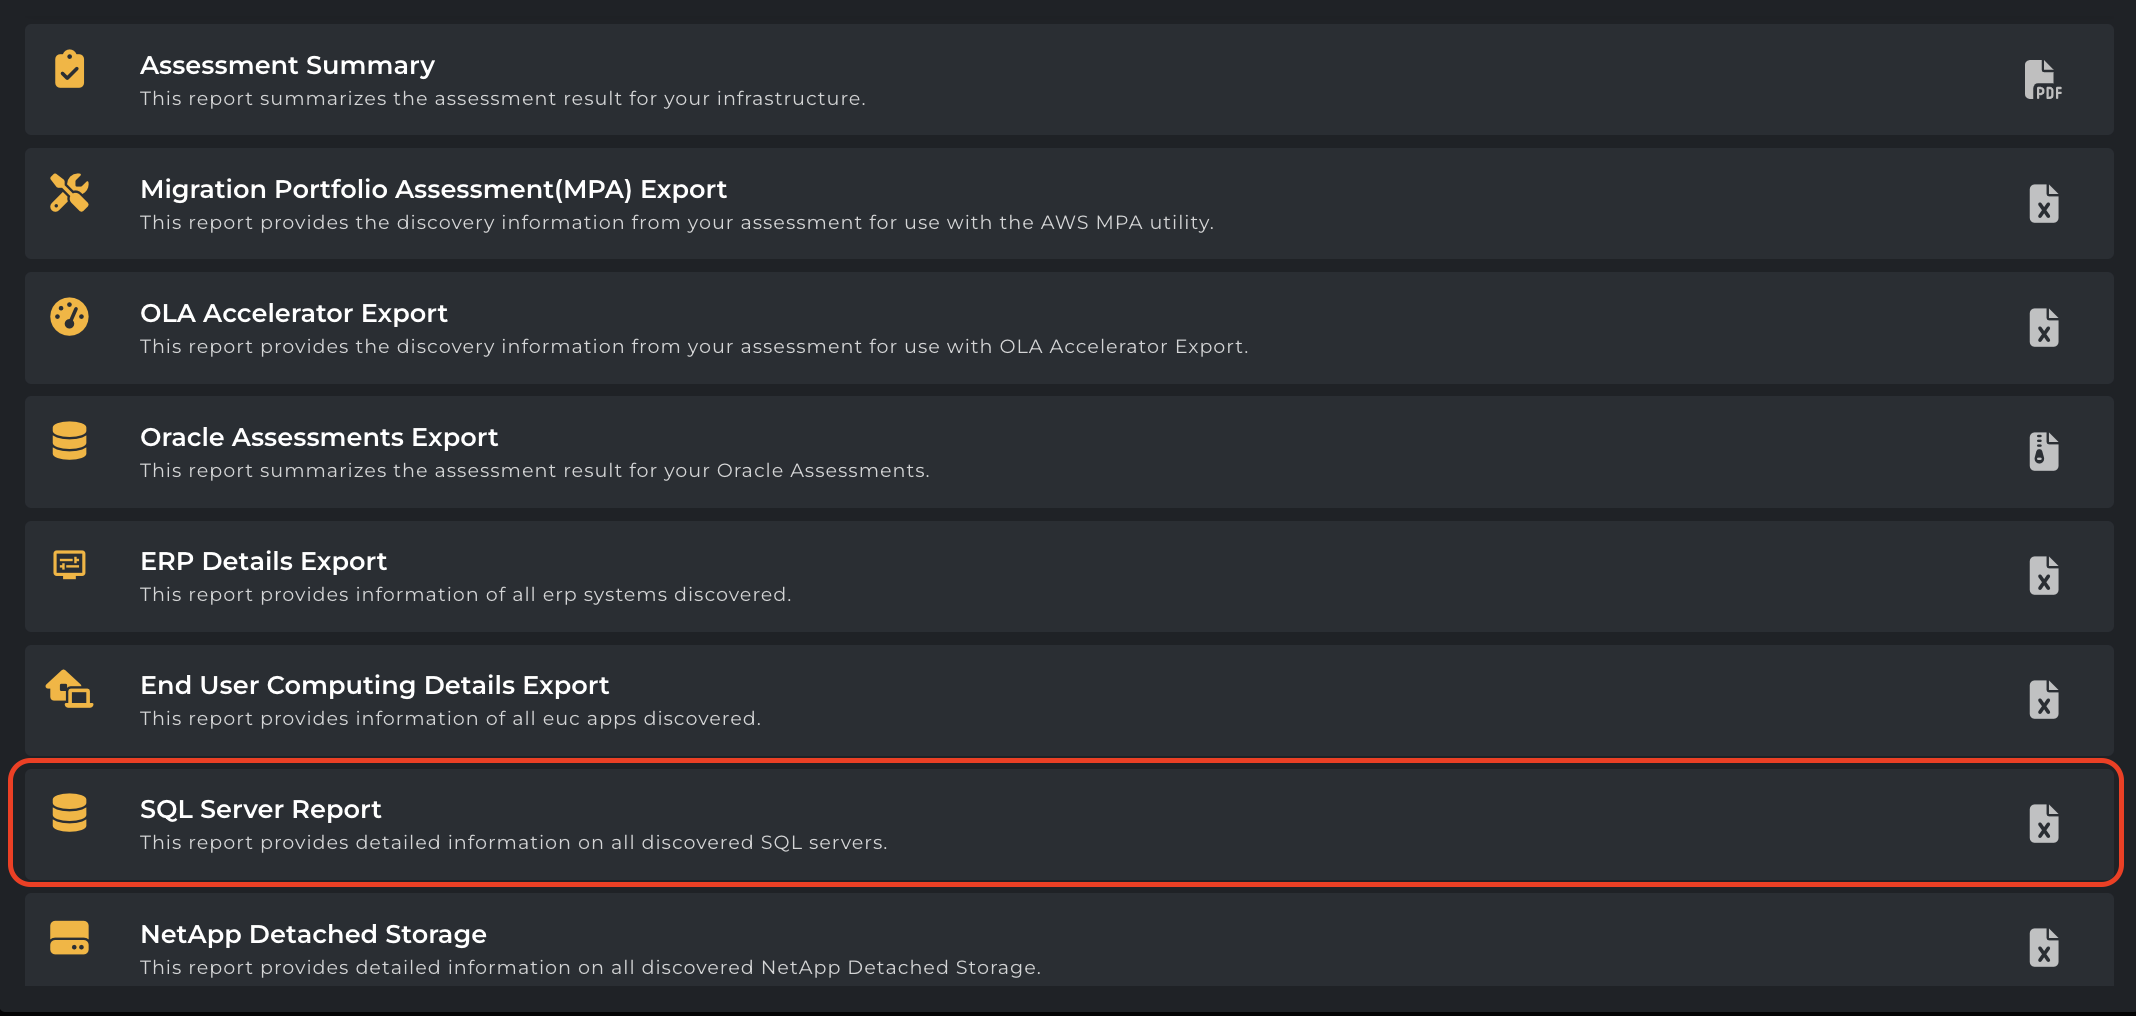
Analyze > AWS View Details > Reports | Showing the SQL Server Report
|
Column Name |
Description |
|---|---|
|
Host Name |
The name of the server or machine hosting the SQL Server instance. |
|
Database Instance Name |
The name of the SQL Server instance installed on the host. |
|
Database Name |
Name of the database within the SQL Server instance. |
|
Azure Sql DBMI Suitability |
Assessment result for suitability to migrate the database to Azure SQL Managed Instance (DBMI), typically via DMA (Data Migration Assistant). |
|
Database Size Mb |
Size of the database in megabytes. |
|
Edition |
Edition of SQL Server (e.g., Standard, Enterprise, Web). |
|
Version |
Full version number of the SQL Server engine. |
|
Patch Level |
Applied patch level or build update number. |
|
Service Pack |
SQL Server service pack level. |
|
Data Path |
File system path where data files (MDF/NDF) are stored. |
|
Error Log File |
Path to the SQL Server error log file. |
|
Sql Bin Root |
Root directory for SQL Server binary files. |
|
Peak Memory Used |
Maximum memory usage recorded. |
|
Ports |
TCP ports used by the SQL Server instance. |
|
CPU Utilization |
CPU usage percentage or metric over a period. |
|
Core Licenses Utilized |
Total number of SQL Server core licenses used. |
|
Enterprise Core Licenses Utilized |
Number of Enterprise edition licenses consumed. |
|
Standard Core Licenses Utilized |
Number of Standard edition licenses consumed. |
|
Web Core Licenses Utilized |
Number of Web edition licenses consumed. |
|
In-Cloud Enterprise Core Licenses Required |
Estimated Enterprise licenses required for cloud migration. |
|
In-Cloud Standard Core Licenses Required |
Estimated Standard licenses required for cloud migration. |
|
In-Cloud Web Core Licenses Required |
Estimated Web licenses required for cloud migration. |
|
Core Licenses Text Data |
Text-based summary or notes about core license usage. |
|
Cluster Name |
Name of the cluster if SQL Server is deployed in a clustered environment. |
|
Is Cluster Active |
Indicates whether the cluster is active (e.g., Yes/No). |
|
Cluster State |
Current state of the cluster (e.g., Running, Offline). |
|
Feature List |
List of features enabled or installed in the SQL instance. |
|
ID (server name + uid) |
Unique identifier composed of server name and a unique user or system ID. |
|
Product Info |
Product metadata—could include SKU, license terms, or installation type. |
|
Average Read IOPS |
Average number of read I/O operations per second. |
|
Average Write IOPS |
Average number of write I/O operations per second. |
|
Average Total IOPS |
Combined read/write IOPS average. |
|
Average Read Throughput MiB/s |
Average read throughput in MiB per second. |
|
Average Write Throughput MiB/s |
Average write throughput in MiB per second. |
|
Average Total Throughput MiB/s |
Average combined throughput in MiB per second. |
|
Peak Read IOPS |
Highest recorded read IOPS. |
|
Peak Write IOPS |
Highest recorded write IOPS. |
|
Peak Total IOPS |
Highest combined read/write IOPS. |
|
Peak Read Throughput MiB/s |
Maximum read throughput in MiB/s. |
|
Peak Write Throughput MiB/s |
Maximum write throughput in MiB/s. |
|
Peak Total Throughput MiB/s |
Maximum total throughput in MiB/s. |
|
Read Percentage |
Proportion of read operations as a percentage of total I/O. |
|
Enterprise Features |
List or indication of enterprise-only features used by the database/server. |
Example Report: SQLServerandLicenseUsage-SQLServer.xlsx
If you have any queries, please get in touch with the helpdesk via our Helpdesk Portal or by email at helpdesk@cloudamize.com.