

Cloudamize can collect two types of Microsoft (MS) SQL Server data: Basic data and Advanced data.
Basic data is collected from the Windows registry by the Cloudamize Agent and Agentless data collectors.
Advanced data is collected from MS SQL Server and can be used for detailed SQL Server performance analysis and licensing optimization.
The SQL Server Telemetry data collector is a command-line interface (CLI) utility used to collect advanced data. It can collect data from multiple SQL Servers and is especially useful when Cloudamize agents cannot collect this data. Collected data is saved to a file that can be uploaded to the Cloudamize console.
The SQL Server Telemetry data collector is available for the following platforms:
For other operating systems and build targets, please contact helpdesk@cloudamize.com.
Use Cases
Please note that the SQL Server Telemetry Tool is not to be used alone. A primary data collection source (Agent, Agentless DC) should be used to collect usage data for a server. The SQL Server Telemetry tool is used to add supplemental advanced SQL data to existing Cloudamize collection methods.
MS SQL Server Advanced data can be collected in a variety of ways data based on the customer’s environment and SQL Server configuration.
-
The Cloudamize Windows Agent and the Cloudamize Agentless data collector will automatically collect advanced SQL Server data from the SQL Server if the SYSTEM account has access to the SQL Server instances.
-
Requires PowerShell 5.1 or higher
-
Data is automatically sent to Cloudamize with no additional user action
-
-
The Cloudamize Agentless data collector can also collect advanced SQL Server data from SQL Server if the User account specified in the Agentless UI has access to SQL Server instances.
-
Requires PowerShell 5.1 or higher
-
Data is automatically sent to Cloudamize with no additional user action
-
-
The Cloudamize SQL Telemetry tool can collect advanced SQL Server data from SQL Servers if the Cloudamize Windows Agent and the Cloudamize Agentless data collector cannot collect this data because the specified account does not have access to SQL Server or PowerShell 5.1 or higher is not installed.
-
Does not require PowerShell
-
The user can provide different credentials for each instance of SQL Server on each machine.
-
Data must be uploaded to the Cloudamize console by the user.
-
More information about what is included in the Basic data and Advanced data can be found at: https://support.cloudamize.com/kb/basic-and-advanced-ms-sql-collected-by-agent-based .
How to Use
-
Download the latest version of the SQL Telemetry data collector using the link for your operating system above and save it to a directory on your system.
-
Create a
servers.csvfile with the SQL Server instances you want to collect data from (details below) -
Run
sqlserver-telemetryvia the Terminal, Command Line, or PowerShell (examples below) -
Upload the
telemetry.jsonfile that is produced to the Cloudamize console
servers.csv (Input File)
In the directory where you downloaded the application, create a new file called servers.csv with the required details for all of the SQL Server instances from which you would like to collect data. This file can be created with Notepad, Excel, or any text editor. Each SQL instance should have its own line, and there is no limit to the number of SQL Servers.
The recommended CSV format for each instance is:
ipOrDNS,portOrInstanceName,username,password,database
|
Field |
Description |
Example Values |
|---|---|---|
|
ipOrDNS |
Host address (IP or DNS name) for SQL Server |
|
|
portOrInstanceName |
Port number or instance name (depends on validity) |
|
|
username |
SQL Server username for authentication |
|
|
password |
Password for the SQL Server username |
|
|
database |
Name of the database to connect to |
|
The tool will use this information to build connection strings to retrieve the necessary data.
Run sqlserver-telemetry
Windows
In your Windows command prompt of preference (Command Prompt or Powershell), change the directory to where you downloaded the file and saved the servers.csv file.
Run the following command.
sqlserver-telemetry.exe servers.csv
Linux
In your Linux terminal, change the directory to where you downloaded the file and saved the servers.csv file.
Run the following command.
./sqlserver-telemetry servers.csv
If you have issues with the command, you may need to run the following first (and only once)
chmod a+x sqlserver-telemetry
telemetry.json (Output File)
This utility will run for ten minutes and generate a JSON file called telemetry.json, which is a machine and human-readable list of all of the output for the telemetry commands run against each of the listed DSN connection strings in the servers.csv file. For each connection string, it will capture the following information as accessible from within SQL Server, AND the permissions allowed to the connection string account:
-
Host
-
SQLServerVersion
-
SQLServerEdition
-
OperatingSystem
-
AvailabilityGroups
-
Roles
-
ClusterInfo
-
Mirroring
-
LogShipping
-
Memory
-
HostCores
-
VisibleCores
-
I/O Performance
-
Enterprise-Level Features Used
-
Errors
In order to make this more resilient, any errors identified during the execution of this utility will be silently captured and stored in the Errors field. This allows for maximal telemetry gathering without having to repeatedly trial and error within a customer's site. It is important to note that the output will NOT have any sensitive credential information and can, therefore, be exported with minimal to no risk associated.
Upload SQL Telemetry Report
-
Follow these steps in the Cloudamize Console to upload the SQL Telemetry output file:
-
When the above process completes, there will be a telemetry.json file in the Downloads folder
-
Log into the Cloudamize Console
-
Select the “Discover” option
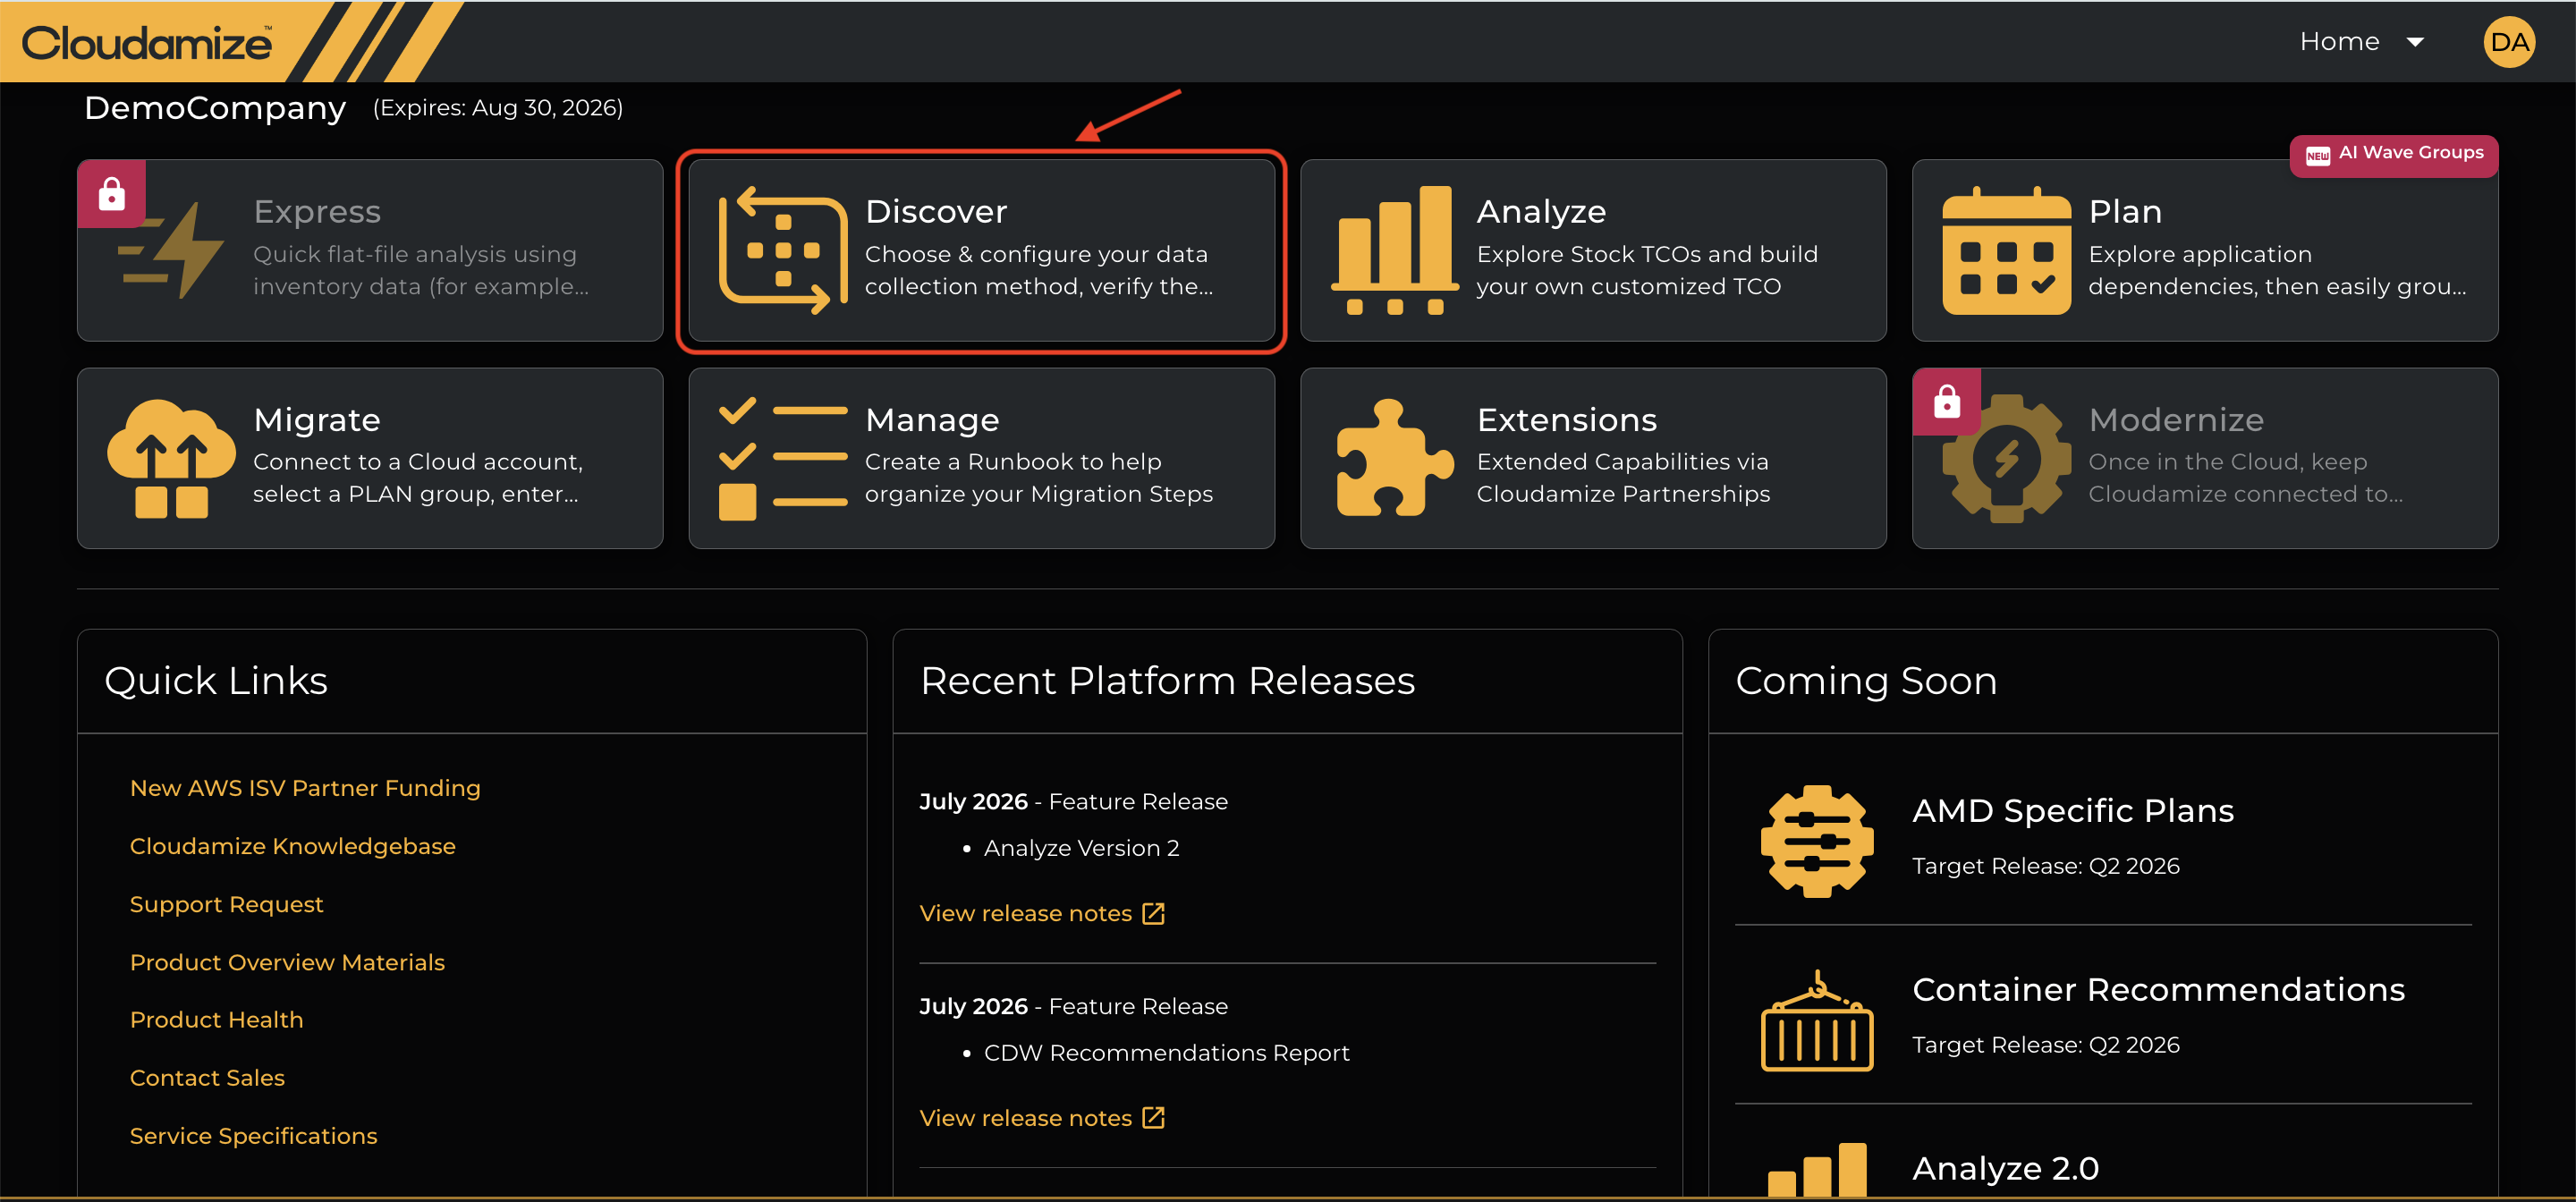
-
On the Discover Page, select the External Data option. You will see a tab called SQL Telemetry.
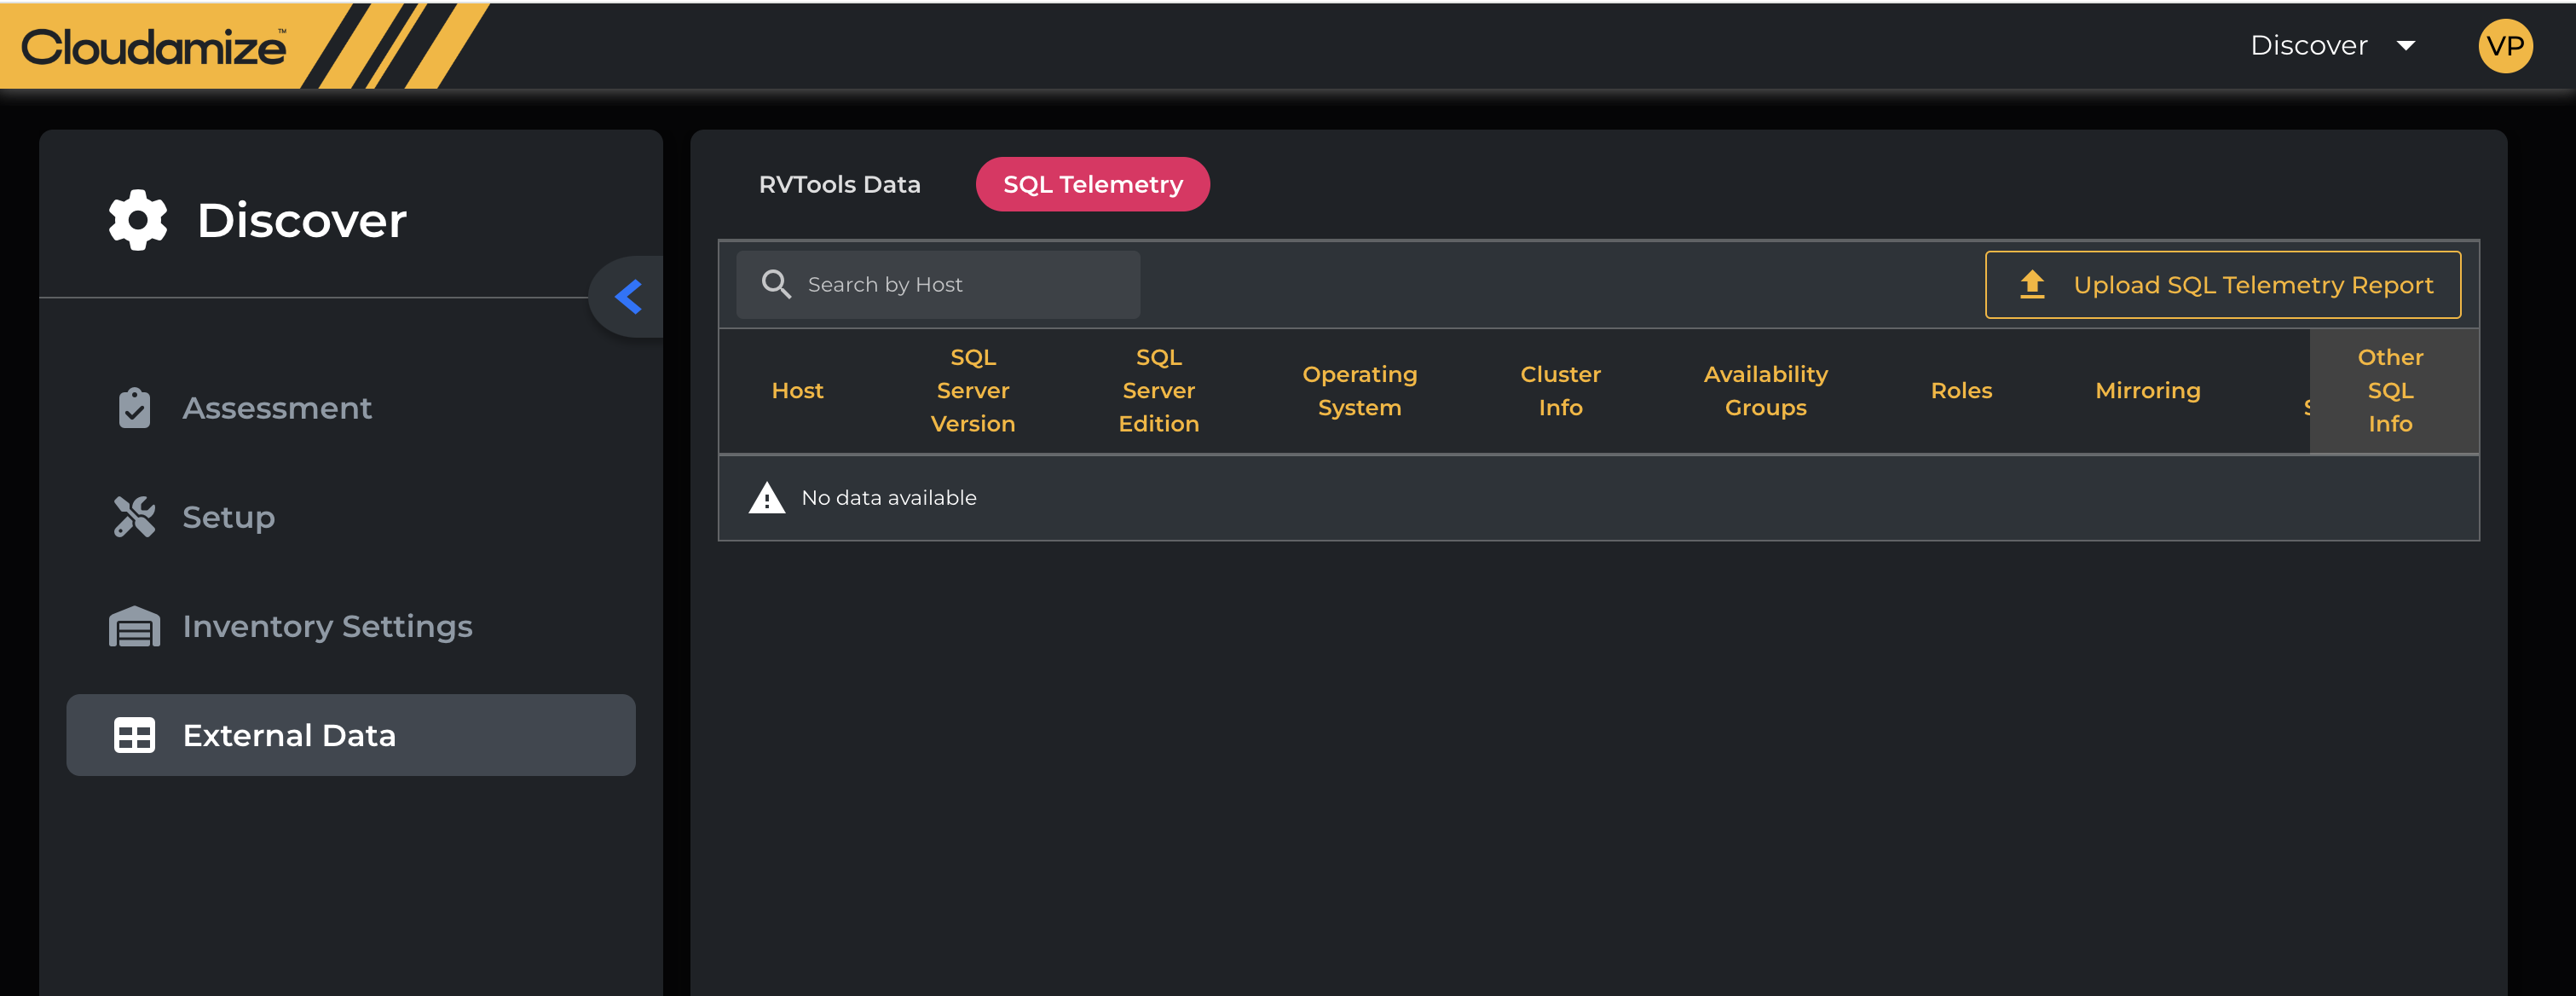
-
Select SQL Telemetry and then click on the Upload SQL Telemetry Report option to upload the
telemetry.jsonfile.
-
-
We will fill in the following data collected from the above process where the data was not collected by the agent or agentless data collector.
-
On-Prem Server Name (REQ'D)
-
On-Prem SQL Server Edition(REQ'D)
-
On-Prem SQL Server Version(RCM'D)
-
On-Prem Operating System(REQ'D)
-
SQL Cluster Name
-
Passive Instance Using Log Ship, DB Mirroring(Non-Cluster)
-
SQL Availability Group
-
SQL Availability Group Role
-
SQL Max Server Mem in MB
-
SQL DB Mirroring Present
-
SQL I/O Performance
-
SQL Enterprise-Level Features Used
-
Note: When the agent is collecting the telemetry data, It will be stored inside a Cloudamize folder and will be in an encrypted format, which users cannot see.
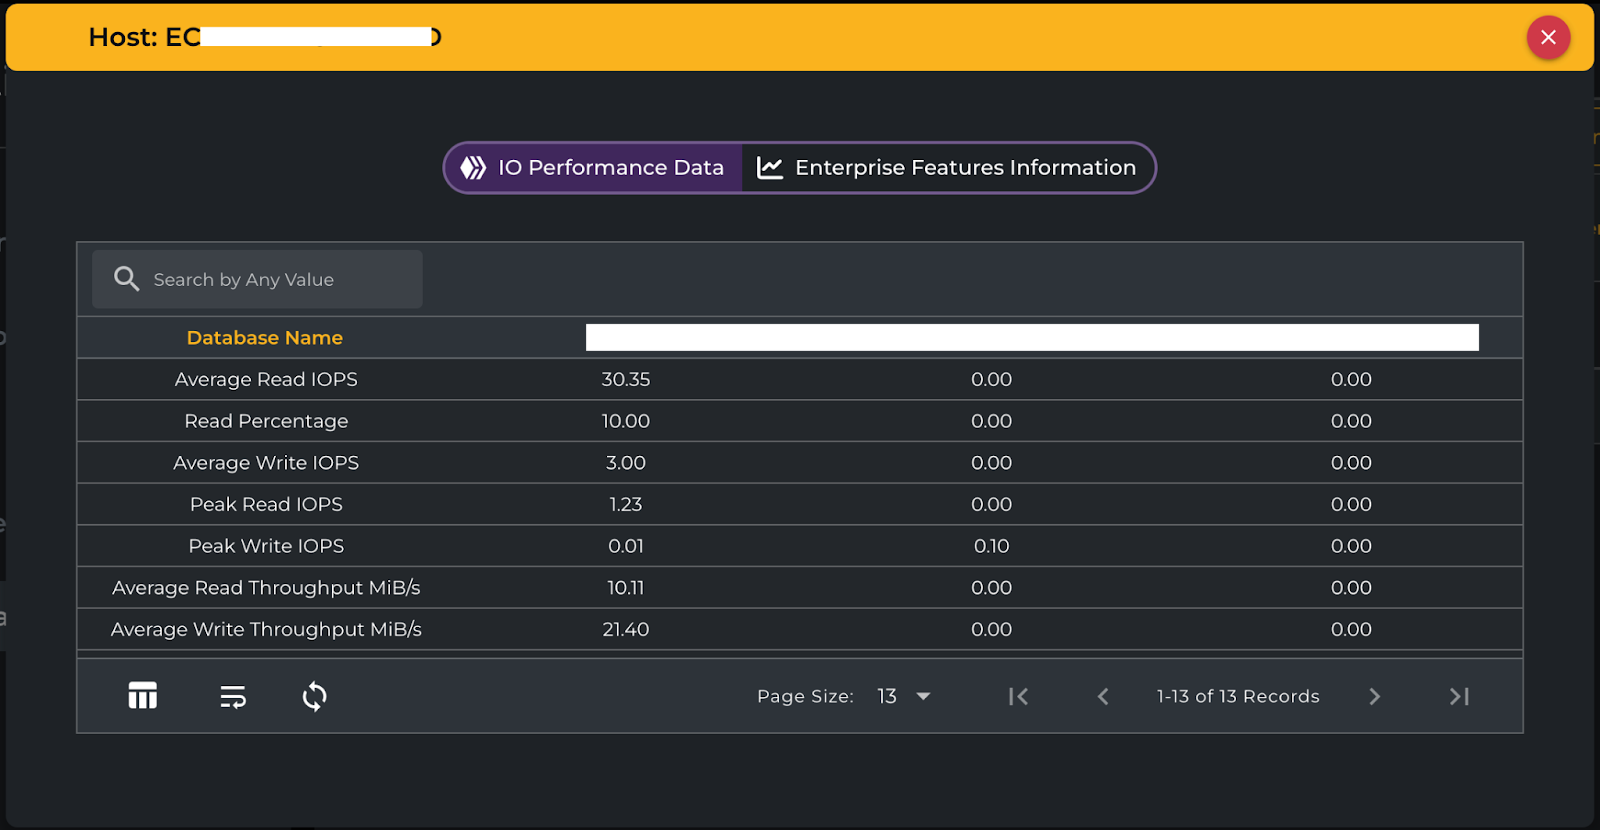
I/O Performance data can be viewed by clicking the button in the “Other SQL Info” column:
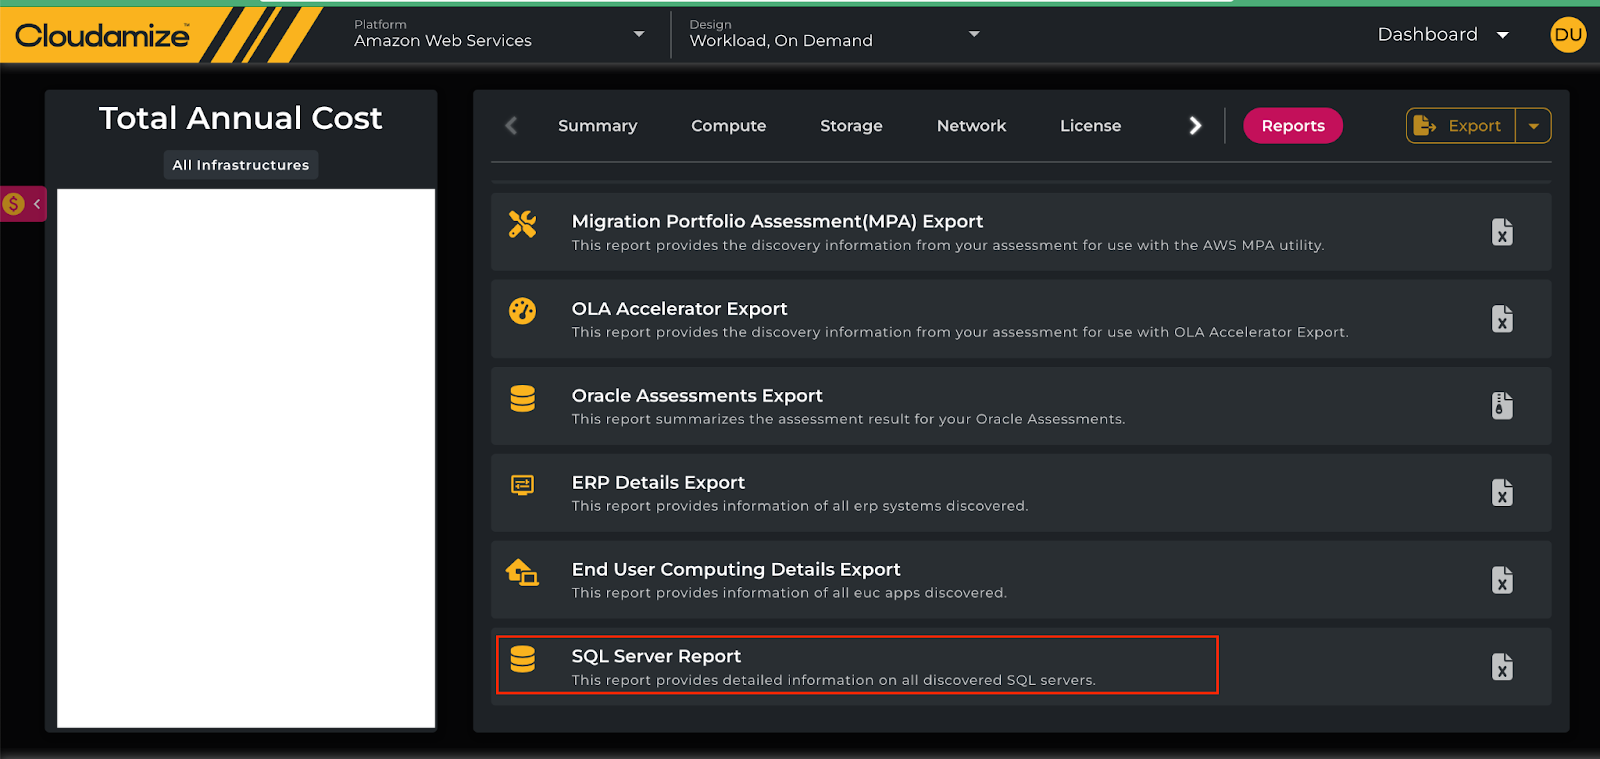
Reporting
The full report can be accessed from the reports section of the new console:
The data is also available on the Application Canvas, in the SQL Server and License Usage report (accessed via the Plan Section):
.png?cb=eb3aaf37600be907153561ae87572824)
If you have any queries, please get in touch with the helpdesk via our Helpdesk Portal or by email at helpdesk@cloudamize.com.