

Instances
This article provides guidelines and reference materials for navigating and using the Inventory Settings page within your assessment.
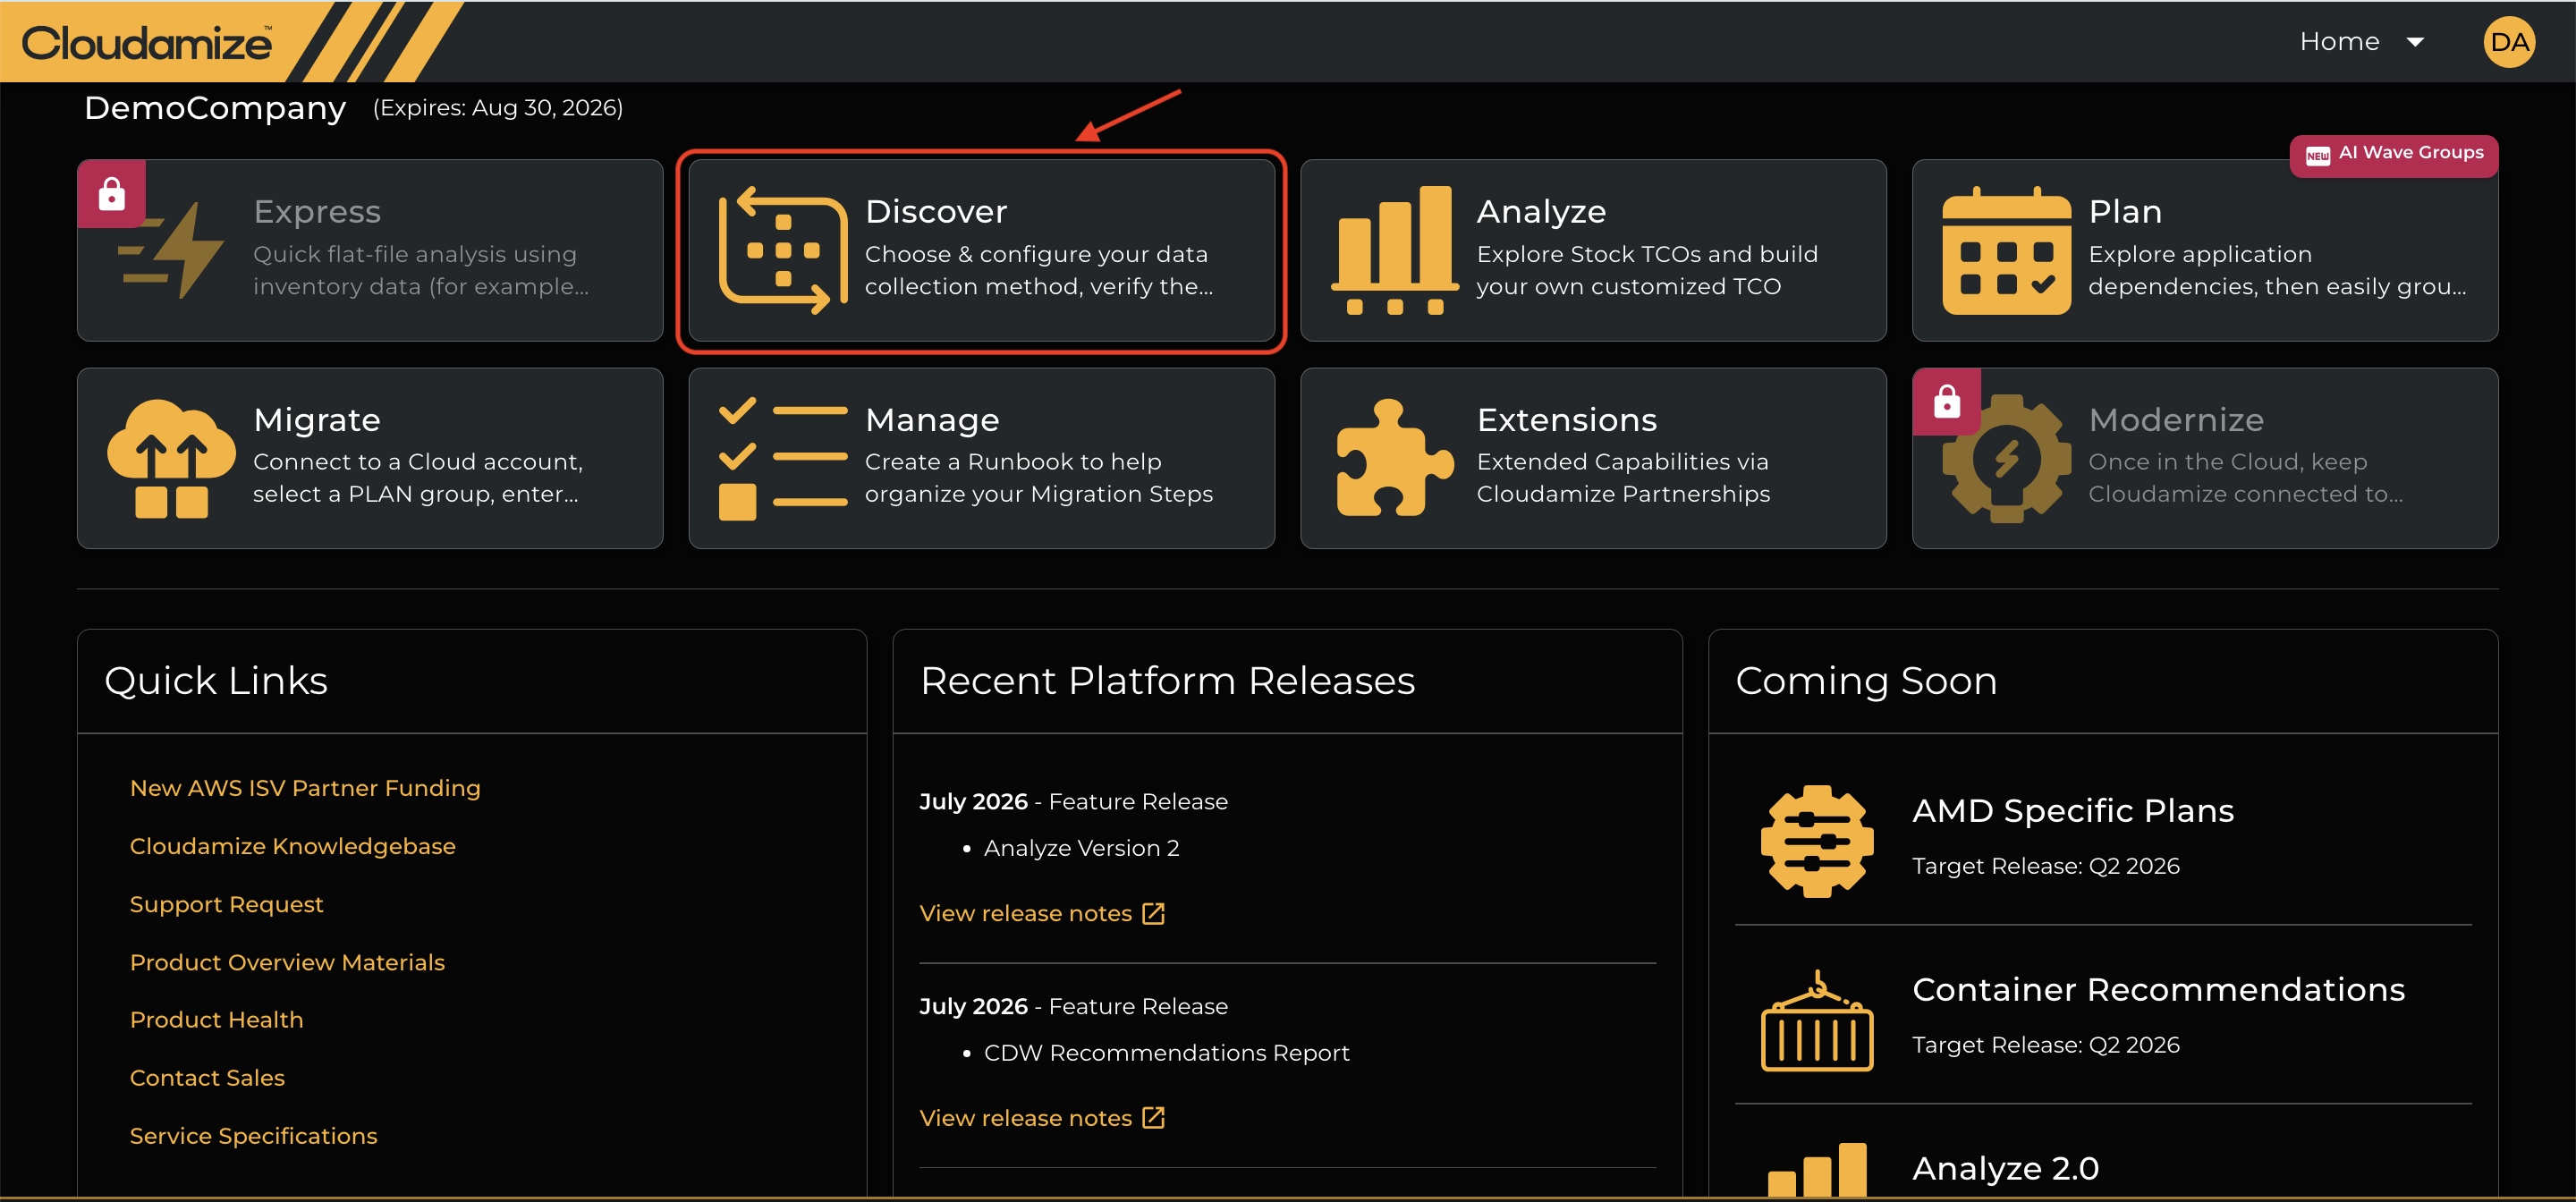
Select Discover on the Cloudamize Landing page to open the Inventory settings.
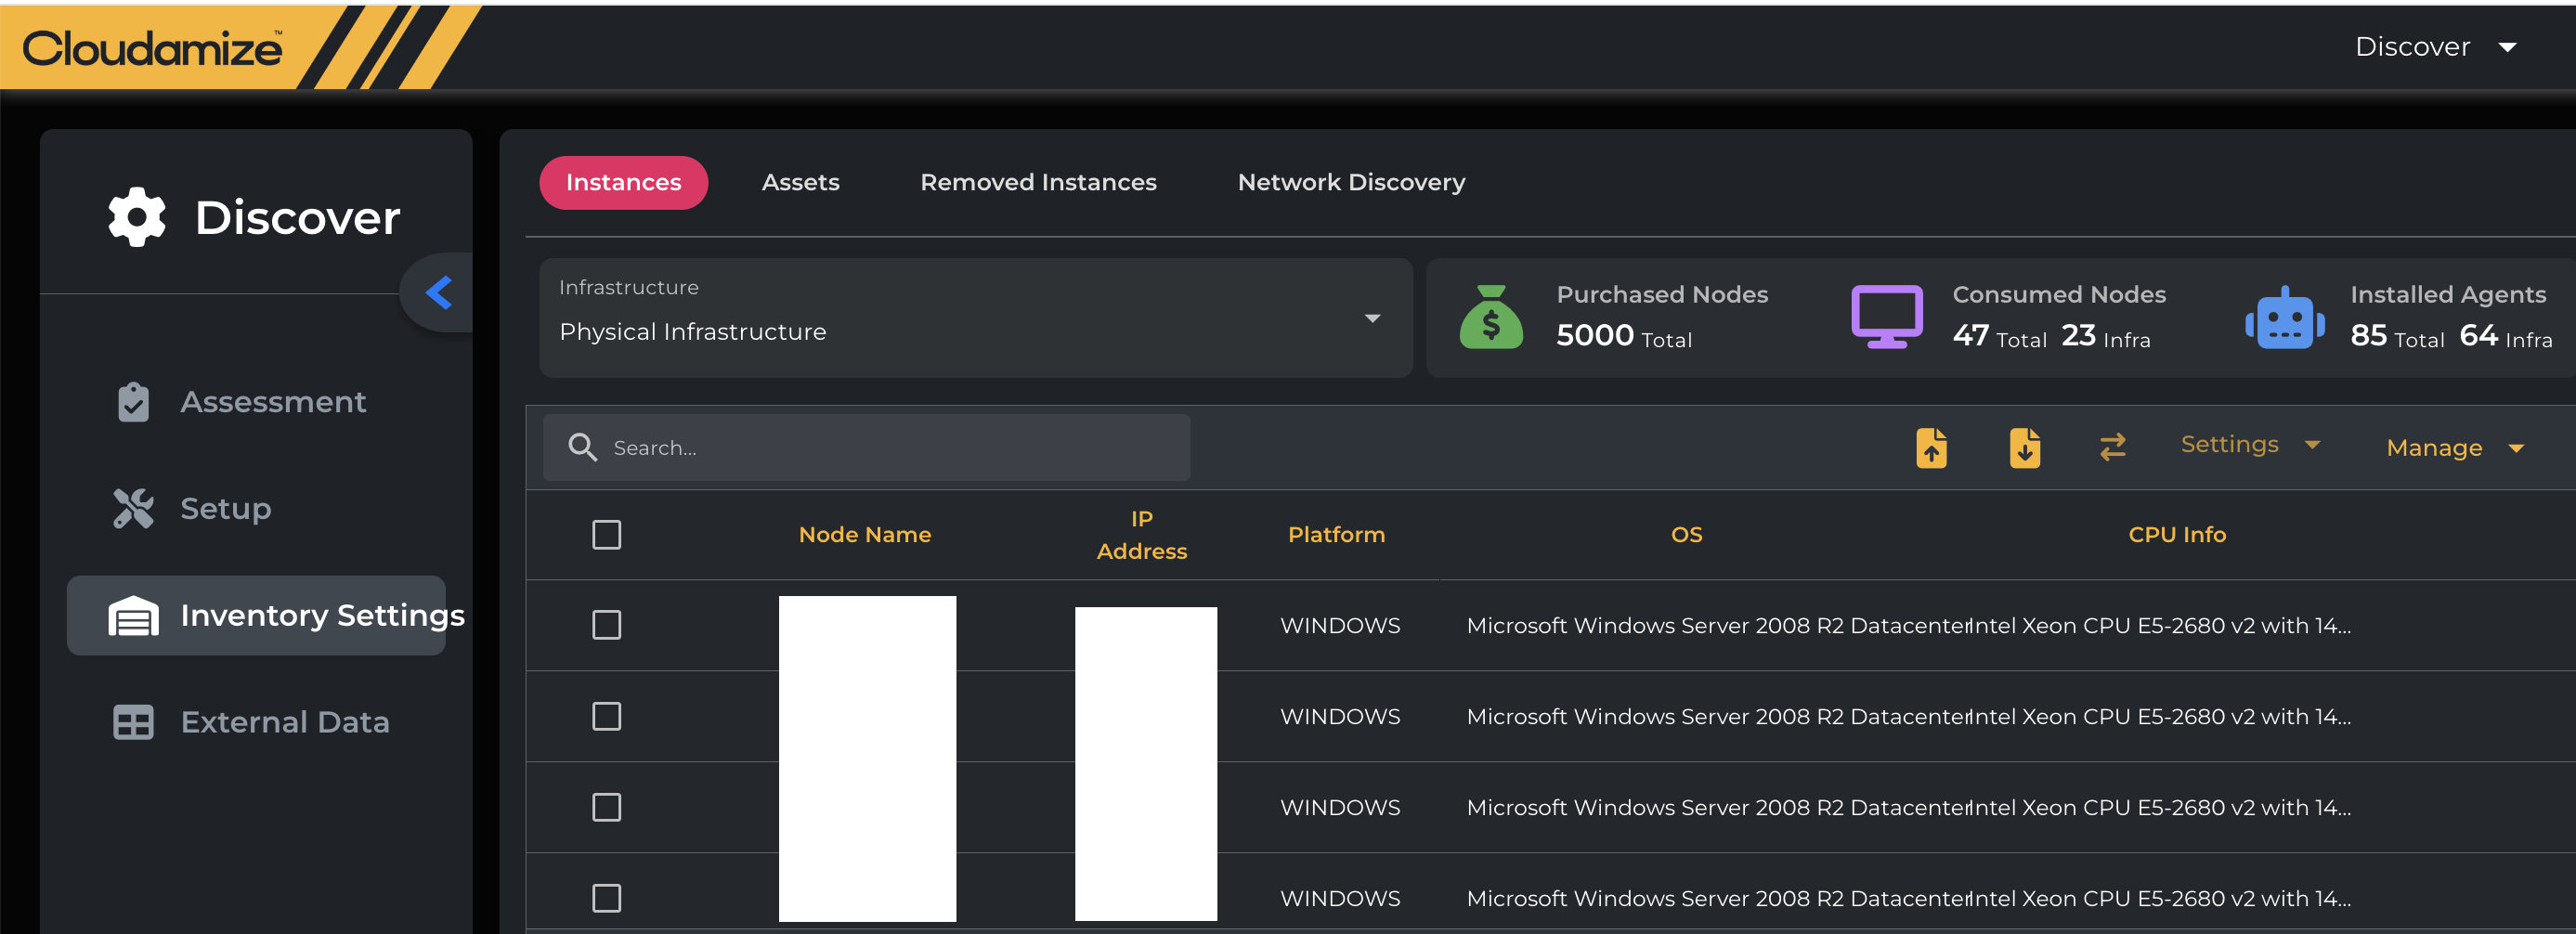
Instances
|
Column |
Description |
|---|---|
|
Node Name |
Hostname of the machine being assessed. |
|
IP Address |
Local IP addresses of the machine being monitored. |
|
Platform |
Operating system platform, such as Linux or Windows. |
|
OS |
Operating system edition and version, such as Microsoft Windows Server 2012 R2 Standard. |
|
CPU Info |
CPU model, speed, and number of threads assigned to the node. |
|
MS SQL Details |
Microsoft SQL Server details, including the version and edition, such as SQL Server 2022 16.0.1000.6 (RTM) Standard Edition. |
|
Asset |
Asset group to which the node belongs. Displays Default if the node has not been assigned to a customized asset group. |
|
Telemetry Data Source |
Displays the data source options, such as Hypervisor or Agent, when both VMware and Agent-based data collection are being used for the monitored machines. |
|
Agent Status |
Displays the current agent status, such as Collecting Data, Inactive, or Sleeping. |
|
Data Collection Mode |
Displays the source used for data collection, such as Agent or AgentlessDC. |
|
Data Collection |
Allows you to enable or disable data collection for the specific node. |
|
Collection Started |
Displays the date and time when data collection was established for the node. If collection is still in progress, a warning indicator is displayed with a tooltip indicating that some expected data has not yet been received. Hovering over the date displays the fully established collection date when applicable. |
|
Last Data Collected |
Displays the most recent date and time when data was received from the node. |
|
Days of Data |
Displays the number of days of data currently available for the node. If less than one full day of data is available, < 1 day is displayed. |
|
Assessment Scope |
Allows you to include or exclude the node from the assessment scope. |
|
Reason |
Displays the reason why a node is excluded from the assessment scope, such as User Disabled. |
|
MS SQL Data Collection Status |
Displays the status of Microsoft SQL data collected from the node. |
-
-
MS SQL Data Collection Status will have the following values and their meanings.
-
N/A: The machine does not have the MS SQL Installed
-
Collecting: MS SQL data is successfully collected.
-
Any error message: There could be an error while collecting the MS SQL data. The error may be due to the PowerShell version, .NET version, etc. The MS SQL Data Collection prerequisite is available on our KB here.
-
-
Note: Collection timestamps are displayed in Local Timestamp. The Collection Started date may differ from when the node first reported data because collection may take time to become fully established. A warning indicator may appear when collection is still incomplete.
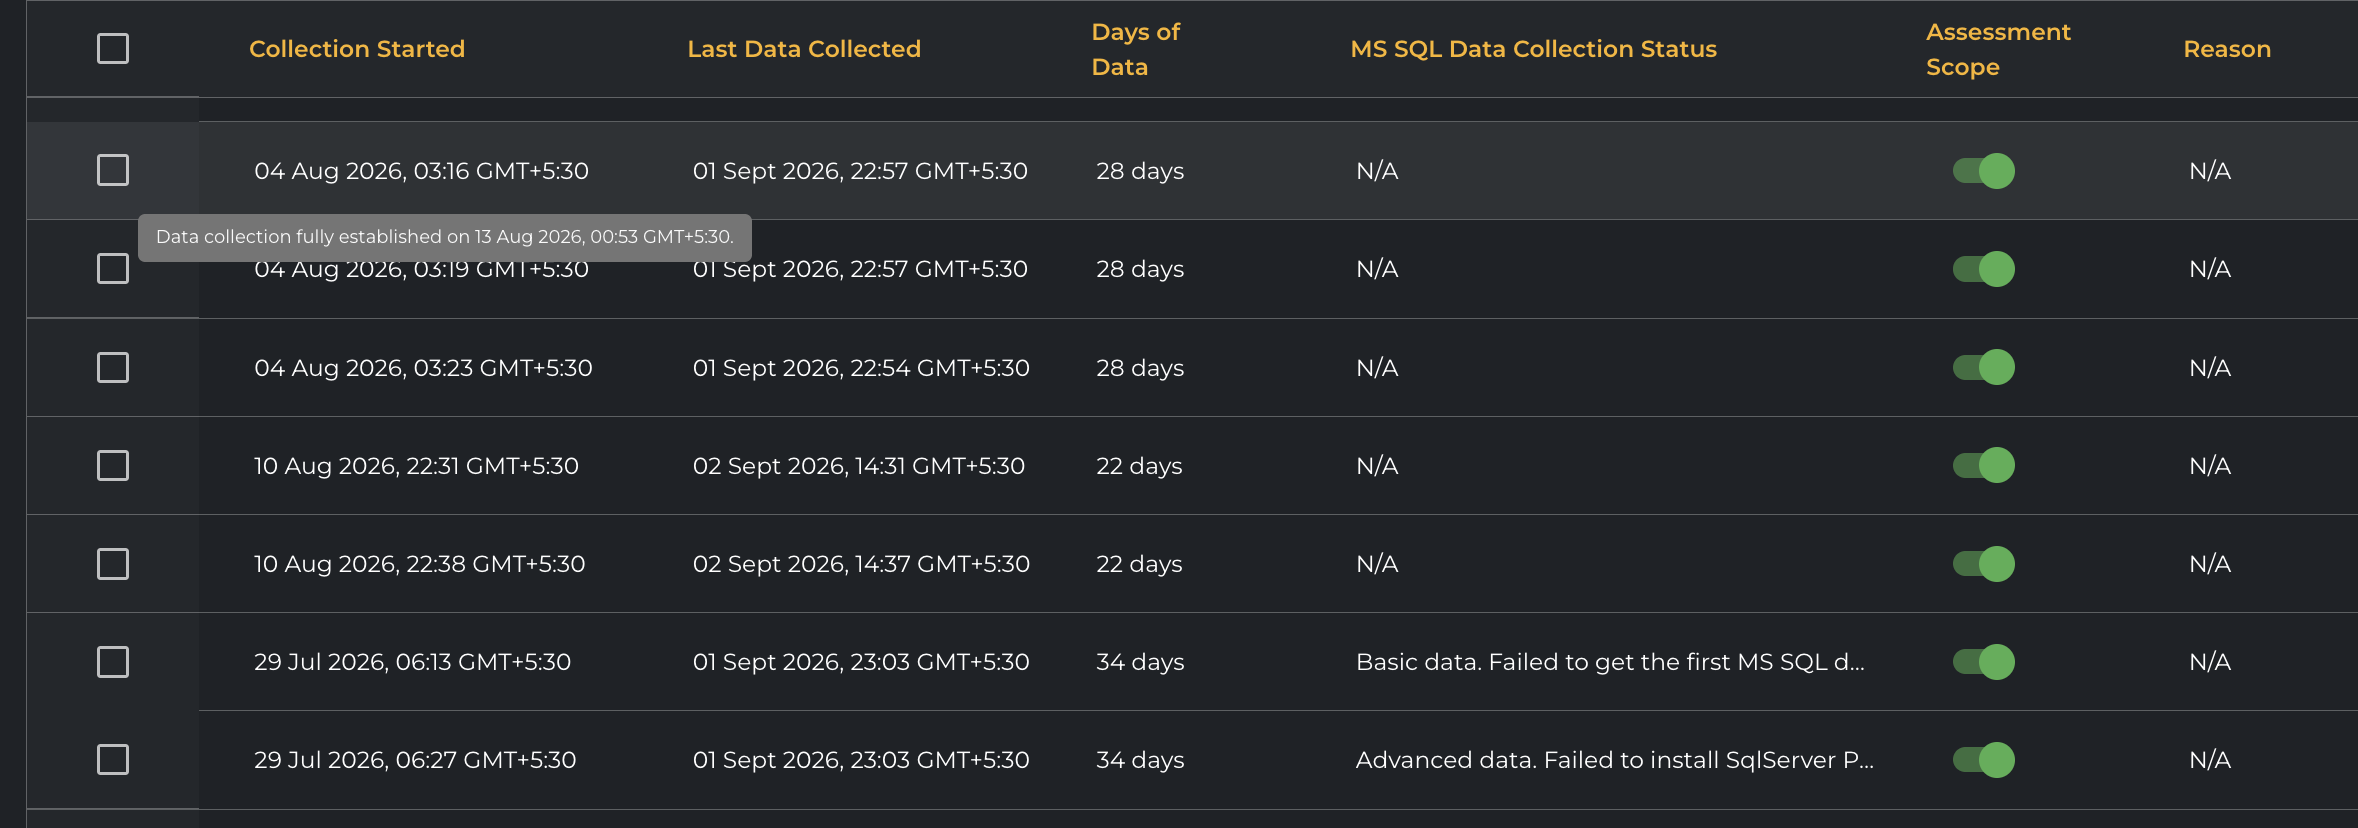
Healthy node
Hovering over the start date shows: “Data collection fully established on 03:16 GMT+5:30”
This distinction matters because the first data can arrive before every expected source has completed.
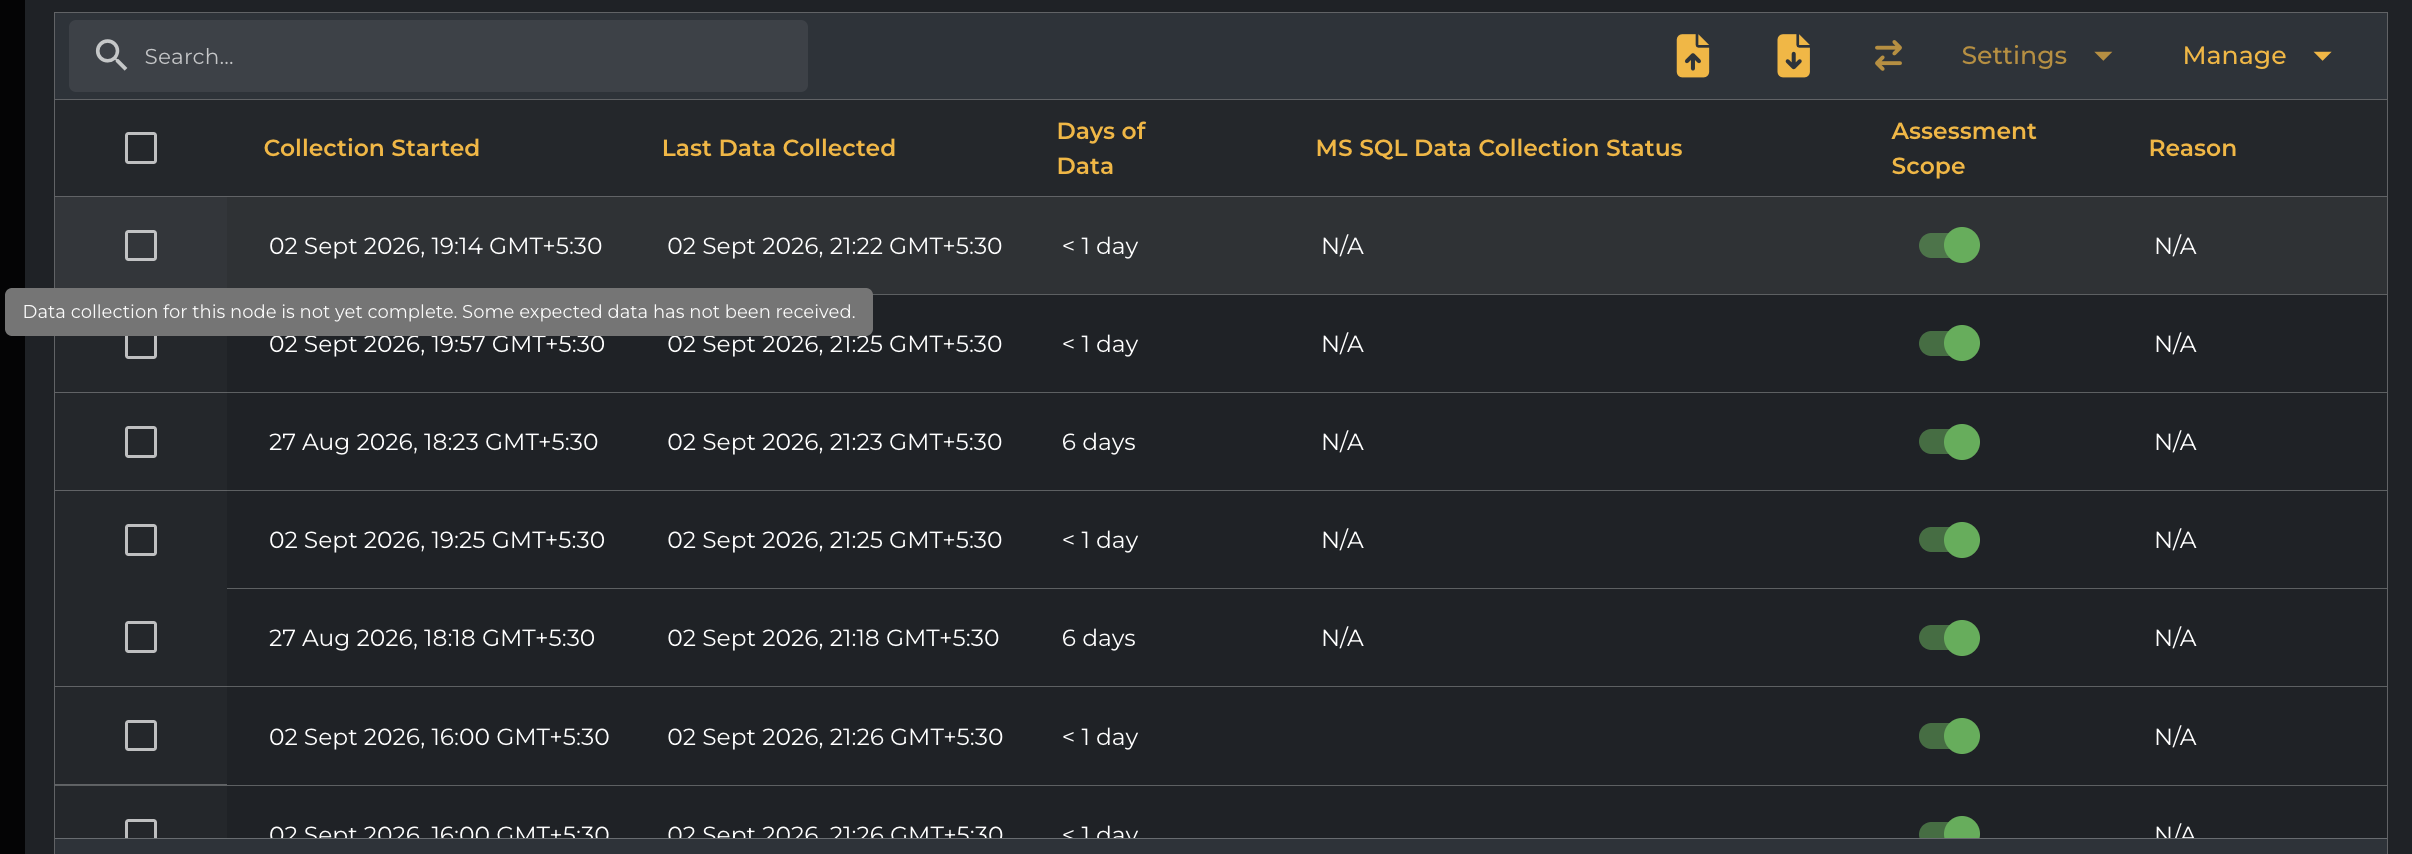
Collection incomplete
Tooltip: “Data collection for this node is not yet complete. Some expected data has not been received.”
This is generally expected, especially for Linux nodes, which typically have more one-time data sources and therefore more opportunities for delayed completeness.
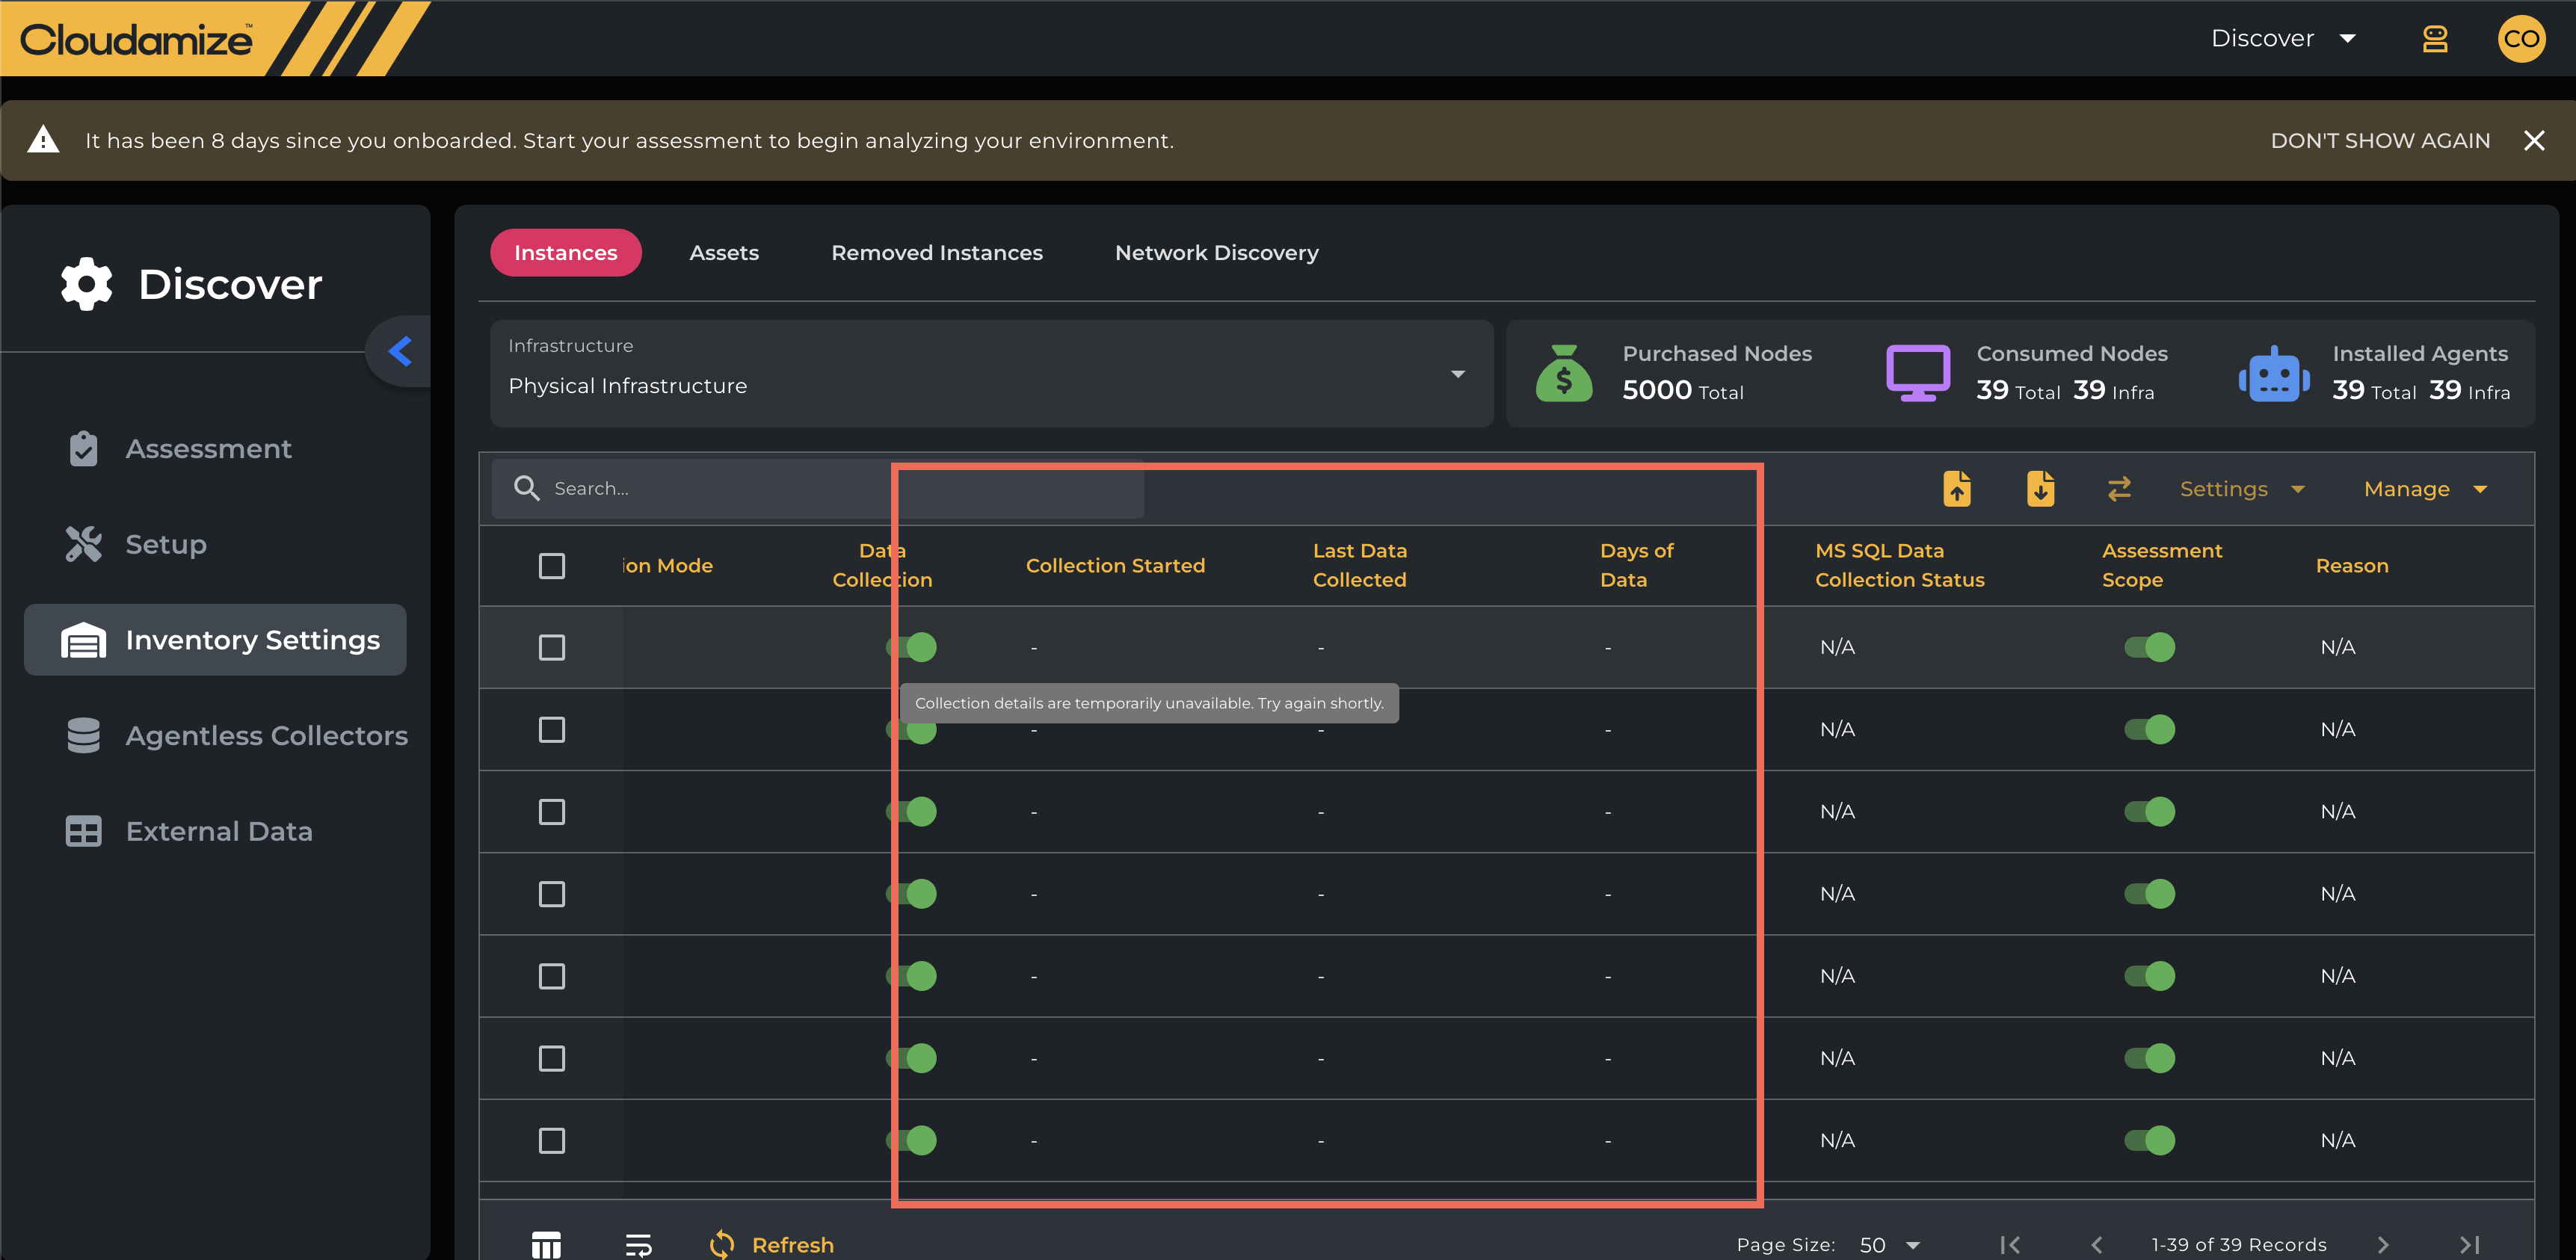
Collection details temporarily unavailable
All three columns show – with the tooltip: “Collection details are temporarily unavailable. Try again shortly.”
If collection details cannot be retrieved, the rest of the row still renders normally. Agent status, data collection mode, OS, and other existing fields remain visible.
Hyper-V and vCenter behavior
Hyper-V tab
-
The Collection Started, Last Data Collected, and Days of Data columns are also available on the Hyper-V tab.
-
Behavior matches the Physical tab exactly — timings are read from the Agent or the Agentless Data Collector, with no differences in logic.
vCenter tab
-
The same three columns are available on the vCenter tab, with two behavioral differences for VMs collected by the vCenter Data Collector (VMs with an agent installed behave exactly like Physical/Hyper-V):
-
Collection Started does not show a "fully established" date on hover, since vCenter collection has no equivalent signal. The incomplete-collection tooltip still applies where relevant.
-
Last Data Collected reflects performance data only — inventory details keep refreshing even when a VM is powered off, so this prevents a powered-off VM from appearing healthy.
-
-
Days of Data on the vCenter tab is calculated from the collector's own sampling windows. A VM powered off partway through a window is still credited for that window, so the count remains conservative but is not sample-exact.
-
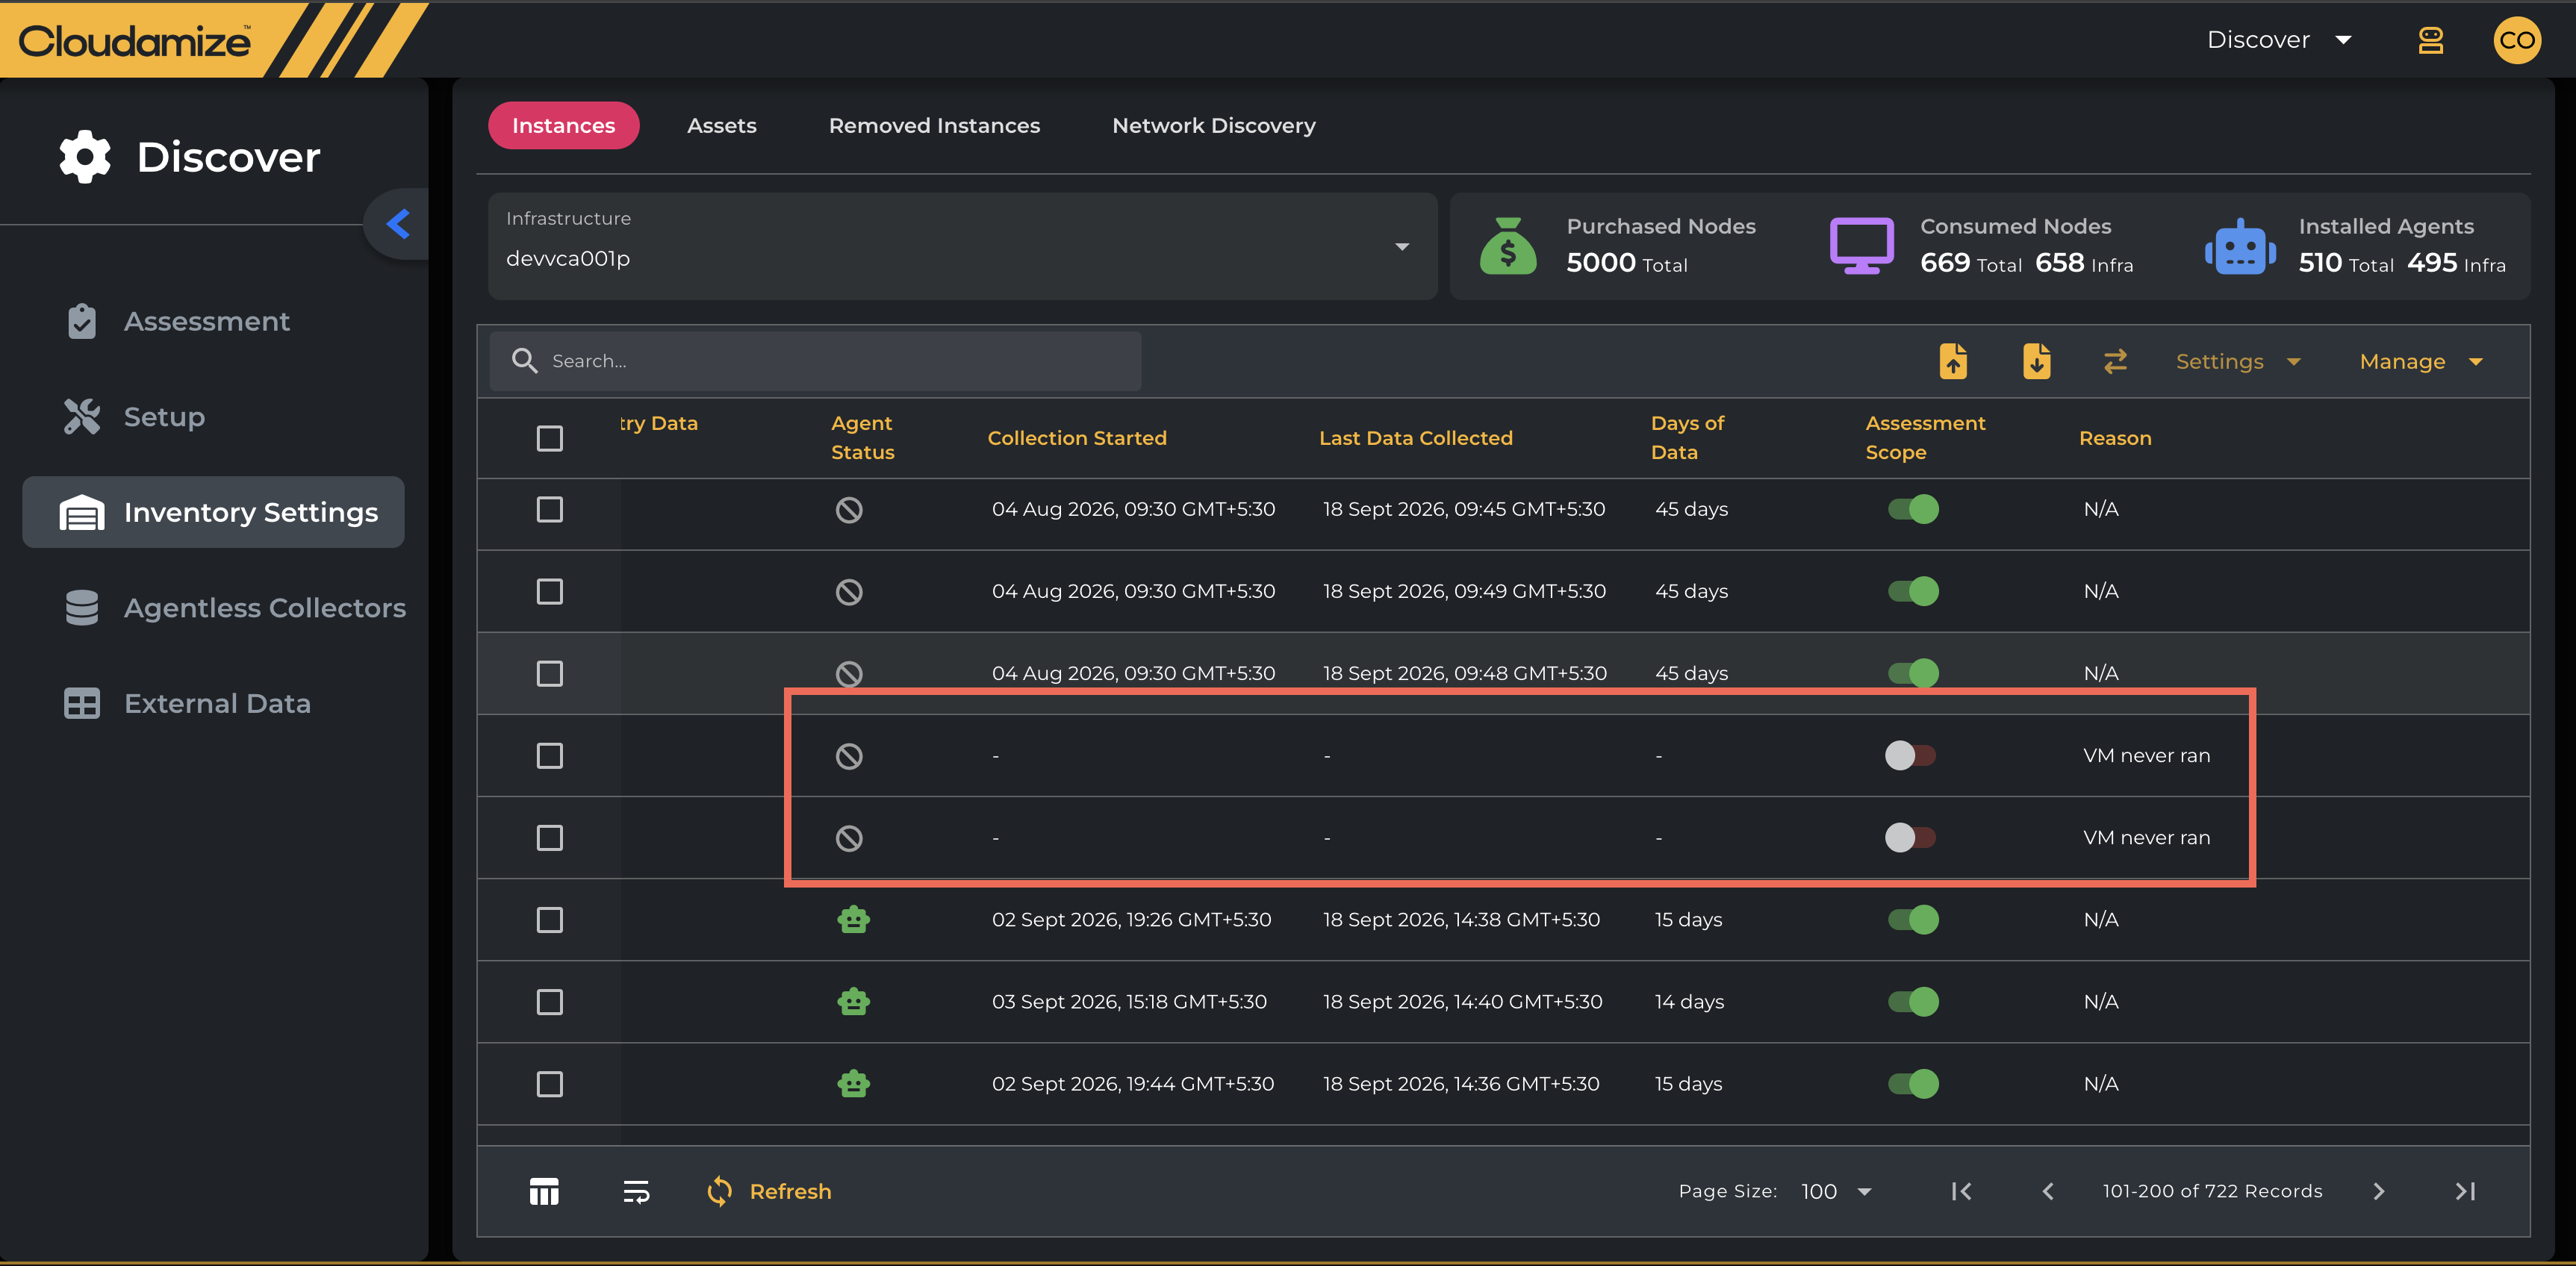
A VM that has never been powered on (no collection data at all) shows – in all three columns, with no tooltip.
The Telemetry Data Source toggle controls whether CPU and memory utilization metrics are sourced from the hypervisor or from agents running on virtual machines. This configuration is used as the basis for Total Cost of Ownership (TCO) calculations and should be selected based on data accuracy and availability.
Note: CPU and memory utilization metrics collected at the VMware hypervisor level are considered more reliable than those obtained through agent-based or agentless Data collection methods
Note: If you add nodes after the data collection has started, Cloudamize will automatically include those new nodes in the assessment scope. If newly added nodes are not added and are required for the final assessment, please get in touch with the Cloudamize Helpdesk for assistance at helpdesk@cloudamize.com or via our portal.
Downloading and Uploading Infrastructure and Asset Information
We can download an overview of the infrastructure by clicking the Download button (see screenshot).
We can also upload an asset group mapping in .csv format by clicking the Upload button (see screenshot).


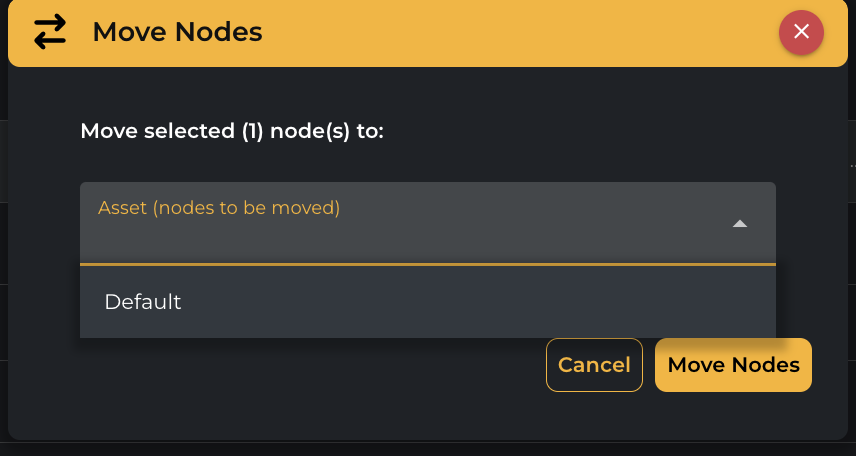
The ⇄ symbol indicates the Move Nodes to Another asset. The same can be done by selecting the node/nodes and then selecting the preferred Asset to move the selected node through the drop-down button, as shown below.

Settings and Manage
The Settings option gets enabled once you select the one or more nodes, and the drop-down button shows the options (Assessment scope, Data Collection), which will allow you to add the node/nodes into the assessment scope and enable data collection, as shown in the screenshot below.

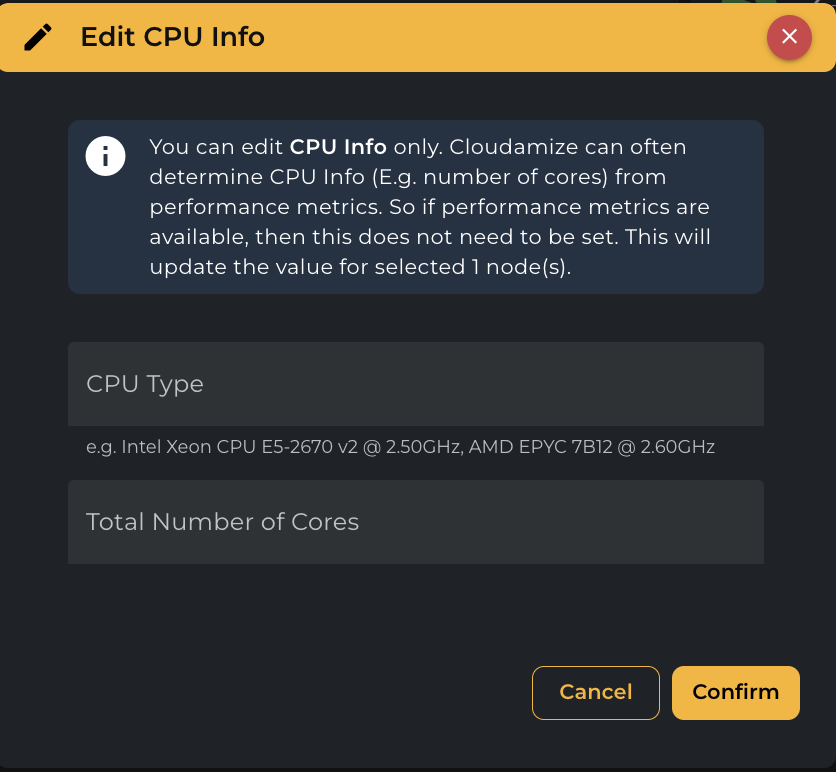
The Manage option gets enabled once you select the one or more nodes, and the drop-down button shows the options (Edit CPU info, Remove). You can edit CPU Info only. Cloudamize can often determine CPU Info (e.g., number of cores) from performance metrics. So if performance metrics are available, then you don’t need to set this. This will update the value for the selected 1 node(s).


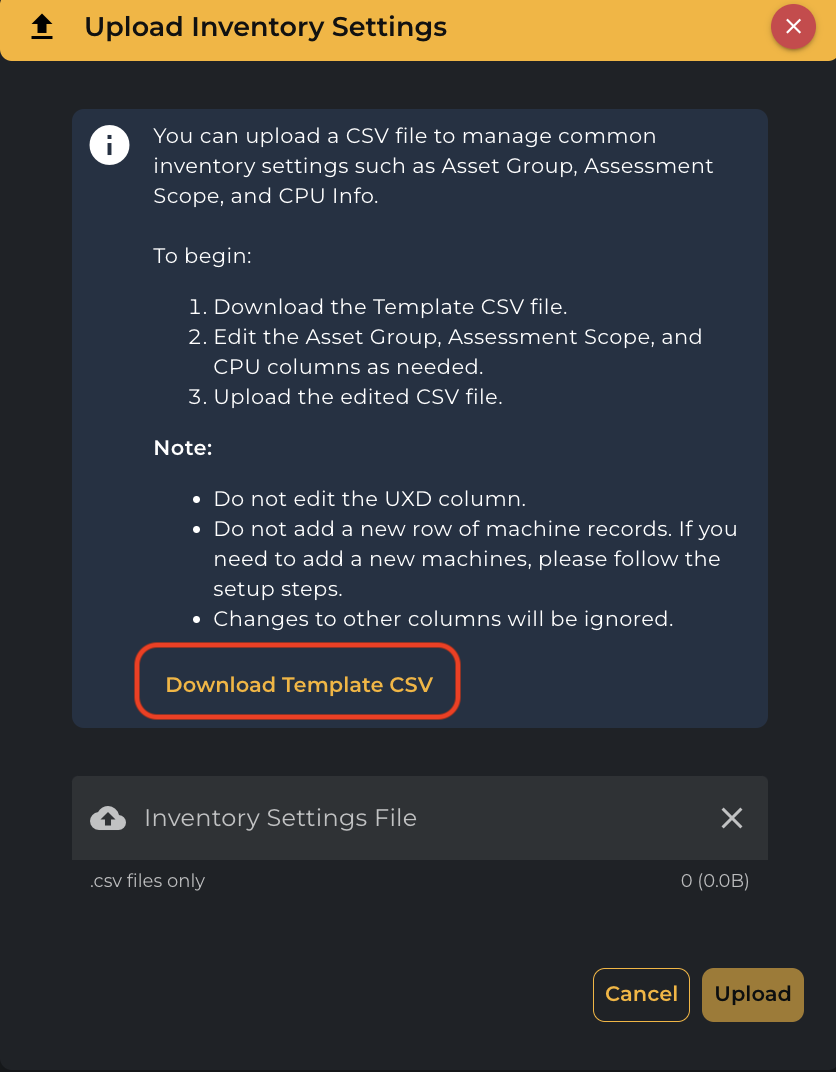
You can also enter the CPU details for multiple machines and upload them to the inventory settings page via CSV. To do this, on the Inventory Settings page, click Upload Inventory Settings to activate the feature.
Clicking “Upload Inventory Settings” opens the “Upload Inventory Settings to Control Inventory Settings” pop-up. First-time users should download the Sample CSV by clicking the “Download Template CSV” button in the pop-up. The Sample CSV lists the entire inventory for the selected infrastructure and serves as a template for uploading the CSV.
Below is a screenshot of the downloaded sample file. You can modify the records (Asset Name, Assessment Scope, CPU Type) in the CSV and upload it back. Don’t change the headers or columns, as this will invalidate the file.
CPU type format
e.g., Intel Xeon CPU E5-2670 v2 @ 2.50GHz, AMD EPYC 7B12 @ 2.60GHz
Infrastructure_Settings

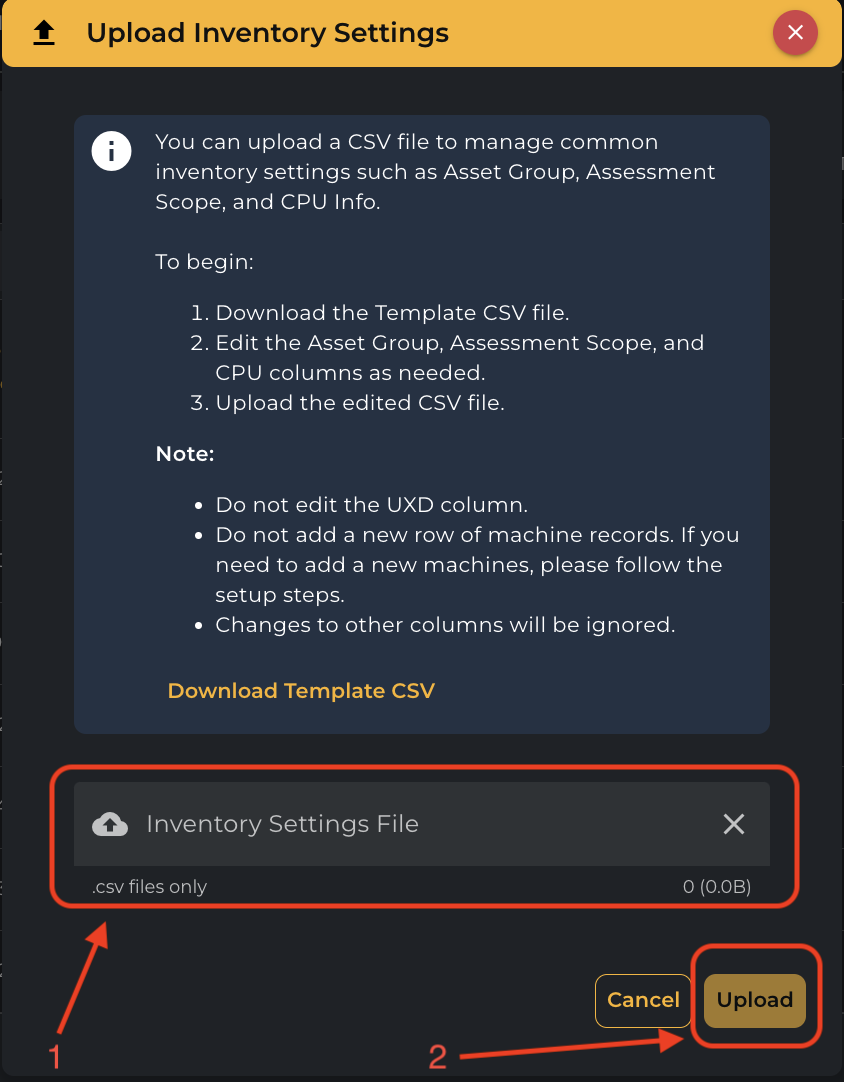
Once the desired changes are made to the records, the user can upload the CSV back to the system. The user must take the following actions to upload the file:
-
Click the Inventory Settings File button to choose a file from the file system.
-
Once the correct file is chosen, click the Upload button to upload it back to the system.

The Edit CPU info button also allows you to enter the CPU type and the total number of cores manually for a selected node/nodes and then click Confirm, as shown in the screenshot below.
Note: Instances cannot be removed once the assessment has started. The remove option will be disabled.
Infrastructure views
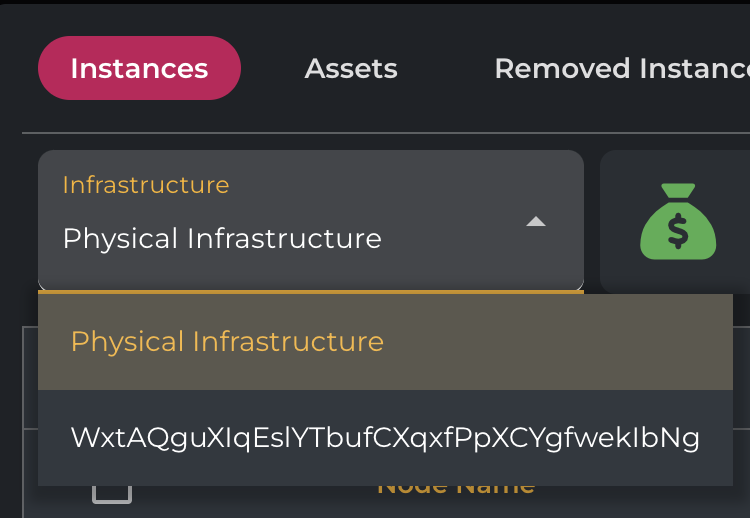
By selecting View Infrastructure, we can change views between Physical Infrastructure and Hypervisors. Selecting a hypervisor lets you view all the VMs on a specific host.
By selecting Physical Infrastructure, we will be able to see all the nodes with agents installed or monitored by an agentless data collector, even if they are already being monitored.
For details on how the Collection Started, Last Data Collected, and Days of Data columns behave on Hyper-V and vCenter tabs, see Hyper-V and vCenter Behaviour .
Nodes Overview
At the top right of the inventory settings page, there will be the following three fields:
-
Purchased Nodes: The total number of licenses assigned to the assessment.
-
Consumed Nodes: The total number of licenses consumed by the instances included in scope (one per instance).
-
Installed Agents: The total number of nodes monitored by Cloudamize Agents and/or Agentless Data Collectors, including any Removed Instances.

If you have any queries, please get in touch with the helpdesk via our Helpdesk Portal or by email at helpdesk@cloudamize.com.