

ℹ️ Note: This feature is currently in Private Beta Release.
Overview
Cloudamize Express is a fast-path, flat-file ingestion and assessment solution that delivers rapid, directional cloud Total Cost of Ownership (TCO) financial models and right-sizing recommendations.
Traditional cloud assessments often require deploying live collection agents or configuring agentless network appliances, a process that can take weeks of monitoring to gather historical telemetry. We built Cloudamize Express to bridge this gap, so cloud architects, partners, and IT leaders can quickly evaluate cloud economics, compare migration strategies, and generate executive-ready TCO reports in minutes using existing infrastructure data.
Currently, Cloudamize Express exclusively supports target recommendations for Amazon Web Services (AWS), featuring specialized optimization tracks tailored for AMD-powered instances to ensure maximum price-to-performance efficiency.
Why We Built Cloudamize Express
-
Eliminate Time-to-Value Bottlenecks: Provides immediate cost-direction views without waiting for multi-week telemetry collection.
-
Streamline Early-Stage Discovery: Enables rapid pre-sales assessments, directional budgeting, and high-level cloud feasibility studies during initial client engagements.
-
Maximize Existing Data Assets: Unlocks immediate value from infrastructure reports you already possess, such as VMware vCenter RVTools exports or cloud asset management flat files.
-
Standardize Multi-Source Ingestion: Automatically parses, normalizes, and cleanses disparate inventory formats into a unified cloud recommendation model.
How It Works
Cloudamize Express automates inventory ingestion and cloud financial modeling through a 5-step processing pipeline:
-
Flat-File Ingestion: Users upload an existing infrastructure inventory file, either a native RVTools VMware export (
.xlsx/.xlsm) or an AWS Inventory flat-file (.csv/.xlsx/.xlsm) via the Cloudamize login portal or console. -
Automated Parsing & Mapping: The Express engine extracts 78 core infrastructure attributes directly from source sheets (e.g., RVTools
vInfo), mapping vCPUs, RAM, disk allocations, network configurations, and OS metadata. -
Validation & Smart Normalization: Input data is cleansed automatically. Missing optional values are backfilled using intelligent defaults (e.g., region defaults to
us-east-1, pricing model defaults to On-Demand), and non-standard syntax is normalized. -
Target Cloud Design Evaluation: Workloads are evaluated against hyperscaler pricing APIs using selected design strategies:
-
RVTools: Evaluates Like-to-Like (1:1 resource match) or Modernized (next-generation instance families) profiles.
-
AWS Flat-Files: Evaluates Hourly Cost Optimization, Modernize, or Modernize & Downsize profiles.
-
-
Instant Financial & Sizing Output: Express generates an interactive dashboard displaying annual TCO projections, top cost drivers, instance family spend breakdowns, and downloadable executive summary reports.
Processing Note:
The entire ingestion and calculation process completes within minutes, providing instant directional visibility without modifying your existing source data.
Difference Between Express and Standard Analysis
-
Express (Flat-File Analysis): Provides a quick directional view from a single point-in-time inventory export. Because RVTools and flat-file reports capture data at a single moment (which may be a peak, a trough, or an average), it can introduce migration sizing inaccuracies by underestimating or overestimating actual cloud costs.
-
Standard Analysis (Migration-Grade Sizing): Collects live performance telemetry for a minimum of 2 weeks, capturing actual workload peaks, troughs, and utilization patterns.
-
Expected Outcome: On average, customers see 35–50% cost savings using Standard Analysis compared to a like-for-like lift-and-shift move.
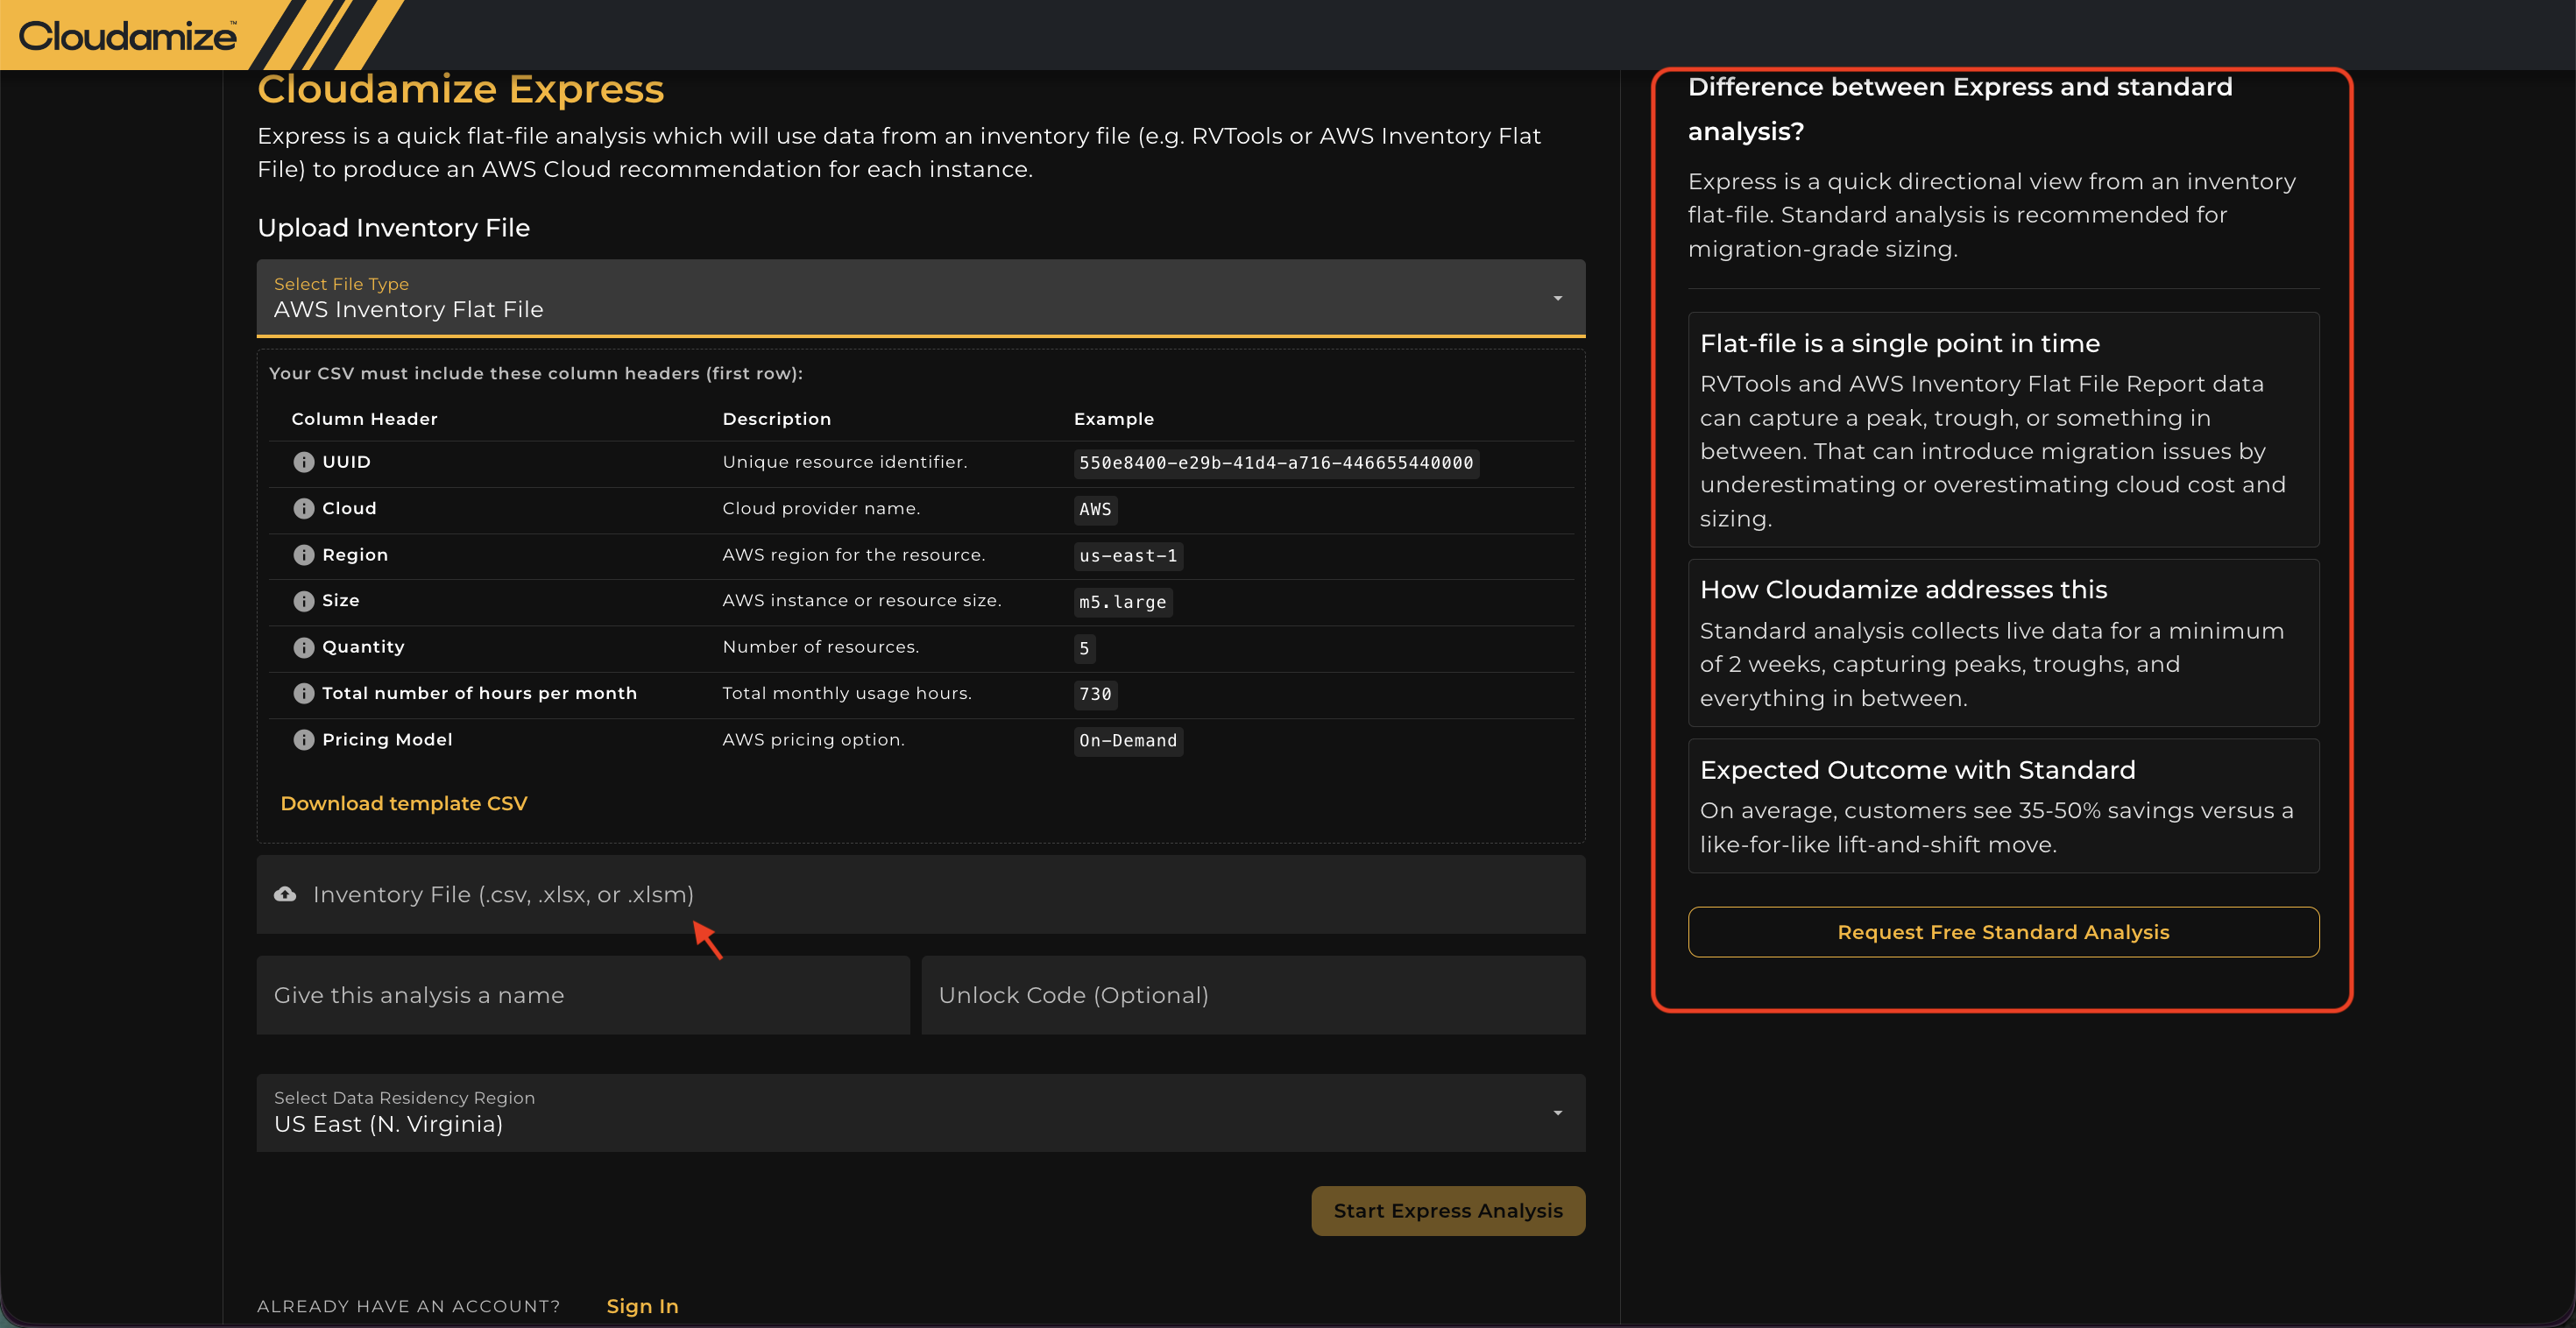
⚠️ EXPRESS VS. STANDARD ANALYSIS NOTE:
Express provides a single point-in-time, directional view. For migration-grade sizing that captures live peak and trough utilization over time (averaging 35–50% savings versus lift-and-shift), click Request Free Standard Analysis on the right side panel.
How to Register and Start an Express Analysis
Cloudamize Express provides dedicated workflows depending on whether you are a new user creating an account or an existing customer running a new analysis.
1. Creating an Express Assessment (New Users - No Existing Account)
If you do not have an active Cloudamize account, follow these steps to register and initiate your analysis:
-
Navigate to the Cloudamize login portalhttps://console.cloudamize.com/#/login.
-
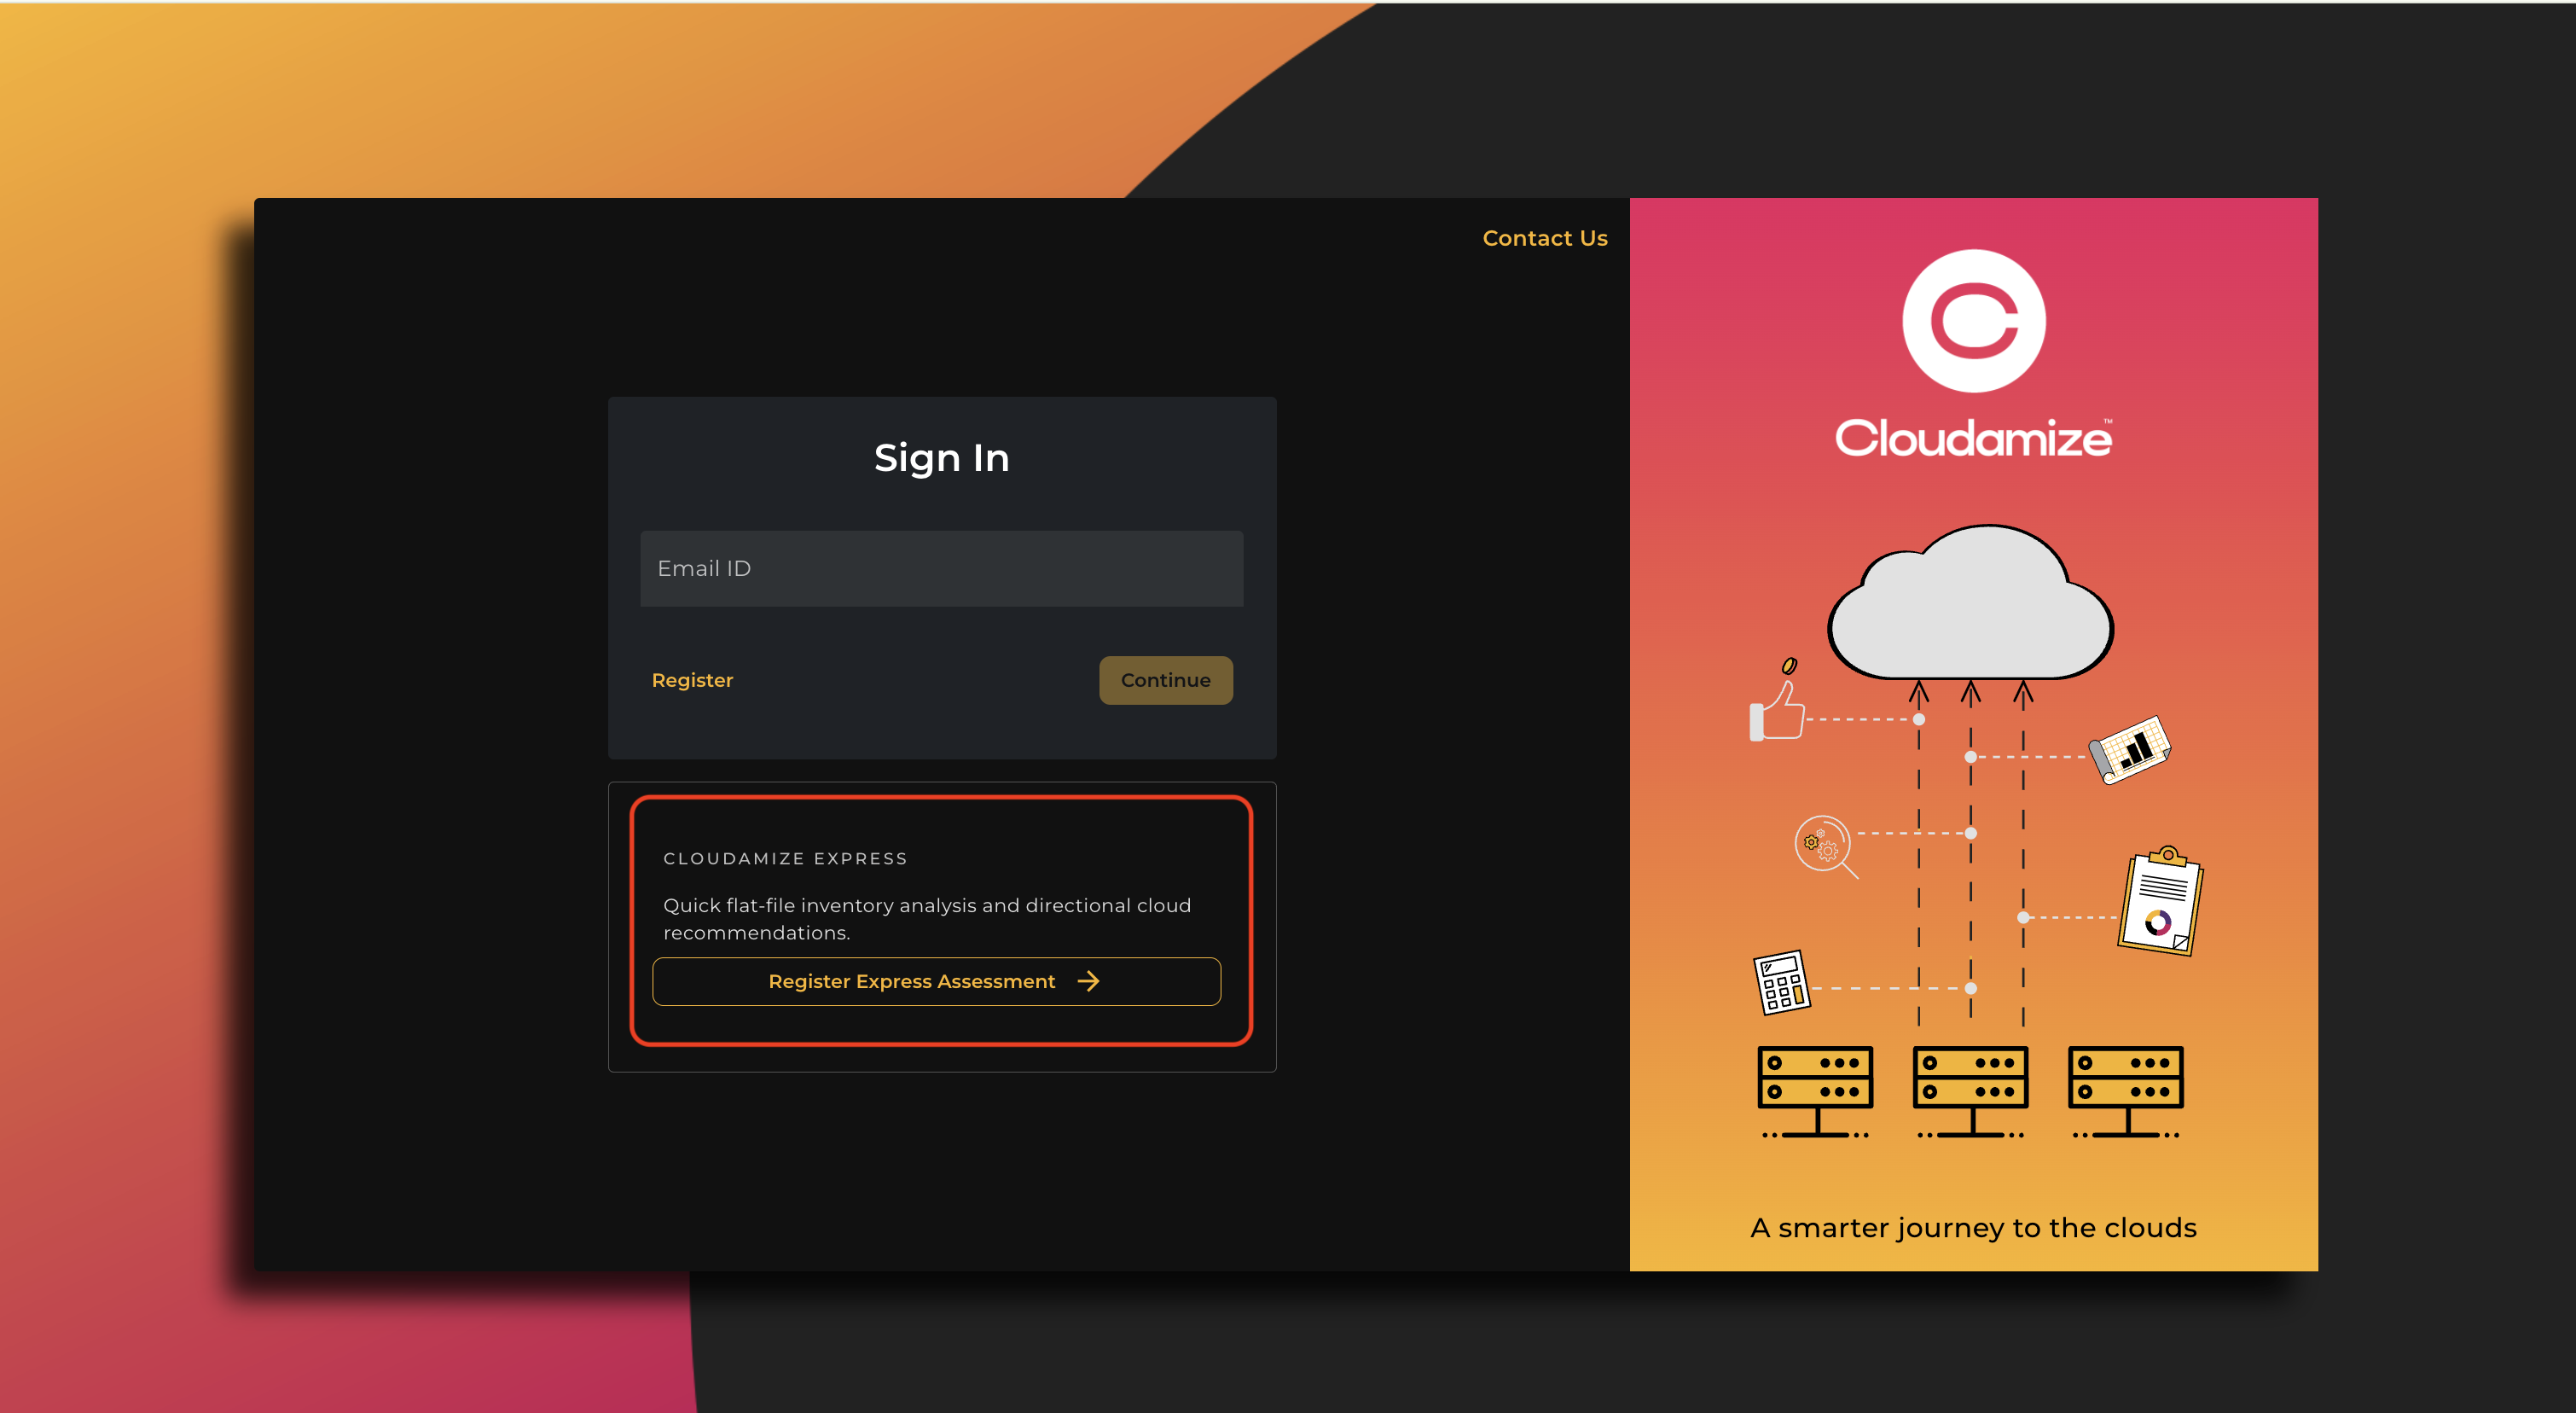
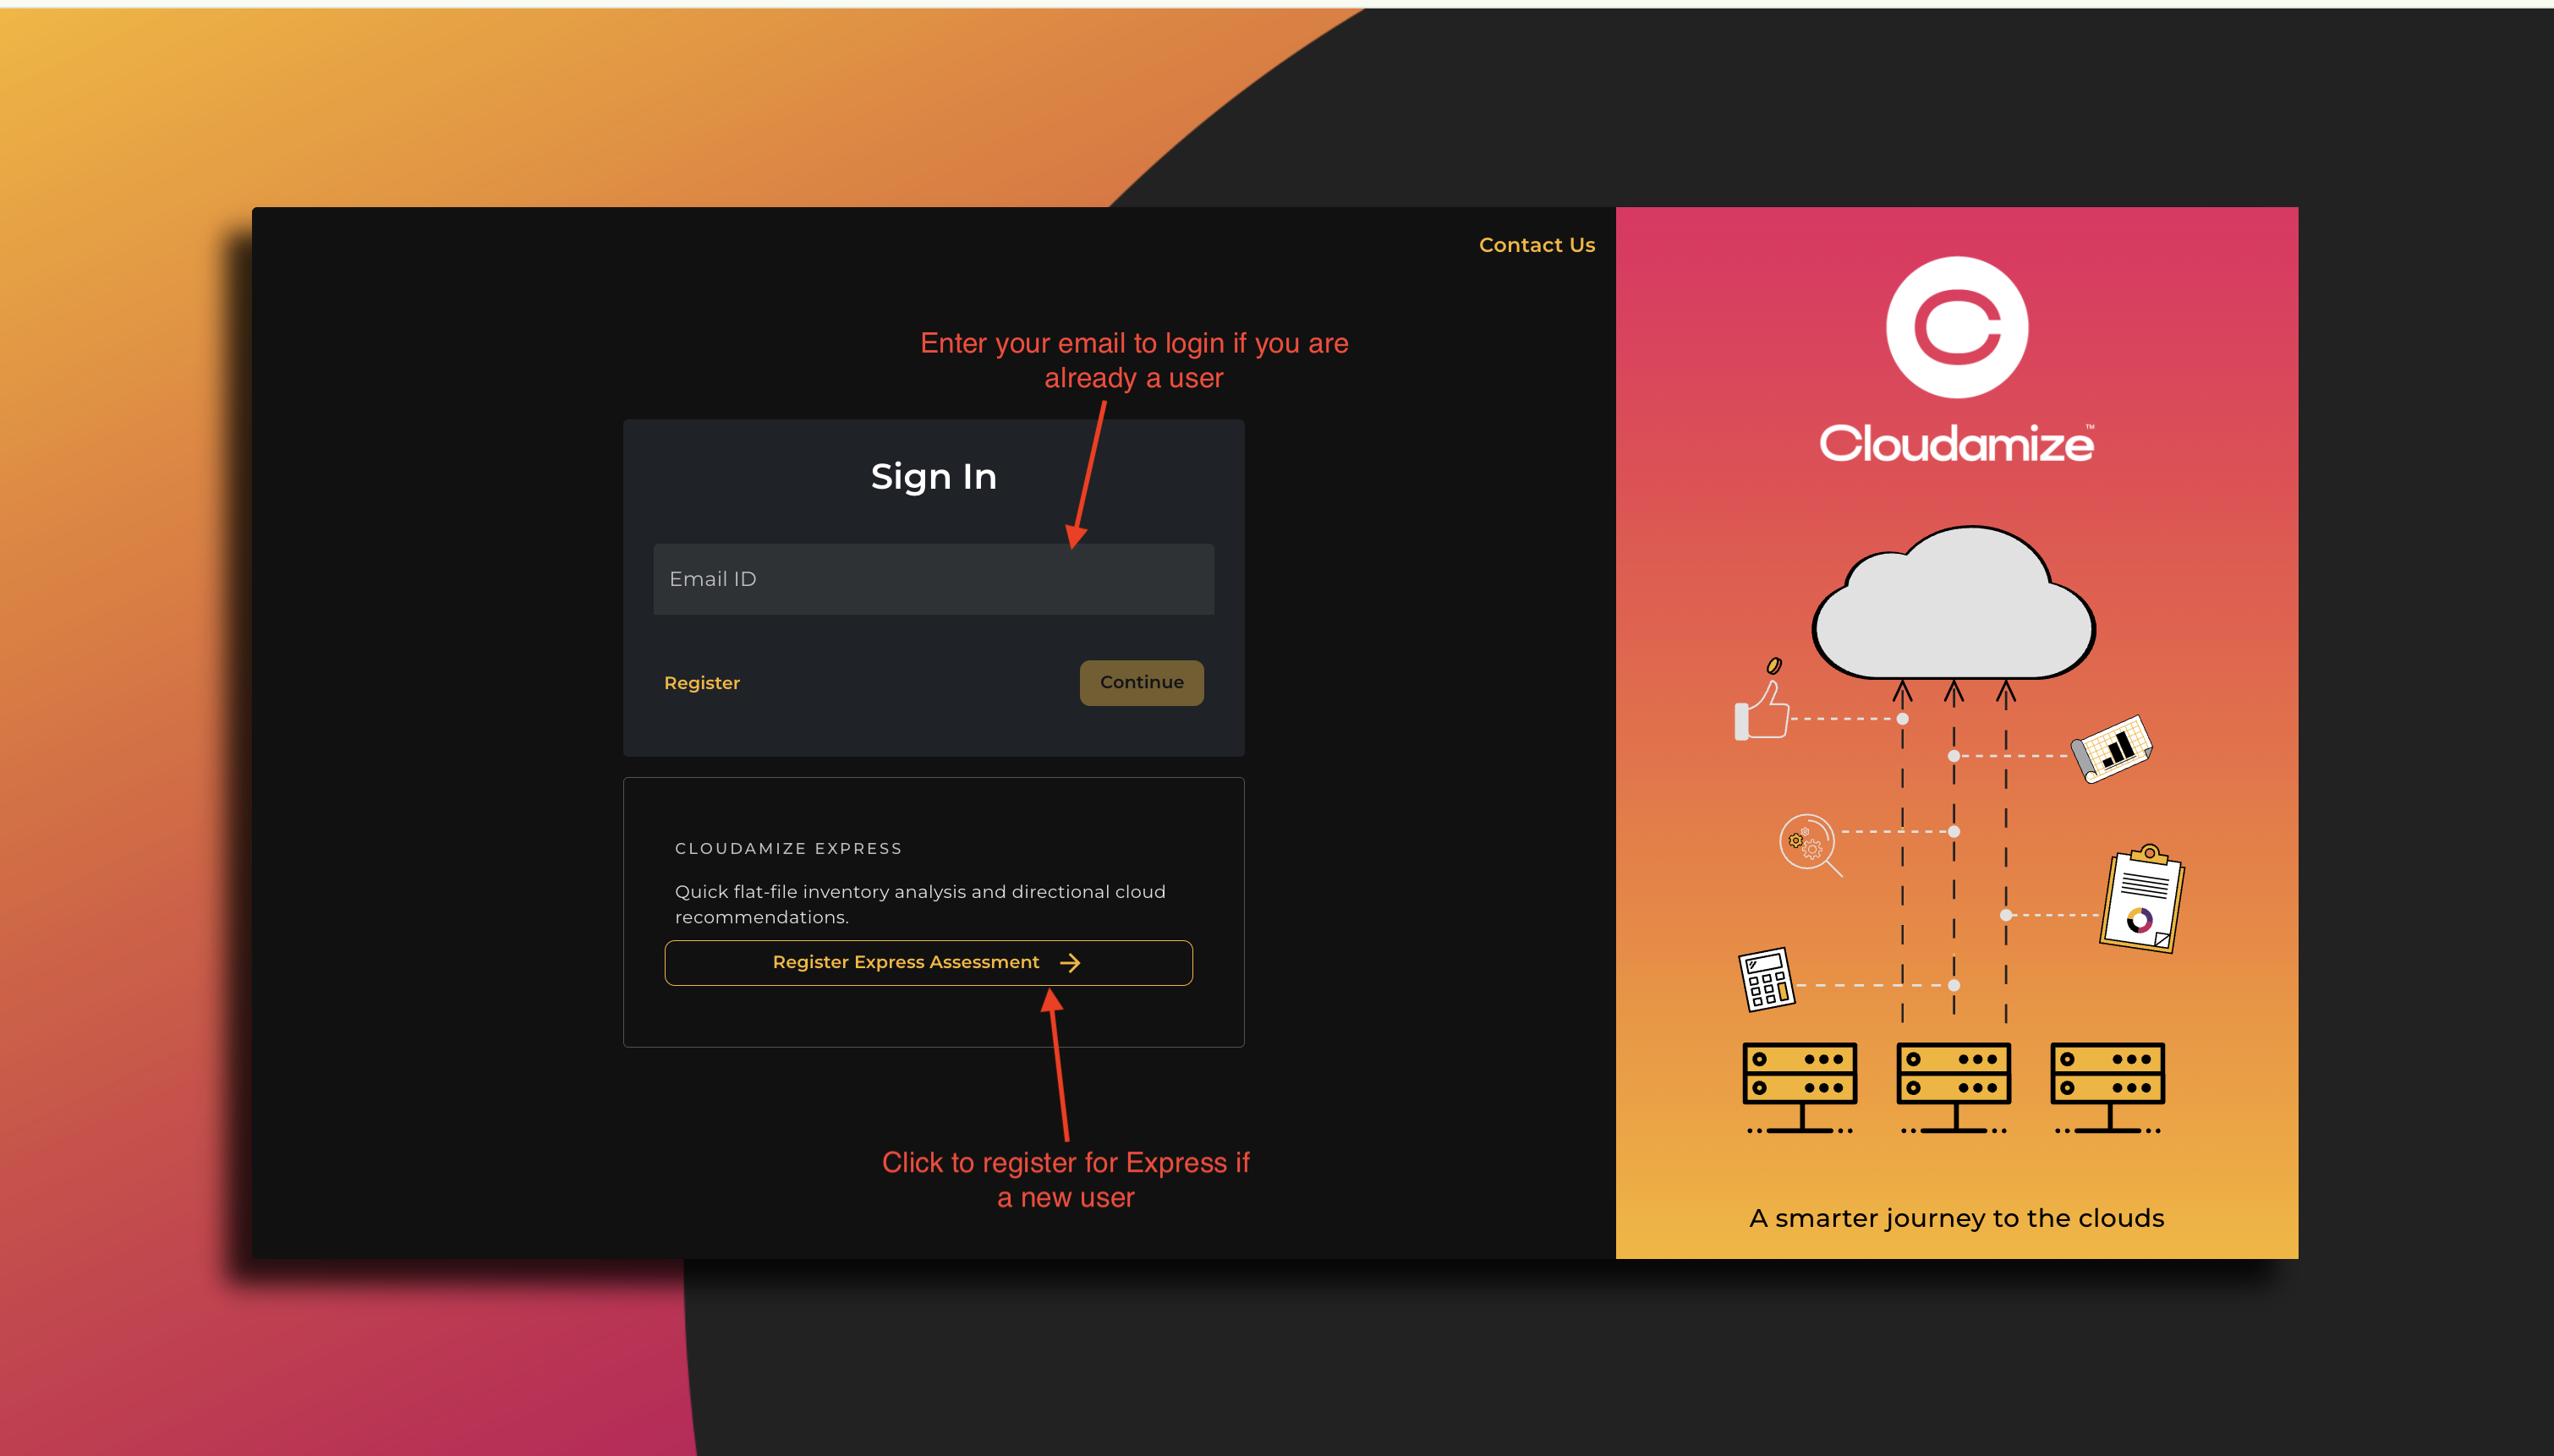
Locate the CLOUDAMIZE EXPRESS card at the bottom of the sign-in screen and click the Register Express Assessment → button.
Caveat: Onboarding Email Notifications: Automatic emails are not triggered when onboarding a new Express assessment, unlike in the Plan Edition.
-
You will be directed to the Cloudamize Express configuration screen.
From this configuration screen, complete the following steps to upload your file and generate an account:
Supported Ingestion Options
Cloudamize Express supports the following file formats for inventory ingestion:
|
File Type |
Supported Extension |
Native Source System |
|
.csv, .xlsx, .xlsm |
AWS Export, Asset Management Reports, Custom Inventory Spreadsheets |
|
|
.xlsx, .xlsm |
VMware vCenter RVTools Export (vInfo sheet parsing) |
Flat File Validation Rules:
Missing fields are auto-populated during parsing without rejecting rows: Empty Pricing Model defaults to On-Demand, empty Region defaults to us-east-1, and empty Provider defaults to AWS. Legacy .xls files are rejected with a prompt to save as .xlsx.
Express Analysis using AWS Inventory Input File
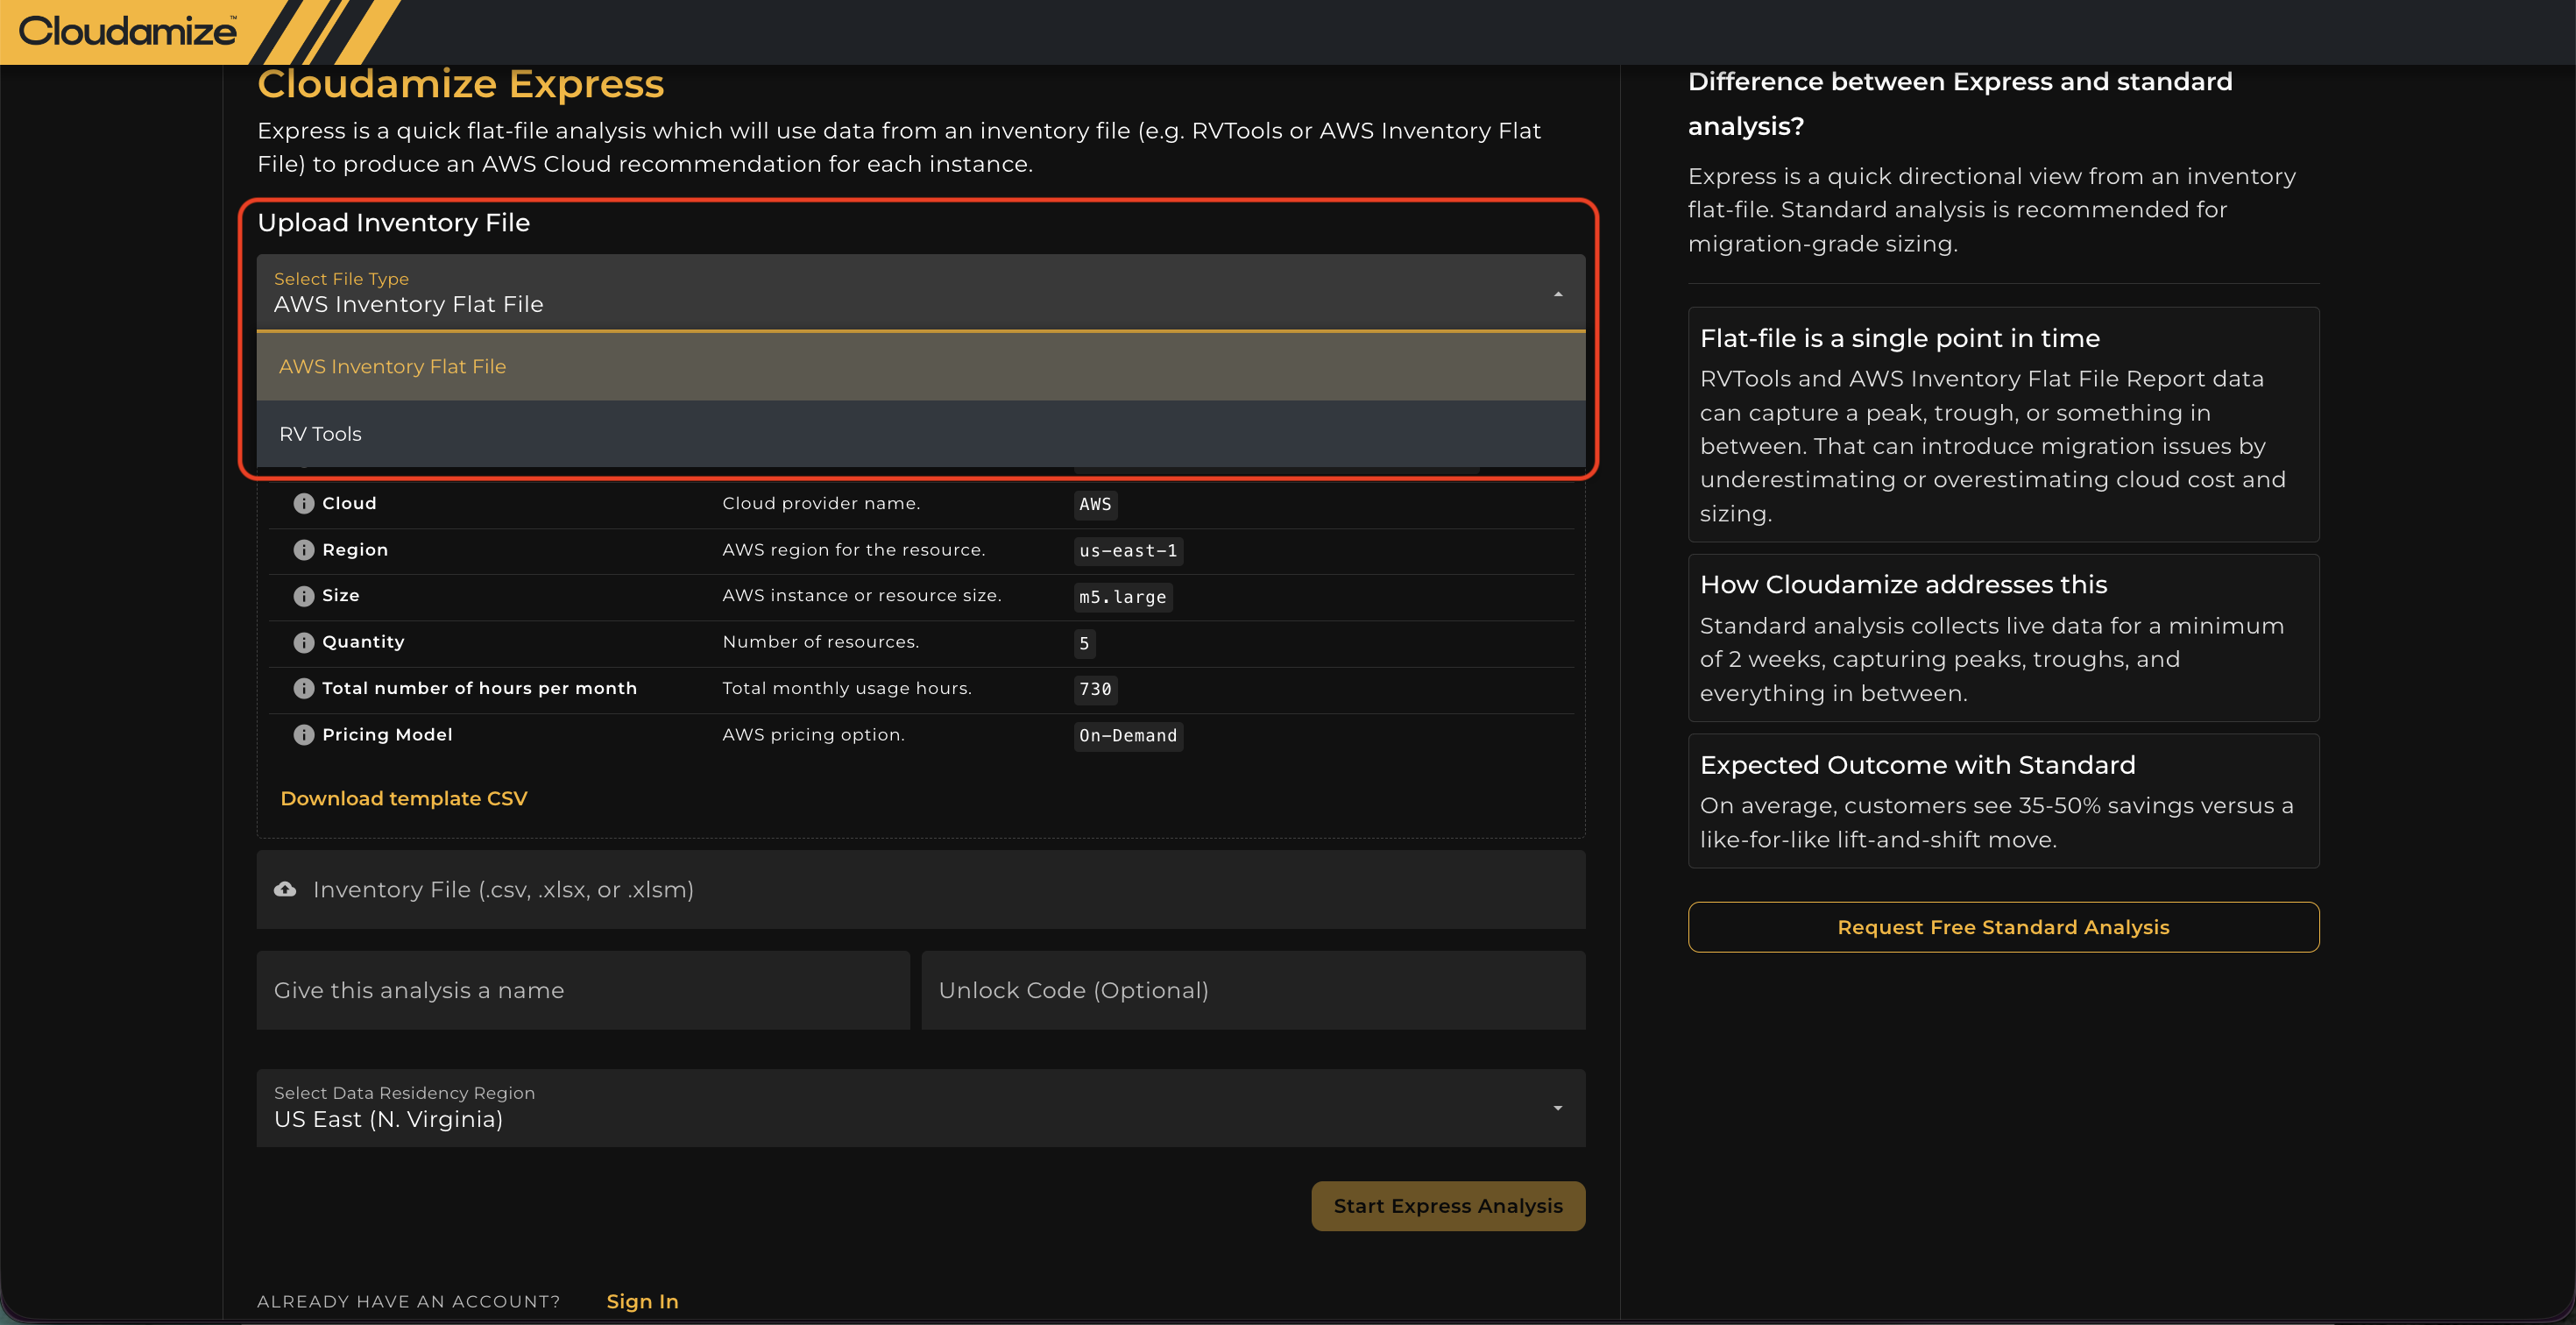
Click the Select File Type dropdown menu to choose your source file format. Cloudamize Express supports:
-
AWS Inventory Flat File
Step 2: Configure File Granularity / Requirements
Depending on your selected file type, fill in the corresponding parameters:
-
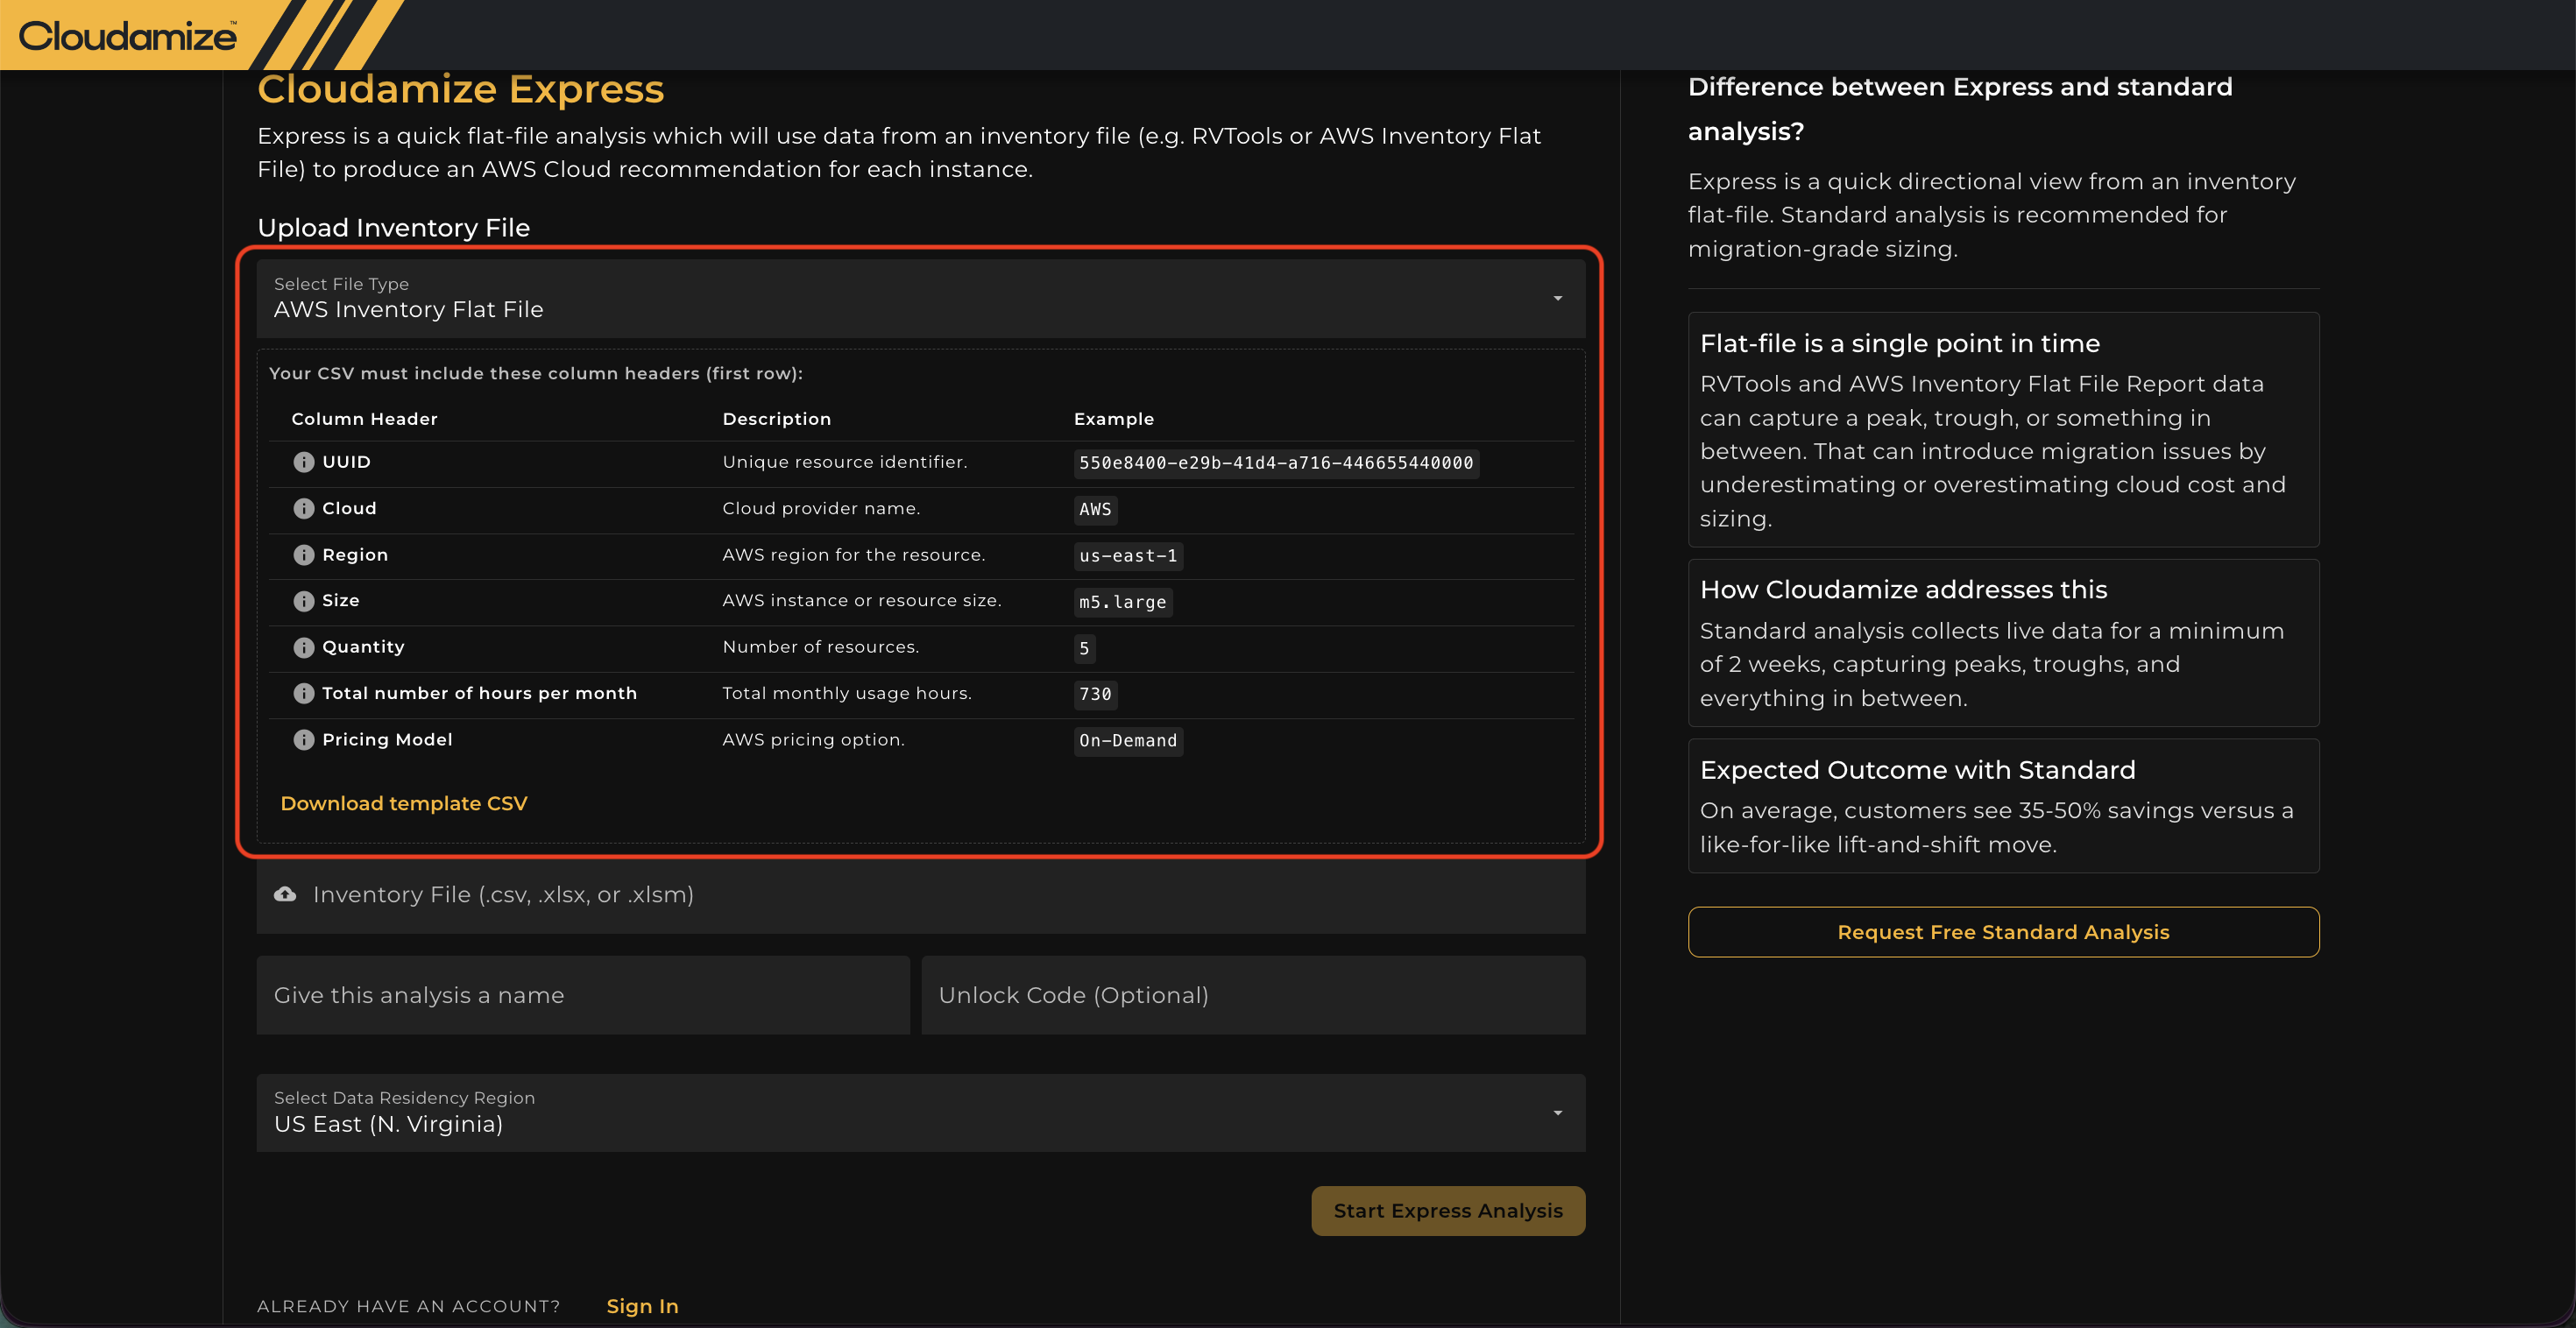
AWS Inventory Flat File: Your uploaded CSV must match Cloudamize's structural schema. You can click Download template CSV on the screen to view the required first-row headers:
|
Column Header |
Description |
Example |
|
UUID |
Unique resource identifier. |
|
|
Cloud |
Cloud provider name. |
|
|
Region |
AWS region for the resource. |
|
|
Size |
AWS instance or resource size. |
|
|
Quantity |
Number of resources. |
|
|
Total number of hours per month |
Total monthly usage hours. |
|
|
Pricing Model |
AWS pricing option. |
|
Caveat: Default Pricing Model: Recommendations currently ignore custom pricing models and default strictly to On-Demand pricing.
Step 3: Complete Final Details & Upload
-
Click the Inventory File (.csv, .xlsx, .xlsm) field to browse and attach your file.
-
Enter a unique identifier in the Give this analysis a name field.
-
Optional: Enter an Unlock Code if provided by your partner or account manager.
-
Select the target region you want to save the data using the Select Data Residency Region dropdown.
-
Click Start Express Analysis to queue the flat file for backend processing.
Caveat: Excel Data Processing Errors: If an uploaded Excel file contains invalid or incorrect data, any ignored rows or the specific reasons for skipping them will not be explicitly shown in the interface.
💡 Alternative Action: If you read the structural differences on the right panel and prefer a more comprehensive assessment instead of a flat-file analysis, you can click the Request Free Standard Analysis button to connect with our solutions team.
AWS Output Design Profiles
When reviewing an AWS Inventory analysis, select from three dedicated design strategies located on the left control panel:
1. Hourly Cost Optimization (AWS Optimized)
-
Strategy: Delivers similar or higher compute performance at the lowest available hourly cost by mapping workloads to optimal instance generations.
-
What You See On Page:
-
Summary Metrics: Total annual savings (e.g., Save $575 annually), Average Performance Uplift (e.g., 56%), and percentage of Eligible Servers.
-
Inventory Table: Maps
UUID,Region,Current Pricing Model,Current Instance Type,Recommended Instance Type,Quantity, andCurrent Runtime Hours.
-
-
Export / Report Details: Exported Excel/PDF reports display individual host mappings, instance family cost comparisons, and aggregate annual spend projections.
2. Modernize (AMD / AWS Modernized)
-
Strategy: Maintains exact instance vCPU/RAM sizes while reducing estimated runtime costs by upgrading workloads to modern, high-performance chip architectures (such as AMD EPYC
m6a/r6ainstance families). -
What You See On Page: High performance uplift metrics (e.g., 313% Avg. Perf Uplift) and direct target instance recommendations for next-generation hardware.
-
Export / Report Details: Detailed breakdown comparing source CPU models against modern target architectures with per-instance cost deltas.
3. Modernize & Downsize (AMD / AWS Downsize)
-
Strategy: Safely reduce instance sizes by up to 50% (e.g., downsizing vCPU allocation) where higher-performance next-generation hardware options can sustain workload performance.
-
What You See On Page: Displays cost savings alongside hardware downsizing metrics and performance uplift estimates (e.g., 17% Avg. Perf Uplift).
-
Export / Report Details: Resource capacity comparison tables detailing vCPU/Memory reductions alongside projected annual financial savings.
Running an Express Analysis via RVTools
Follow these steps to ingest an RVTools inventory file into Cloudamize Express:
Step 1: Access Cloudamize Express Entry Point
-
Navigate to the Cloudamize login portal.
-
Locate the CLOUDAMIZE EXPRESS card beneath the main Sign In form ("Quick flat-file inventory analysis and directional cloud recommendations.").
-
Click Register Express Assessment → (or sign in if you already have an account).
Step 2: Upload Inventory File & Configure Settings
On the Cloudamize Express upload screen, complete the following fields:
-
Select File Type: Choose RVTools from the drop-down menu.
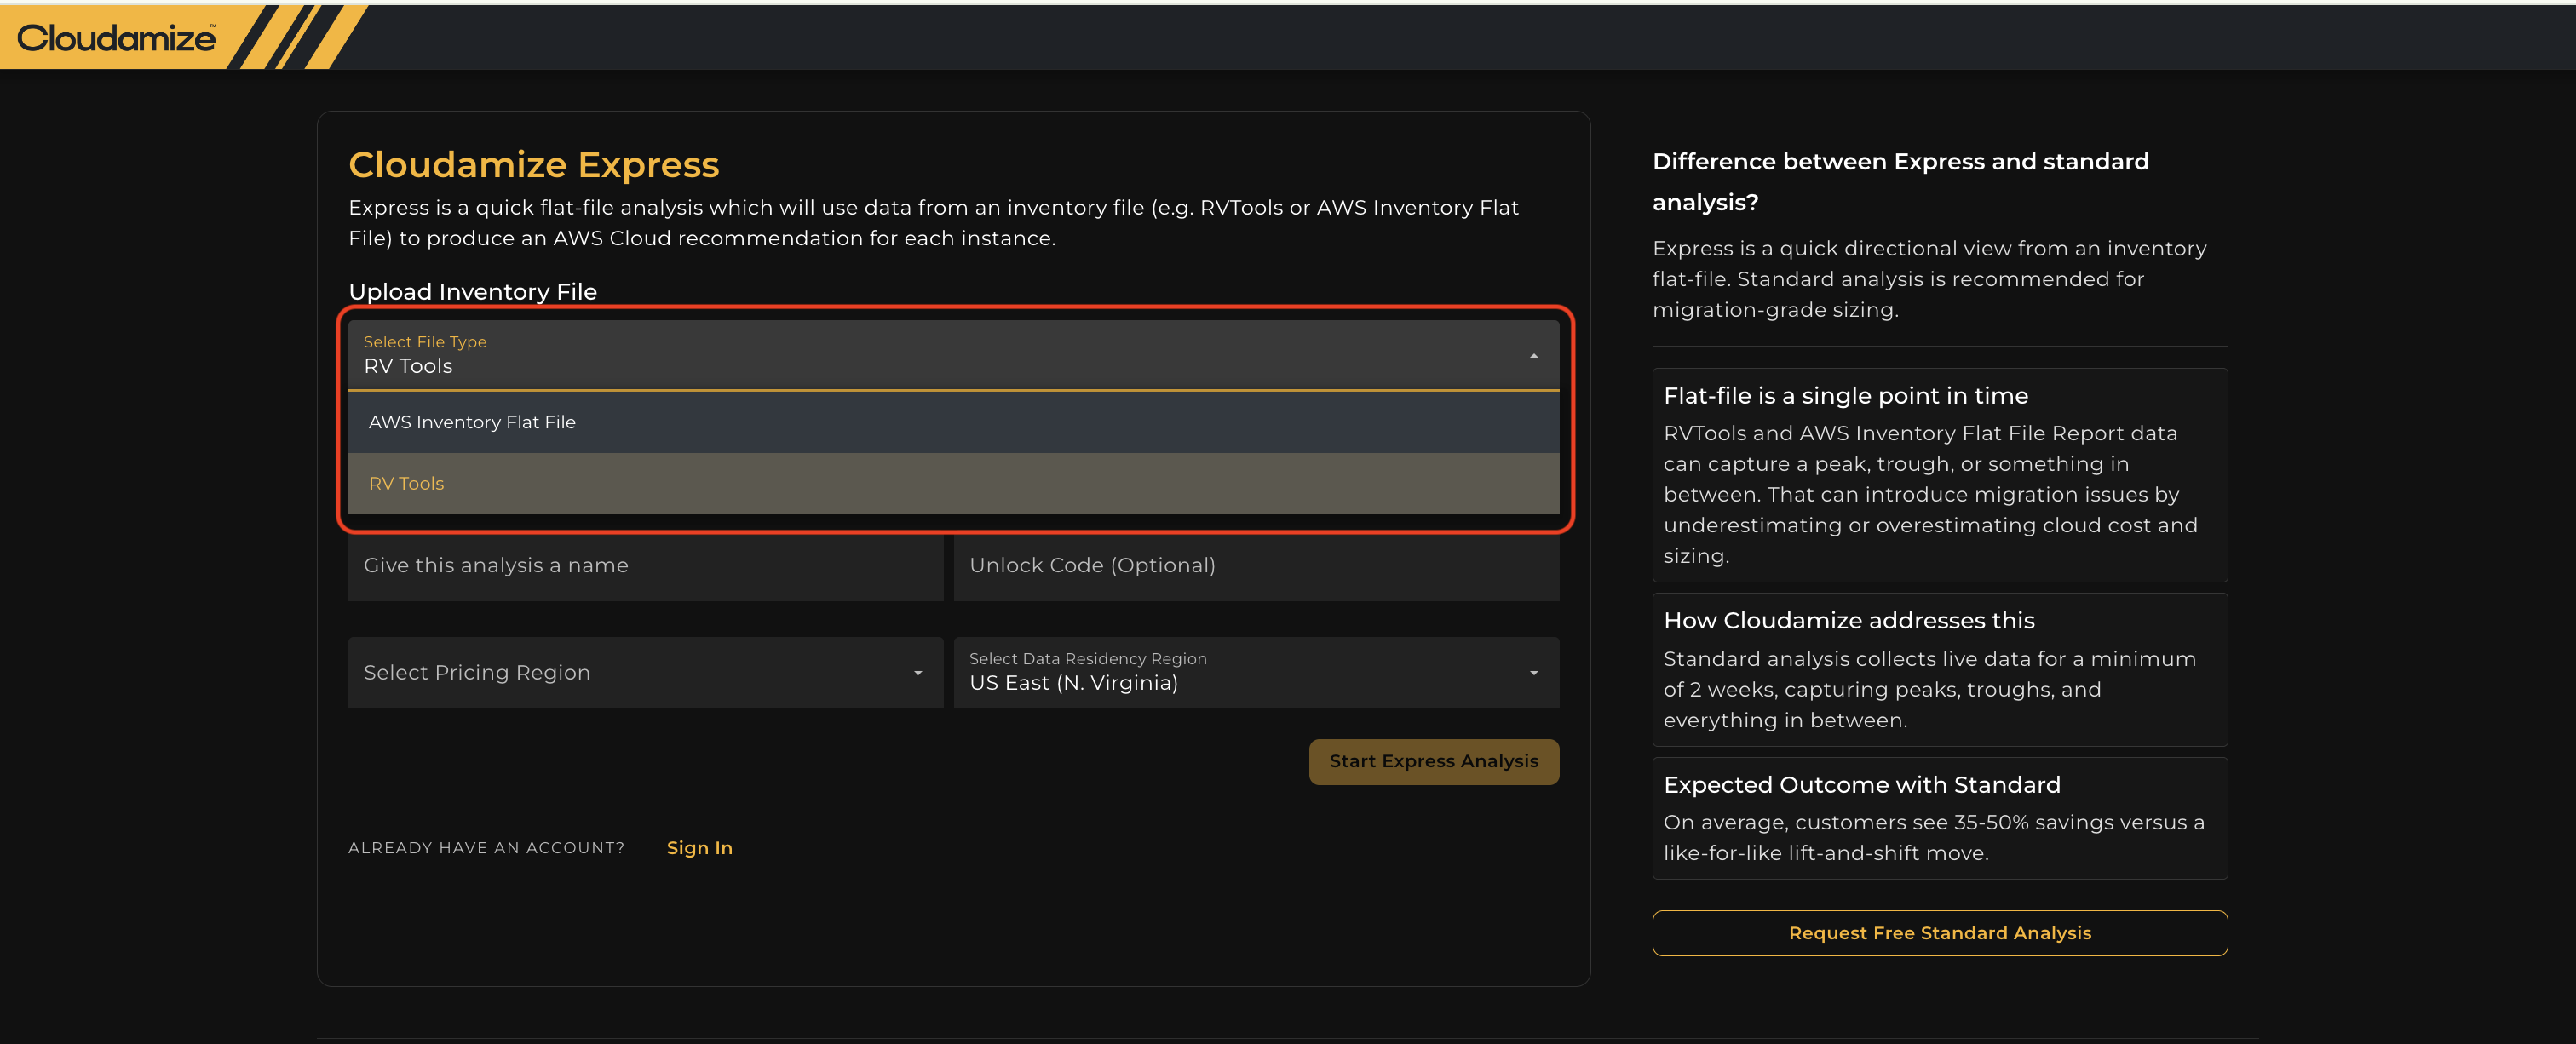
Select RVTools Option
-
Upload File: Drag and drop or browse to attach your RVTools export file (
.xlsxor.xlsmformat).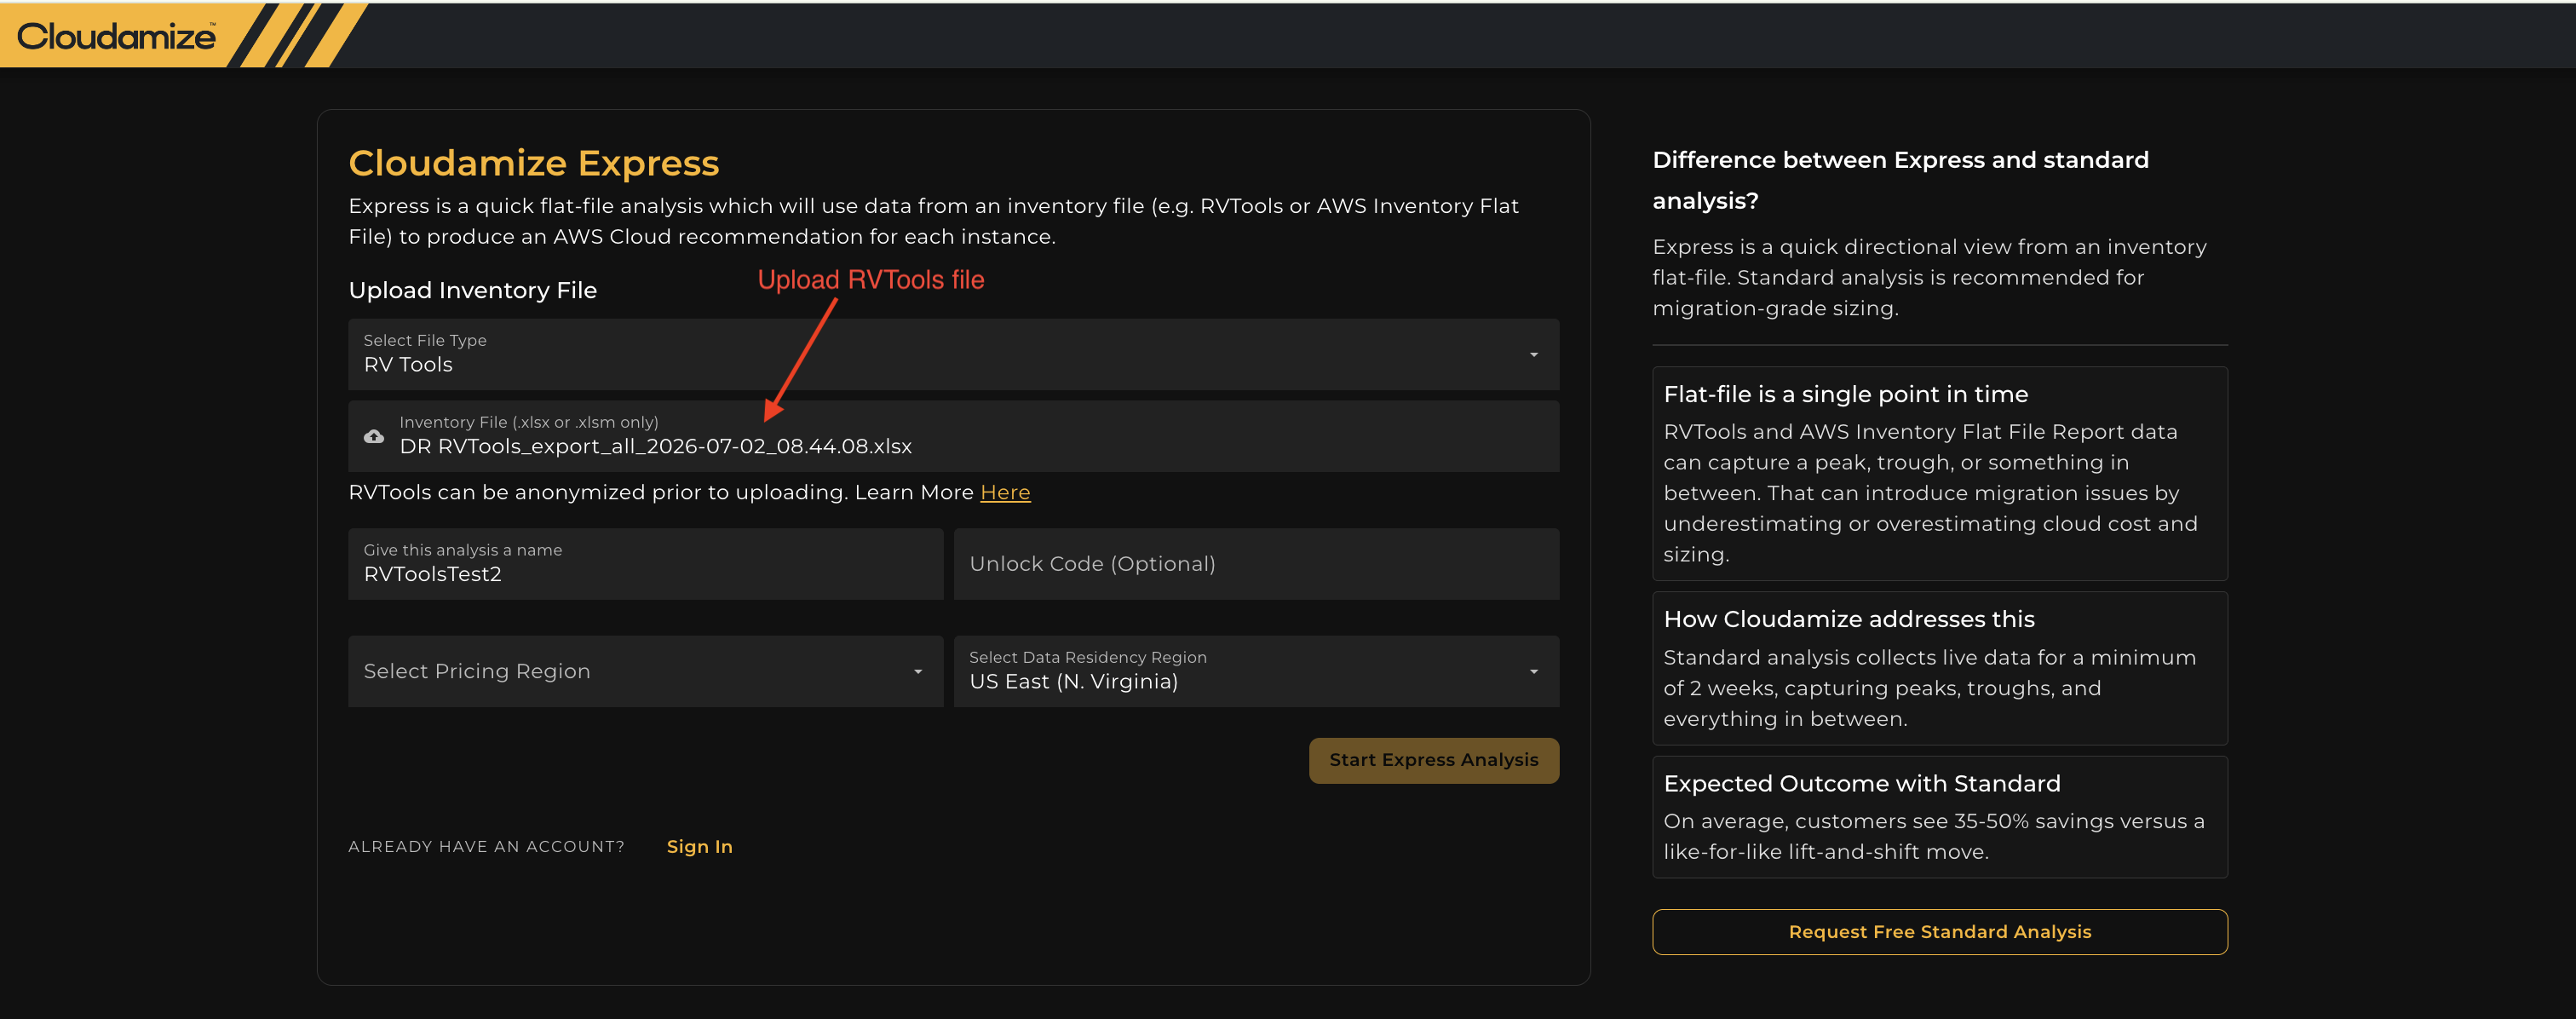
Upload RVTools file
-
Give this analysis a name: Enter a recognizable name for your assessment run (e.g.,
RVToolsTest2).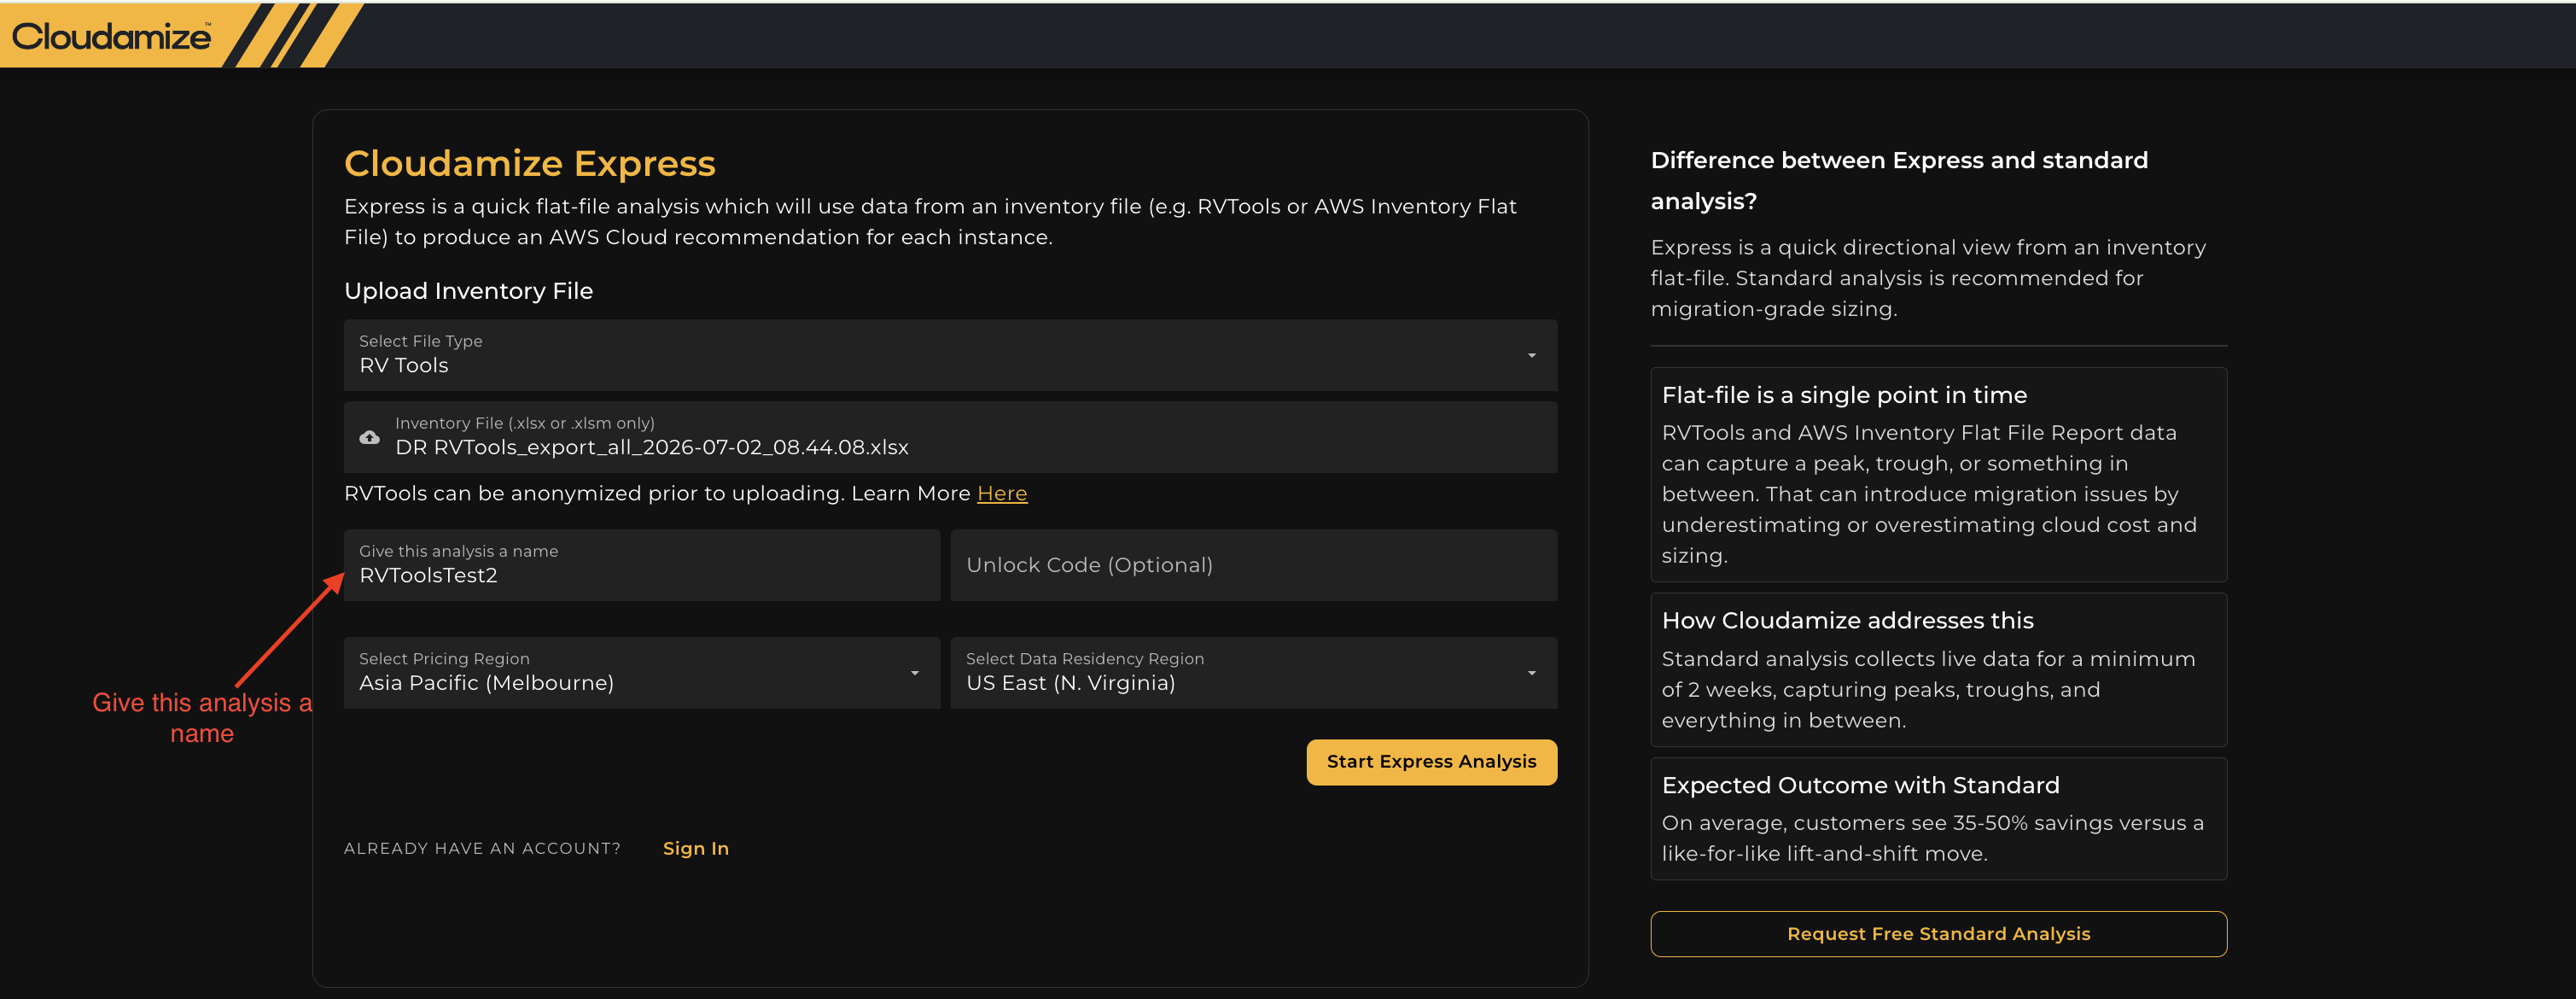
Give the Analysis Name
-
Unlock Code (Optional): Enter a promo or partner unlock code if provided.
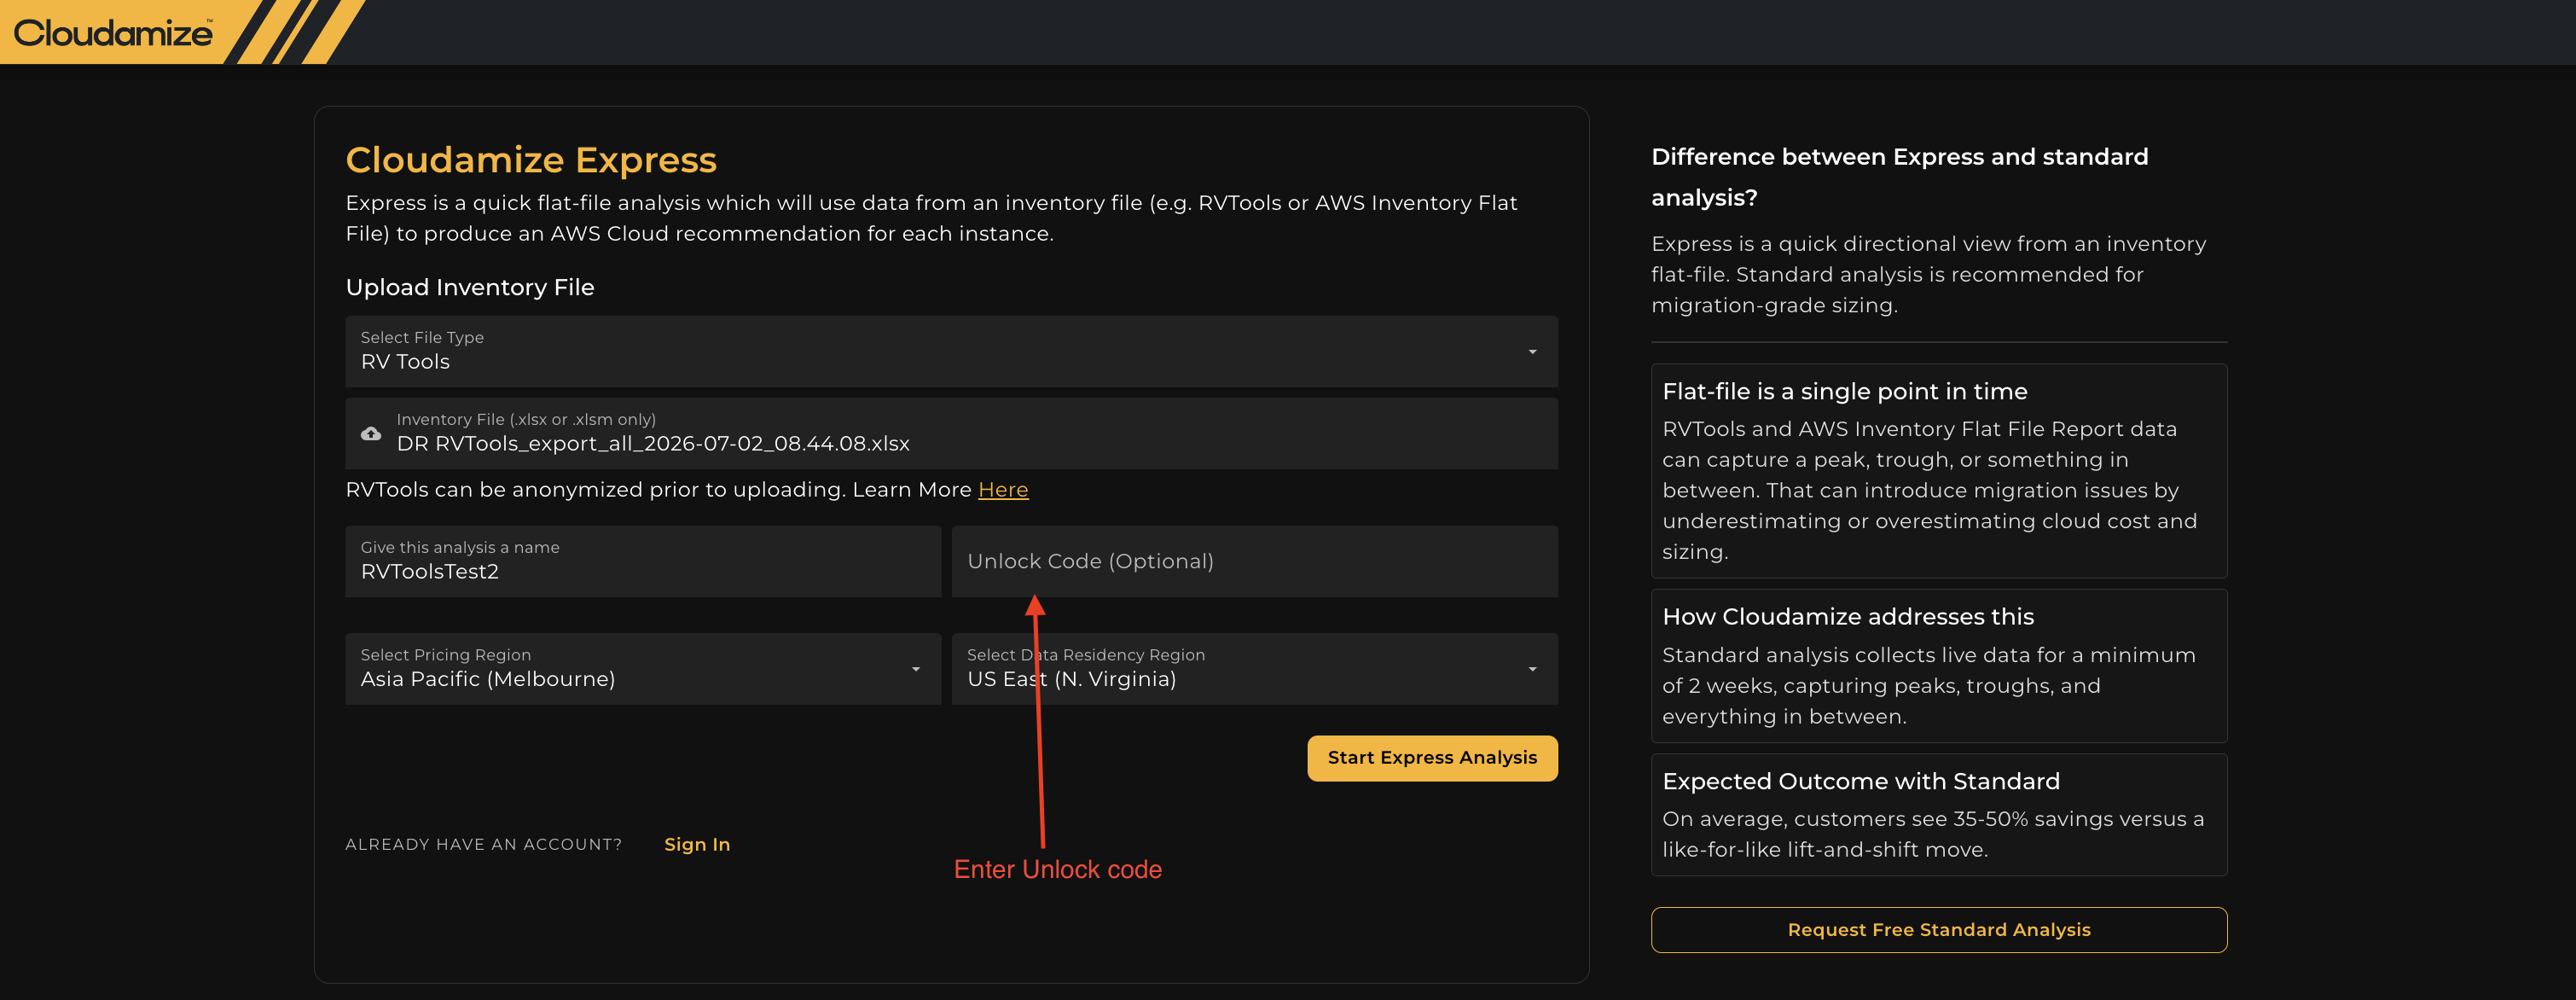
Enter Unlock Code
-
Select Pricing Region: Choose your target cloud pricing region from the drop-down menu (e.g., Asia Pacific (Melbourne)).
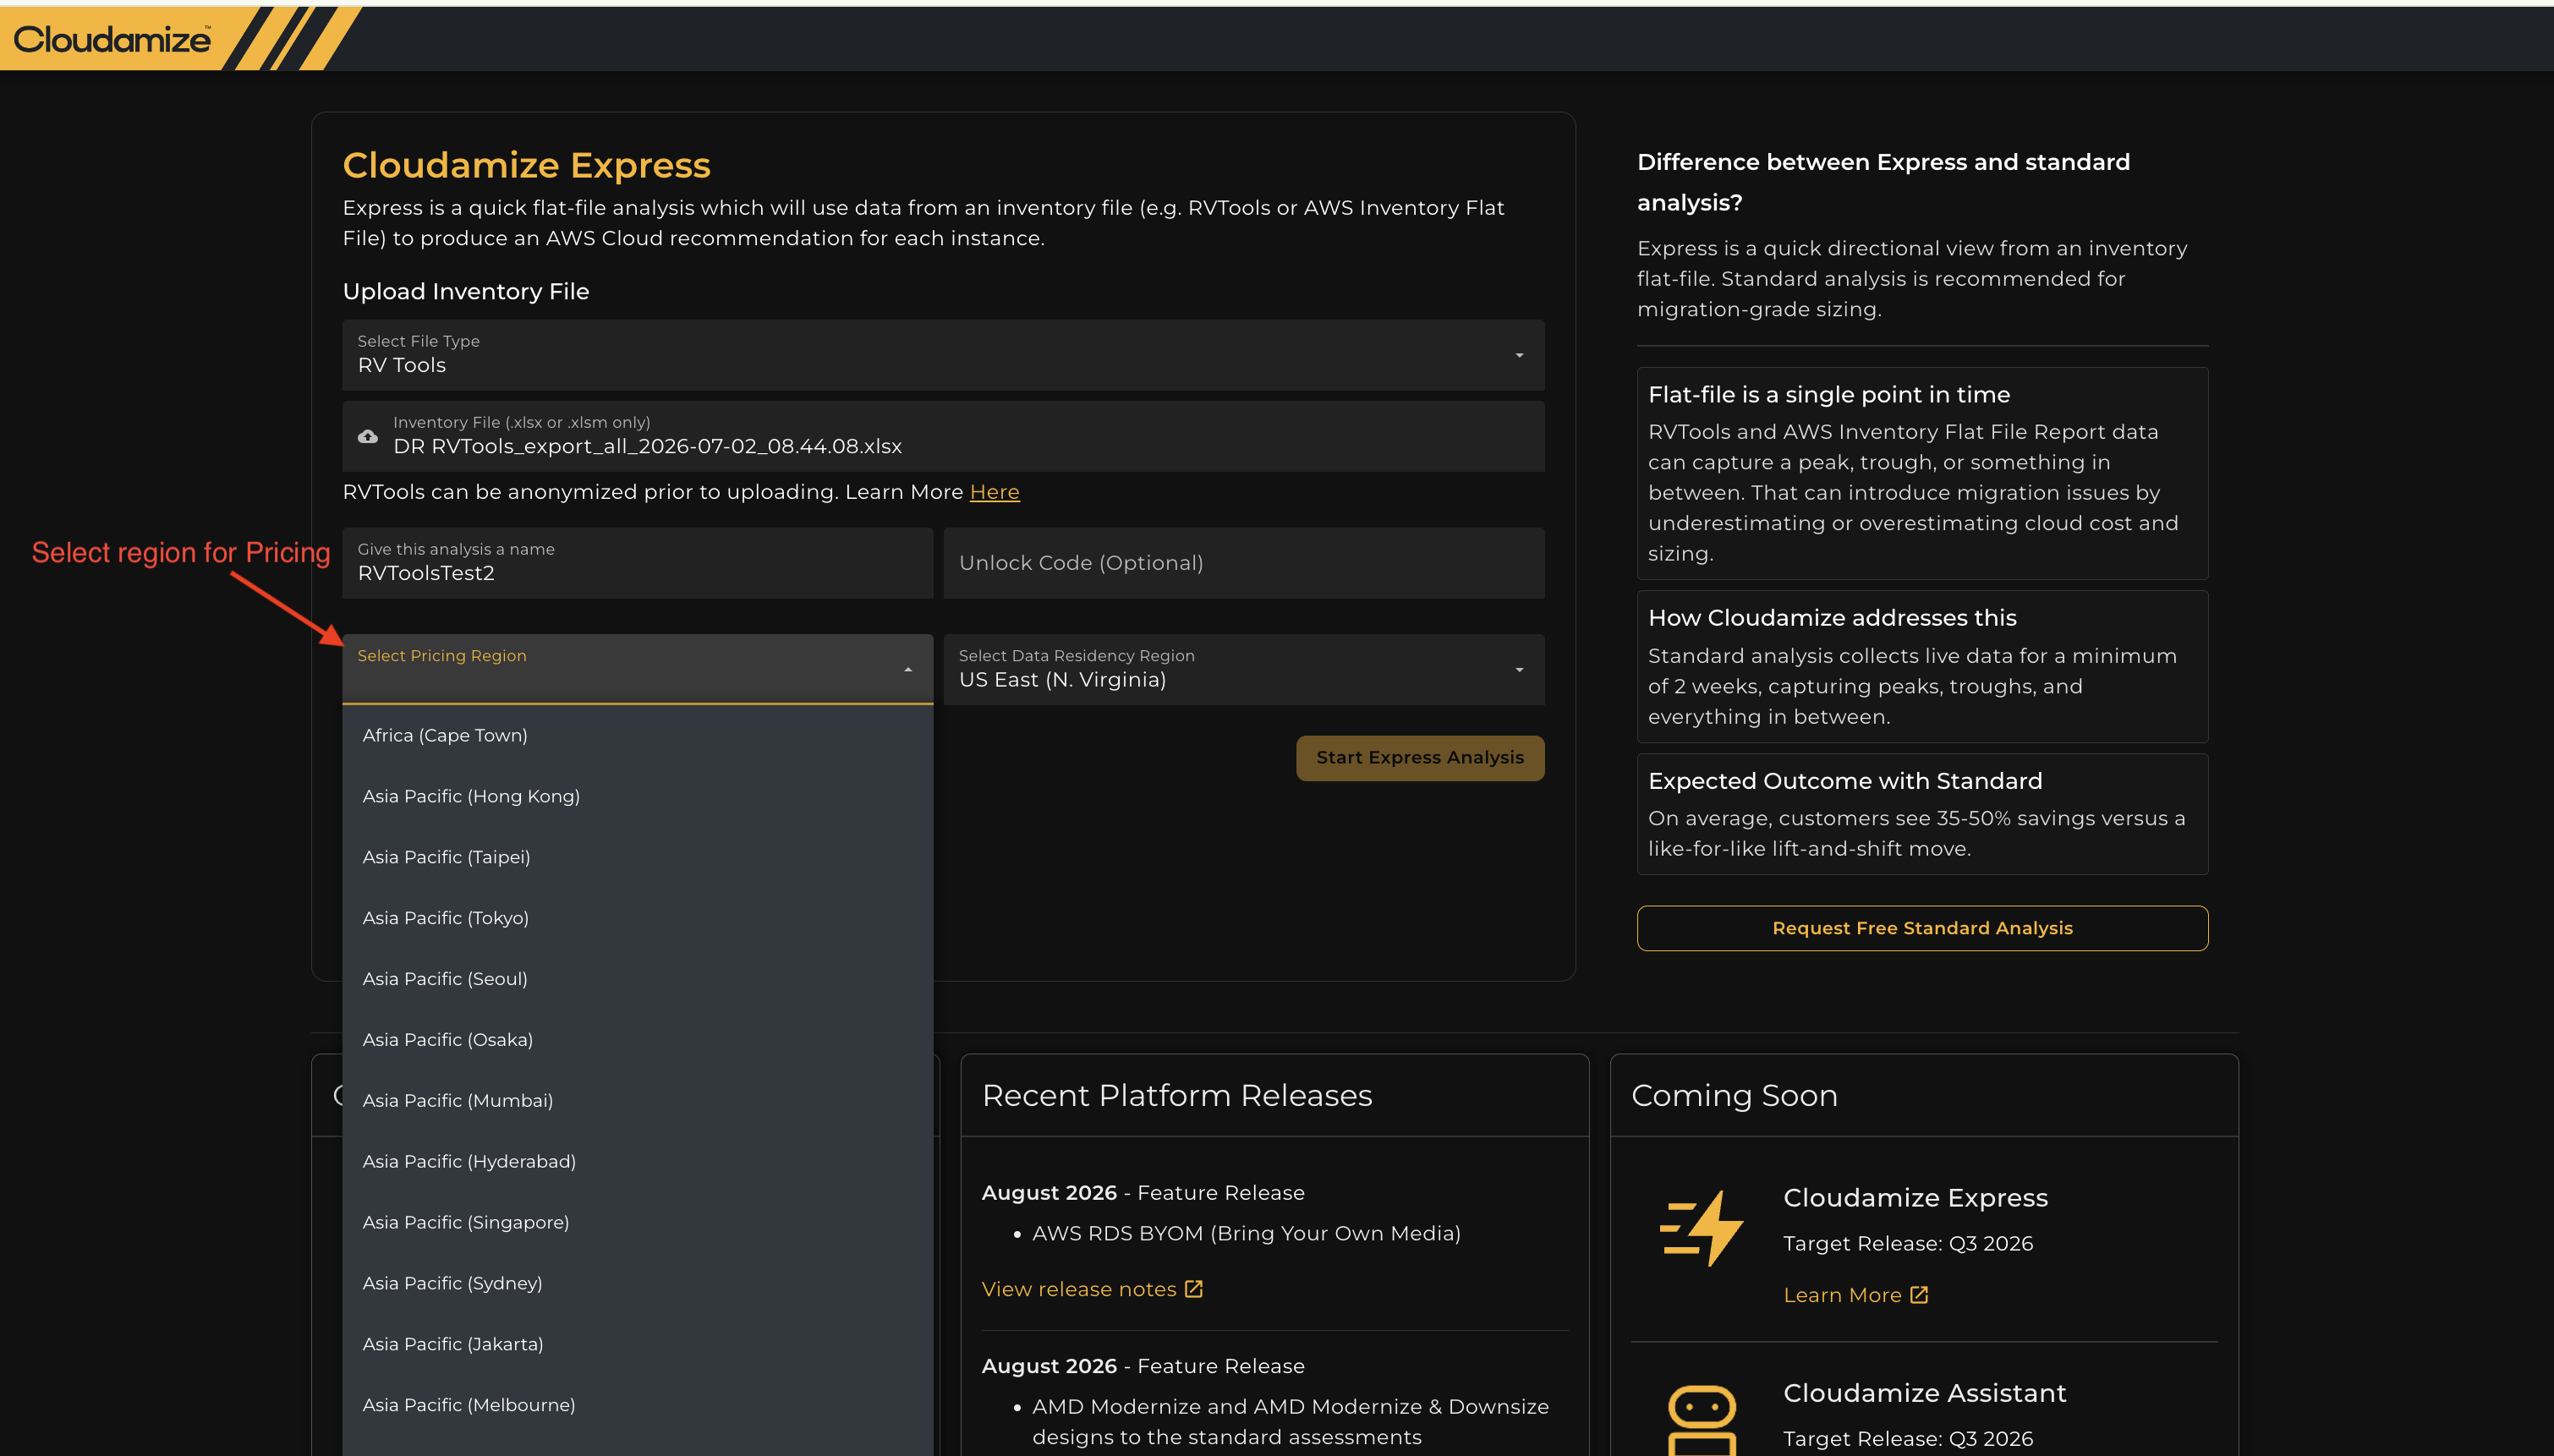
Select Pricing Region
-
Select Data Residency Region: Select your preferred data residency region from the drop-down menu (e.g., US East (N. Virginia)).
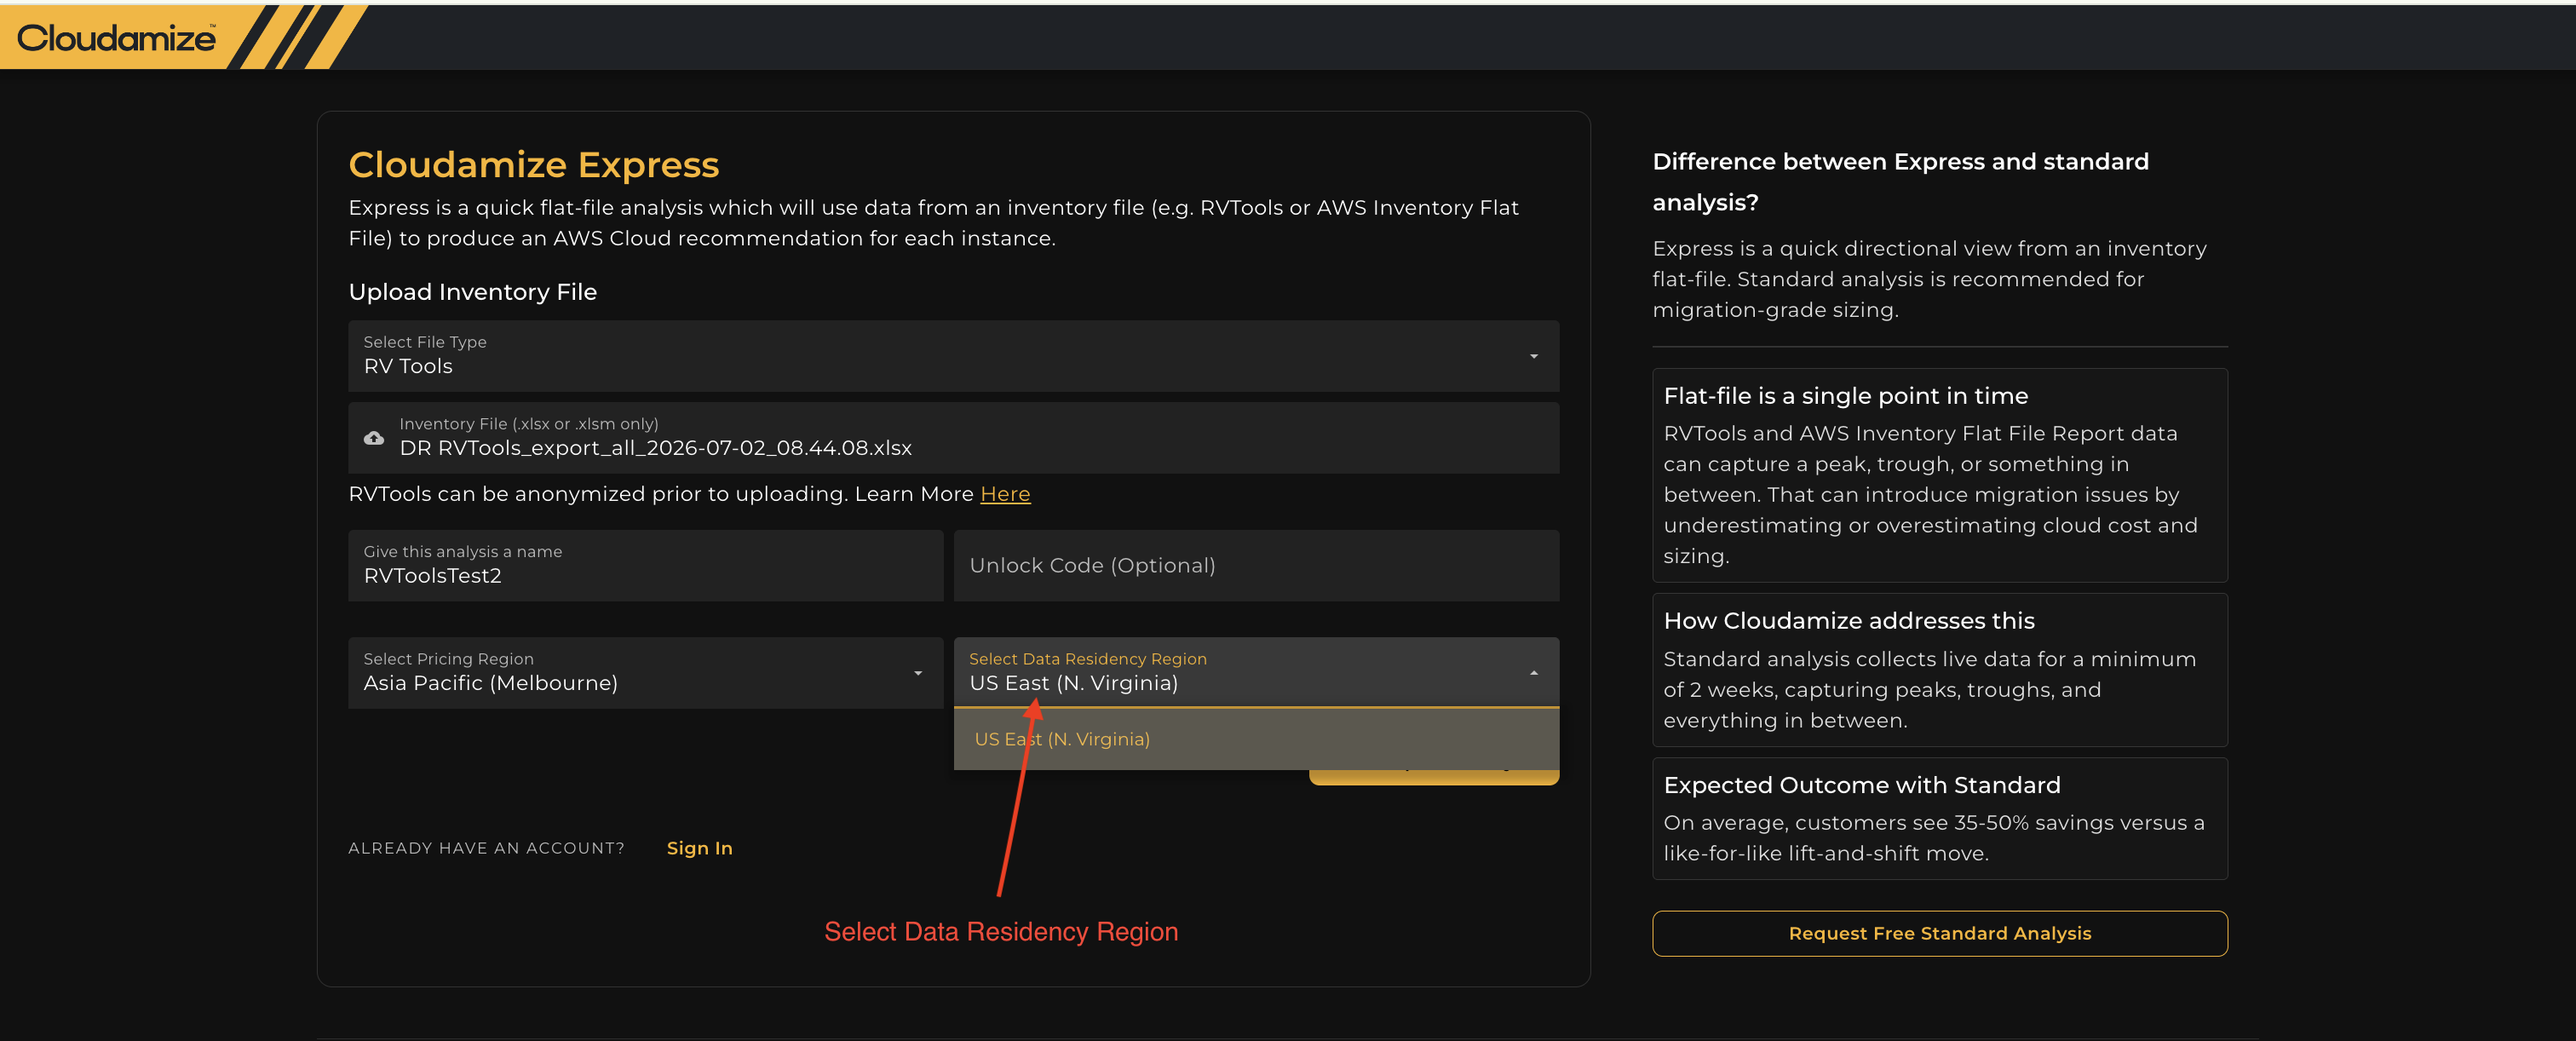
Select Data Residency Region
-
Click Start Express Analysis.
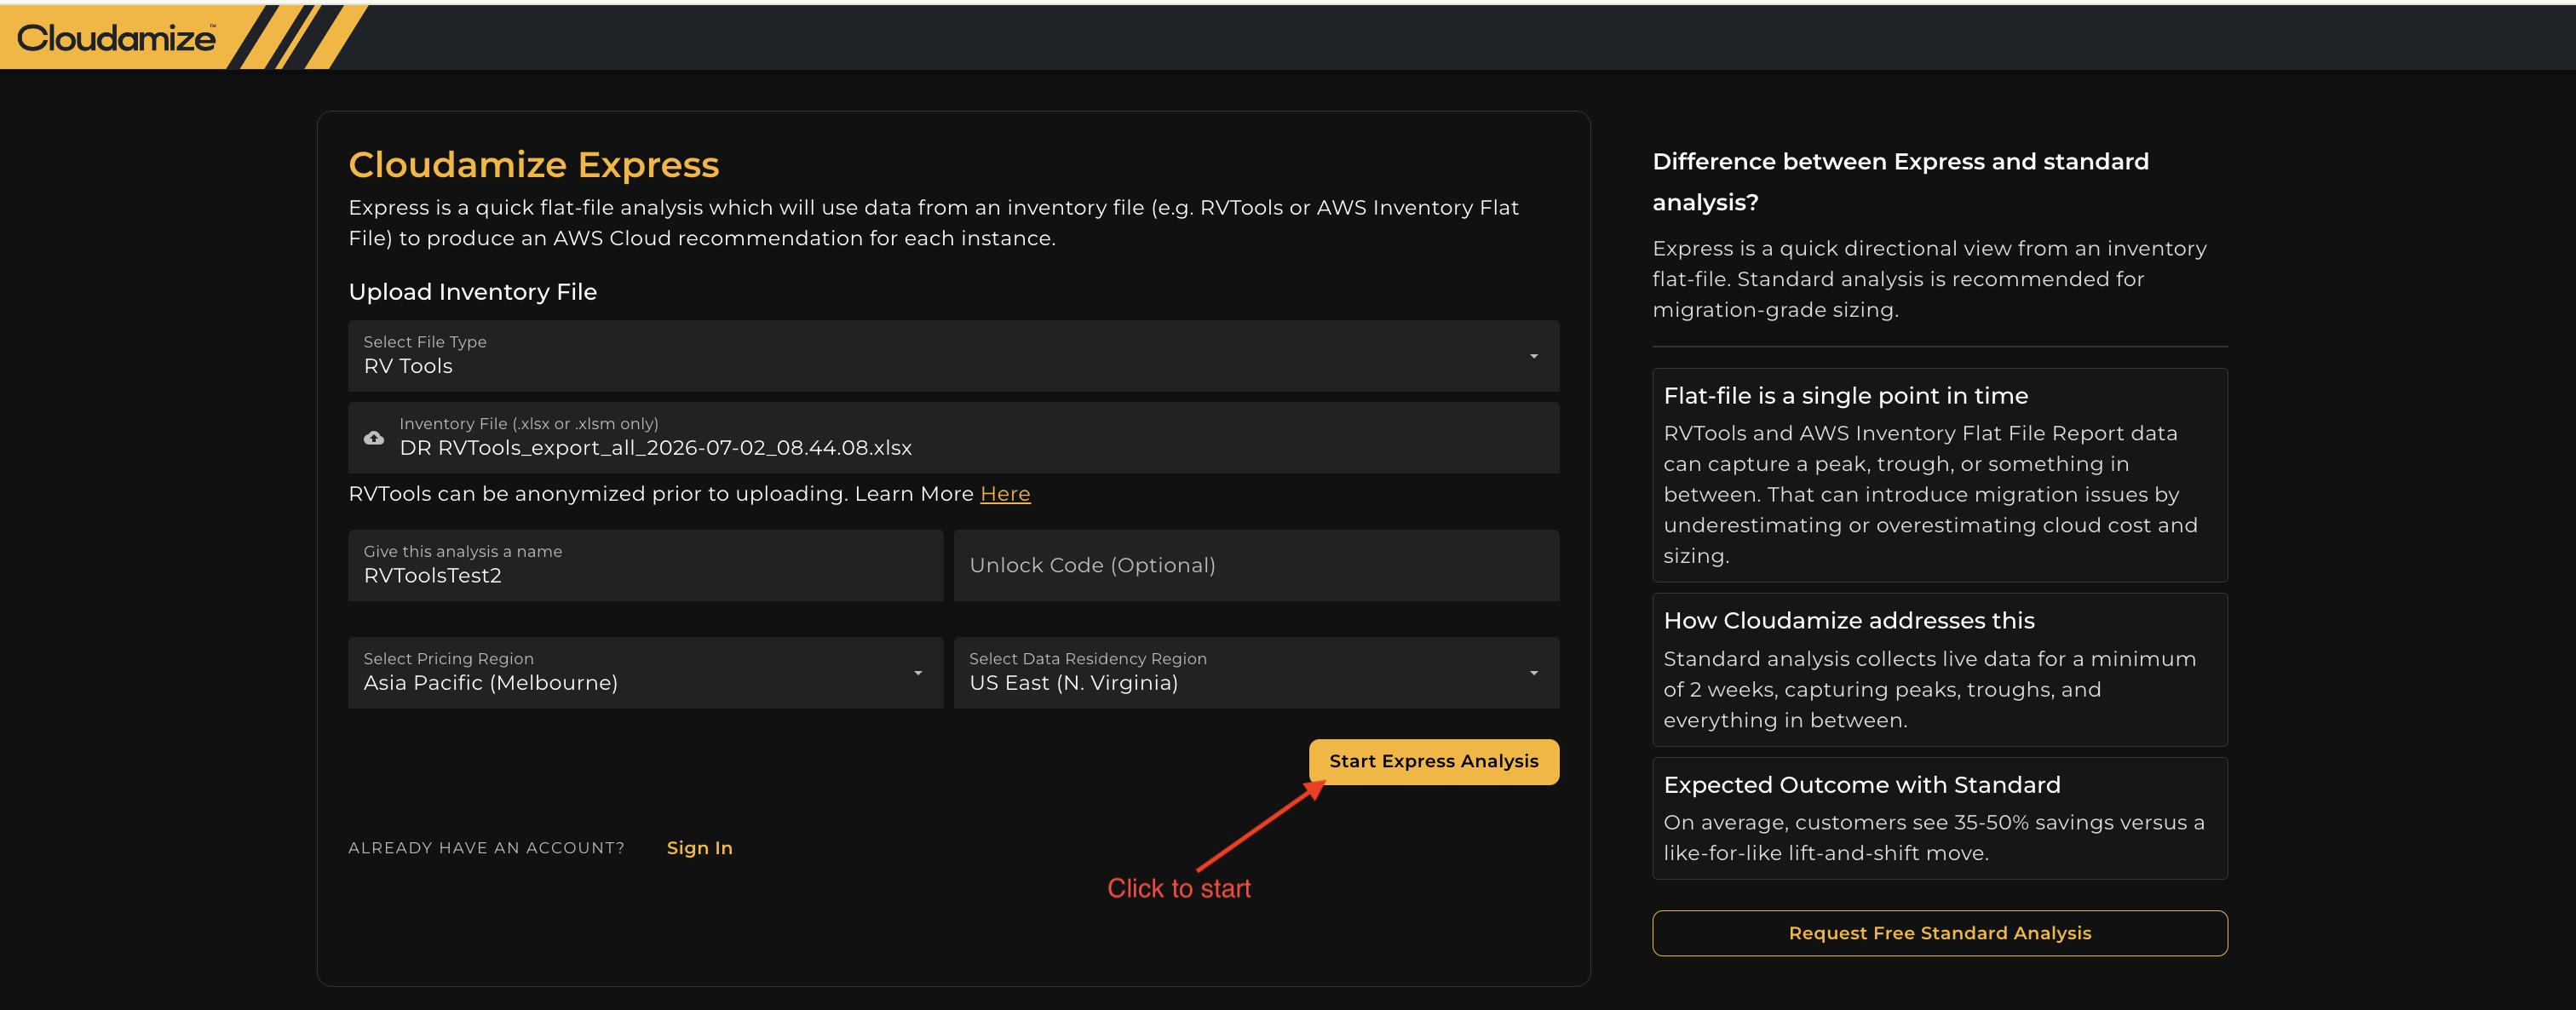
Click to Start
-
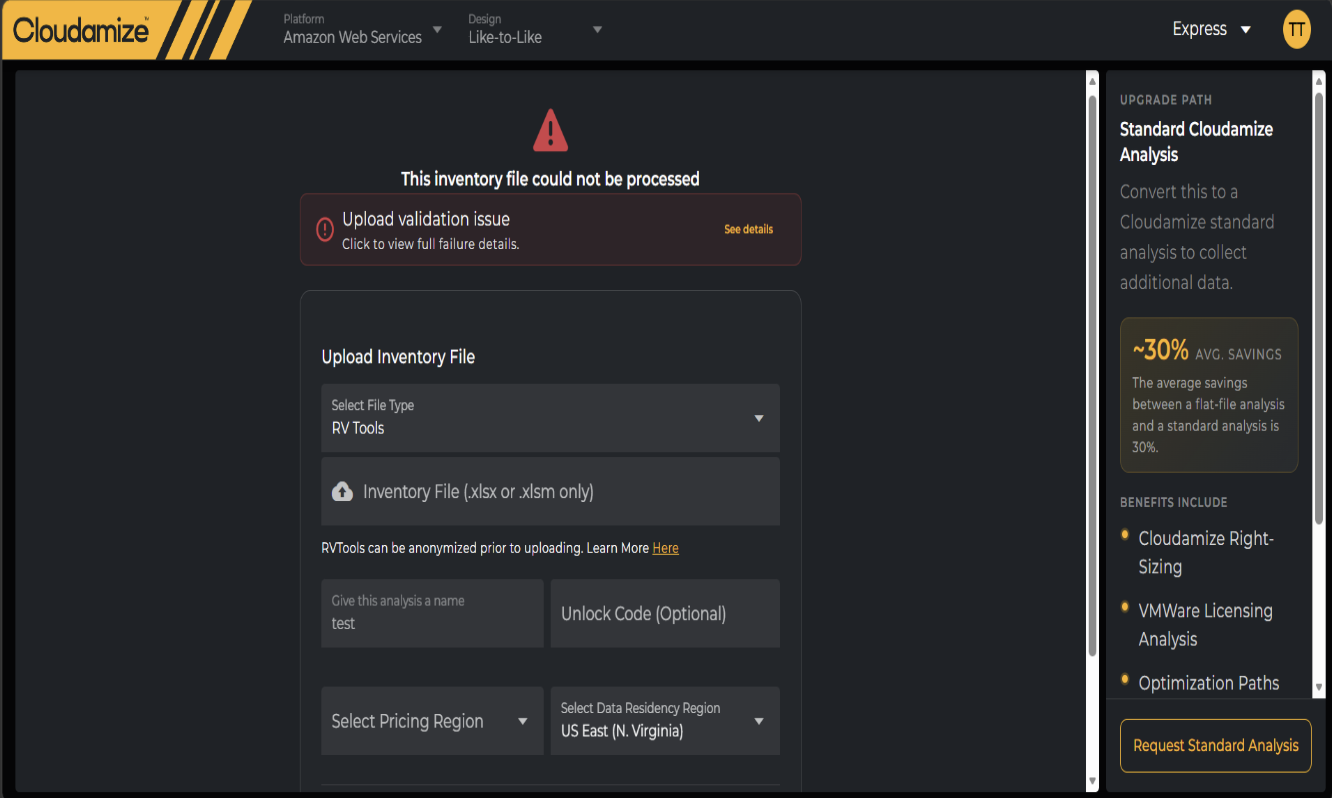
Validation & Error Handling: If the uploaded file contains schema or validation issues, the portal displays an Upload Validation Issue banner. Click See Details to inspect specific line items or formatting errors, resolve them, and re-upload the file.
Step 3: Complete Authentication
-
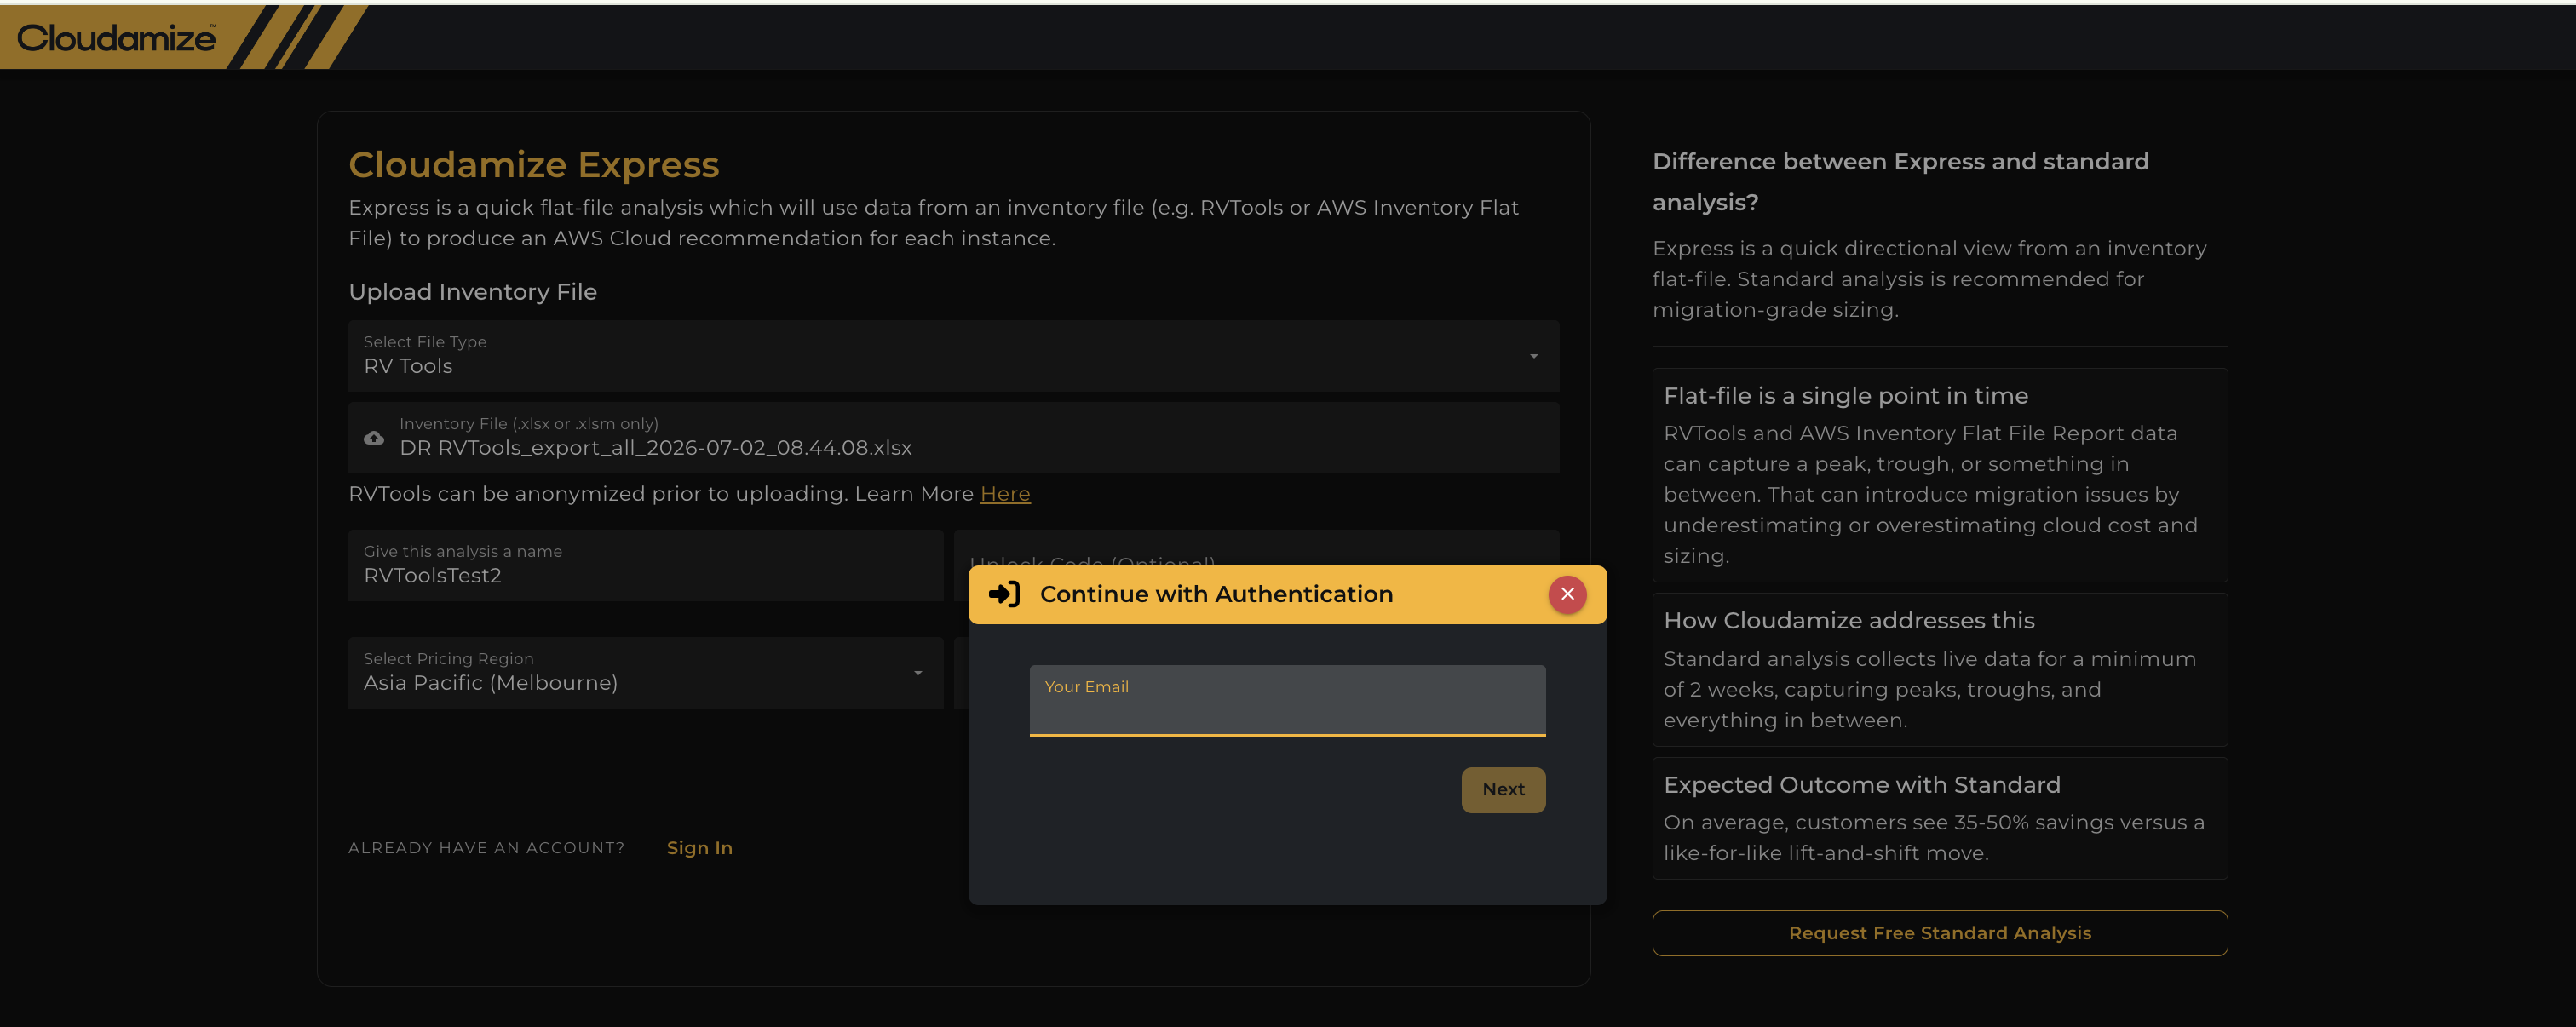
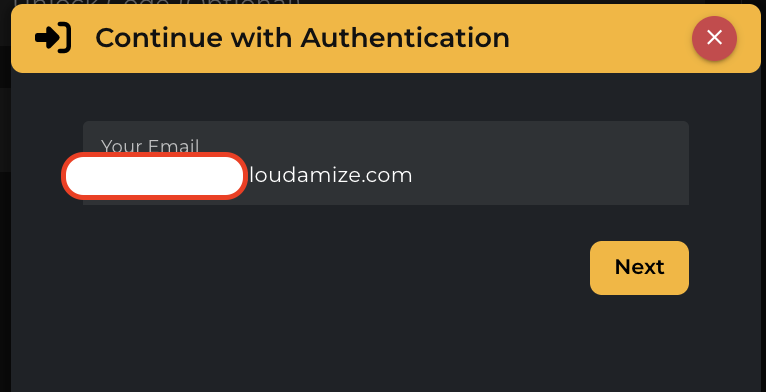
When the Continue with Authentication pop-up modal appears, enter your registered account email address.
-
Click Next to authenticate and launch the automated flat-file analysis.
Note on File Formatting:
Ensure your RVTools export retains its native .xlsx or .xlsm structure. Cloudamize automatically extracts key data from the standard vInfo tab to compute core hardware, storage, and networking requirements.
RVTools Output Design Profiles
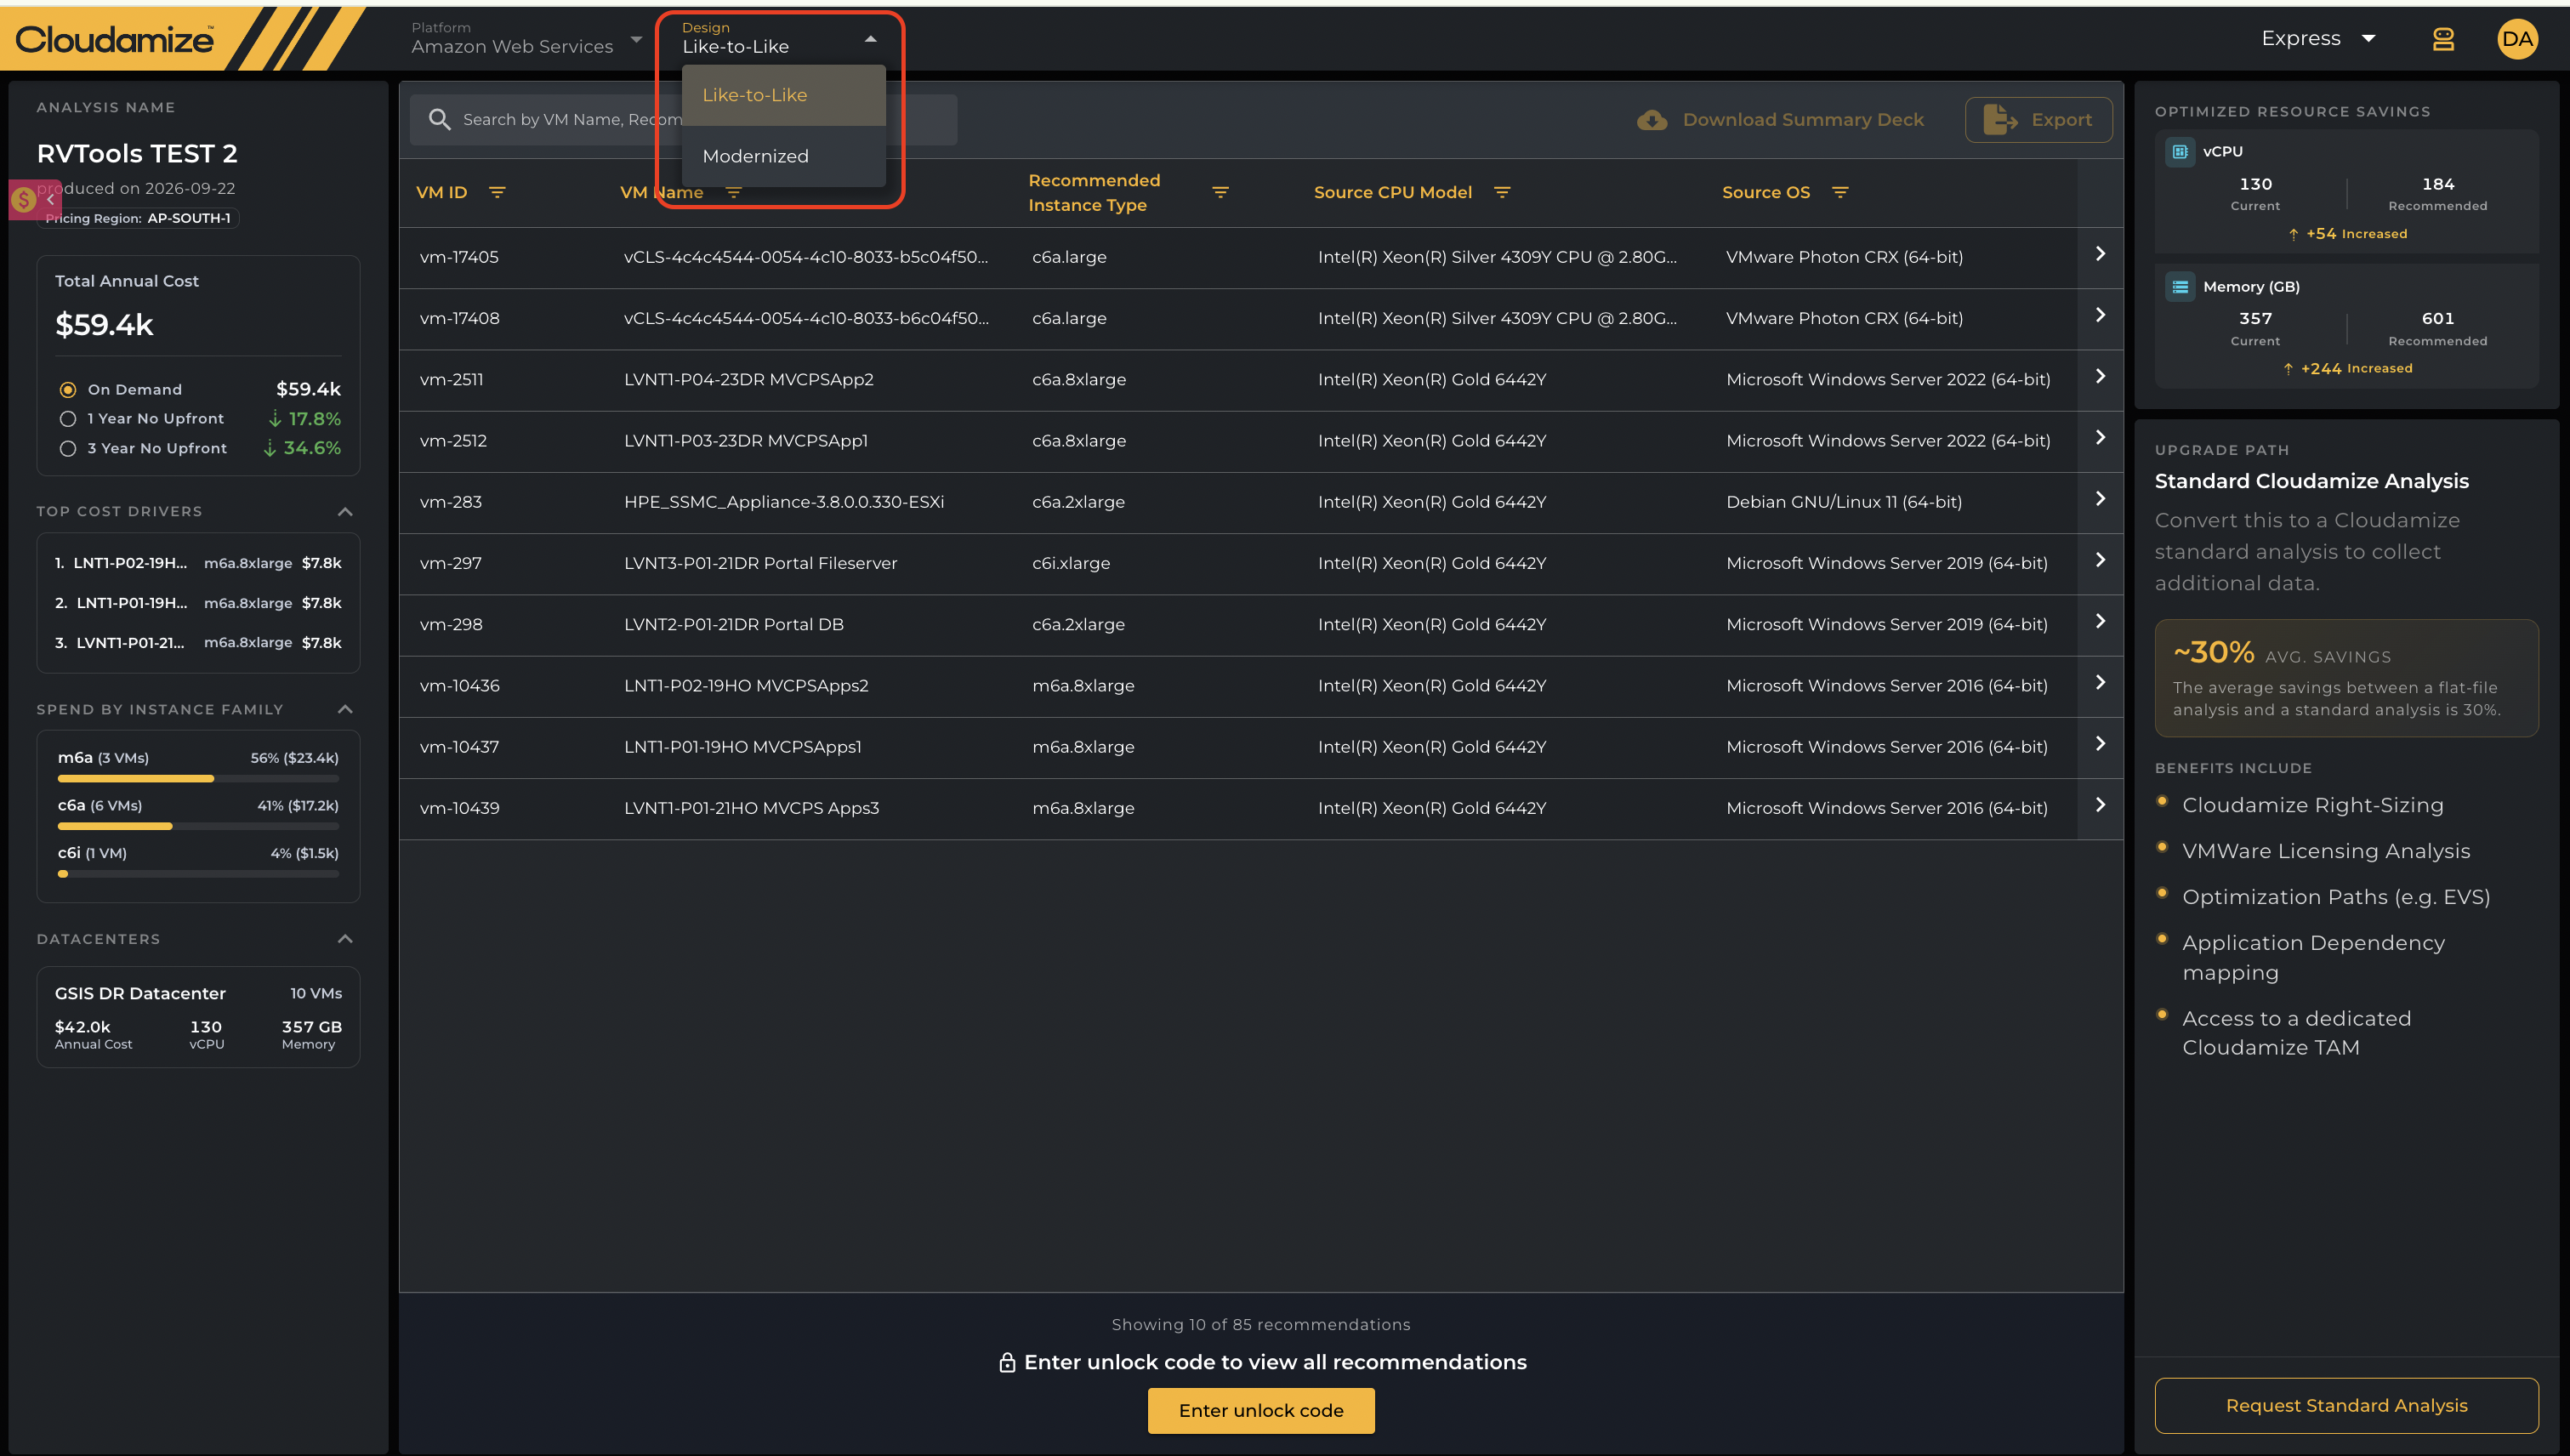
When viewing an ingested RVTools analysis, toggle between design strategies using the top toolbar menu:
1. Like-to-Like Design
-
Strategy: Performs direct 1:1 hardware resource matching based on existing vCPU, RAM, and disk allocations without applying right-sizing rules.
-
What You See On Page:
-
Summary Metrics: Total annual spend, top cost drivers, and spend distribution by instance family.
-
Inventory Table: Displays
VM ID,VM Name,Recommended Instance Type,Source CPU Model, andObserved vCPU Count.
-
-
Export / Report Details: Provides baseline lift-and-shift financial reports and instance mapping inventories for migration budgeting.
2. Modernized Design
-
Strategy: Evaluates source host hardware specs (e.g., Intel Xeon generations) and maps workloads to cost-optimized, next-generation cloud instance families (e.g., AWS
m6a,c6aseries). -
What You See On Page: Updated instance recommendations, dynamic resource-saving indicators (vCPU/Memory optimization metrics), and reduced annual spend totals.
-
Export / Report Details: Includes architecture upgrade paths, VMware licensing impact assessments, and node-level cost optimization summaries.
Advanced Optimizations (Modernized Design Track)
When using the Modernized design track, two additional optimization toggles appear under the Optimizations section on the left panel:
-
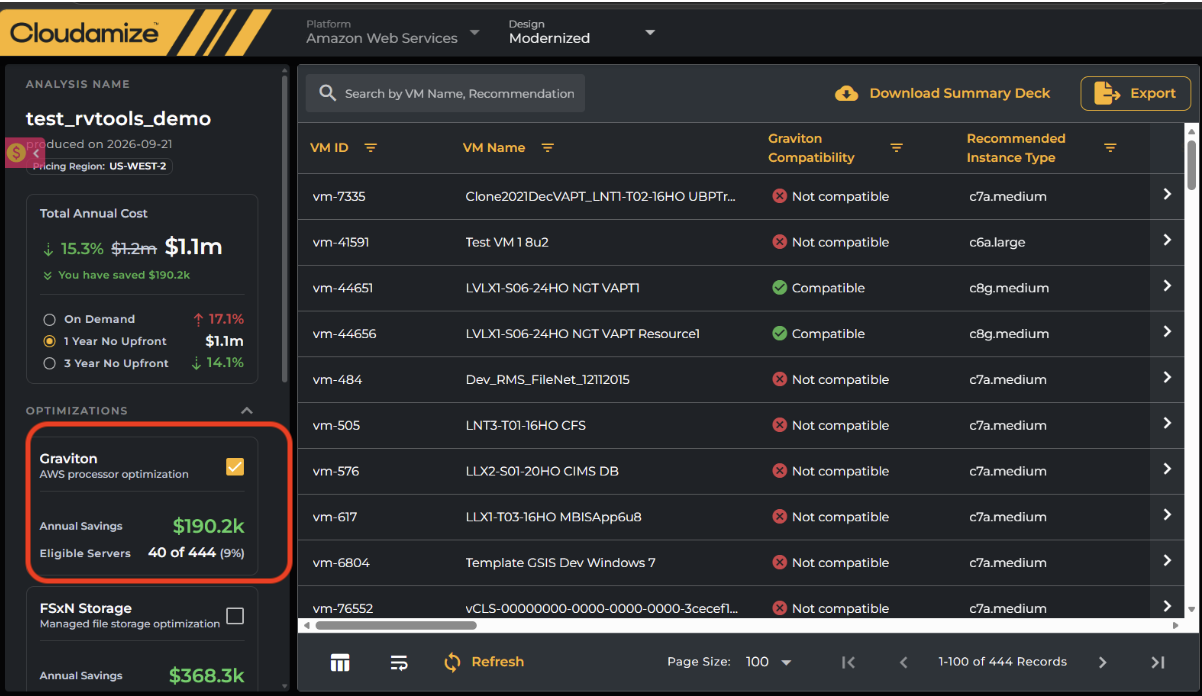
Graviton Processor Optimization:
-
Check the Graviton toggle to evaluate ARM-based AWS Graviton processor compatibility across eligible Linux/open-source workloads.
-
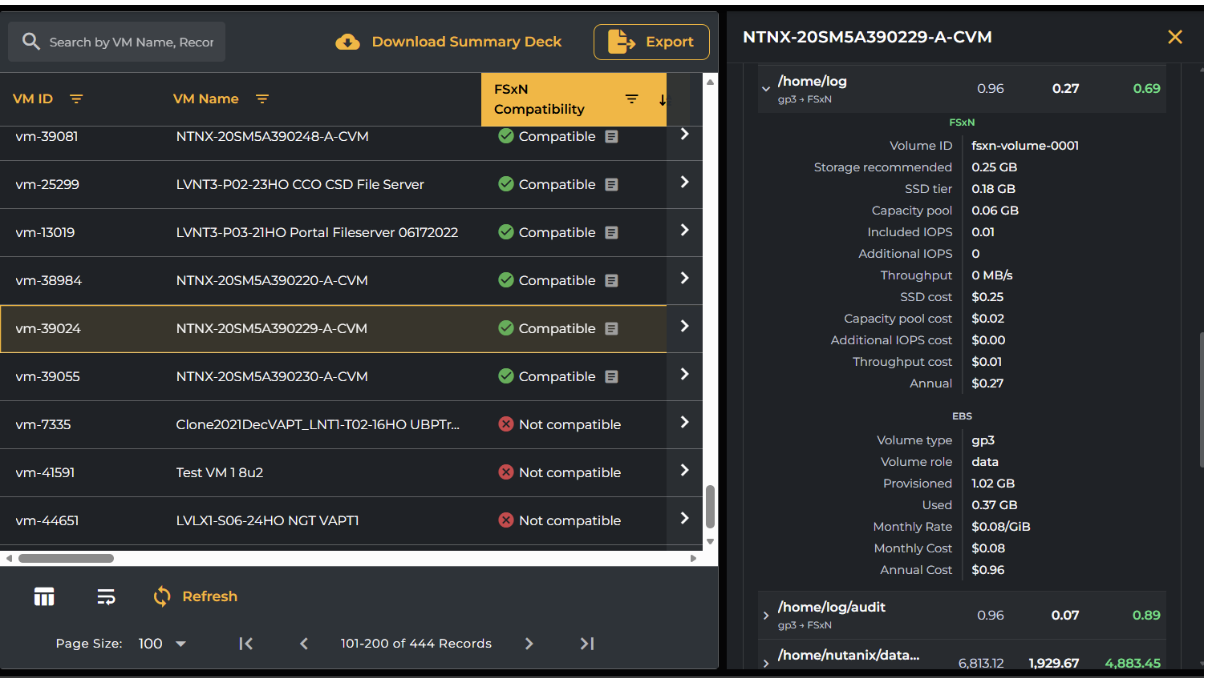
The main grid surfaces a Graviton Compatibility column showing Compatible or Not Compatible status badges. Eligible machines are mapped to Graviton instances (e.g.,
c8g.medium). -
Displays eligible server counts and projected annual savings.
-
-
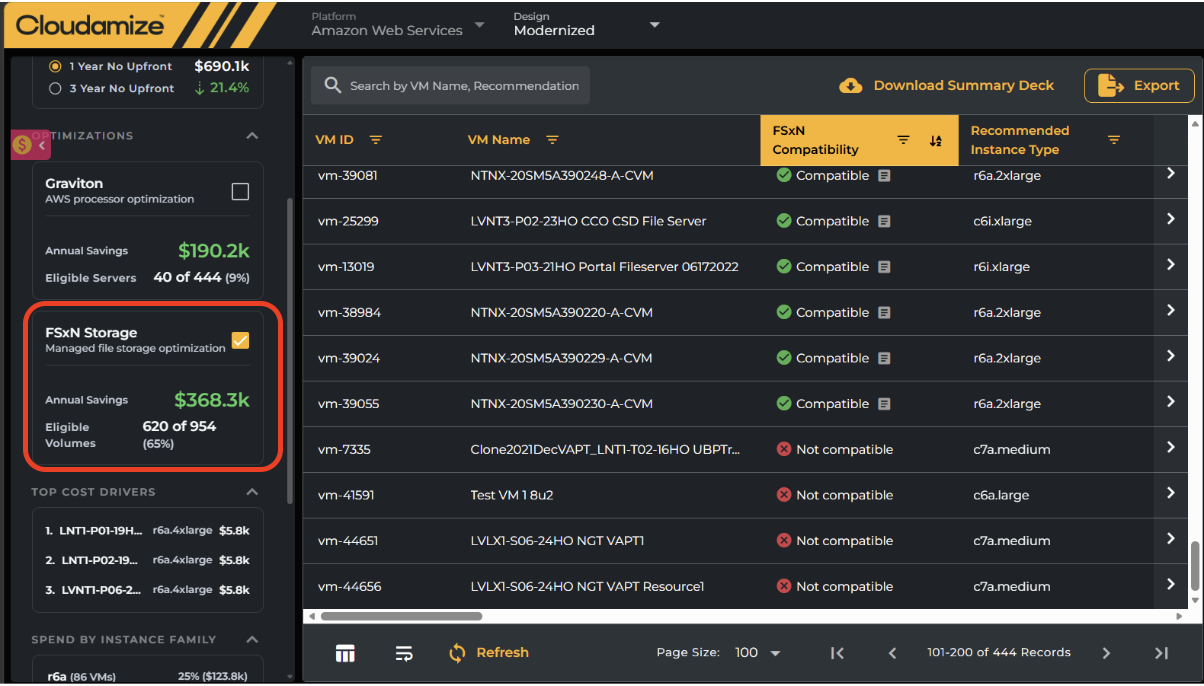
FSx for NetApp ONTAP (FSxN) Storage Optimization:
-
Check the FSxN Storage toggle to evaluate shared file system volumes for AWS FSx for NetApp ONTAP deployment.
-
The main grid displays an FSxN Compatibility column highlighting eligible volumes.
-
Displays eligible volume counts and annual storage savings compared to standard Amazon EBS deployments.
-
Financial Tracking & Commitment Pricing (Left Panel)
The left control panel provides financial metrics and breakdowns across your estate:
Commitment Pricing Options & Savings Toggles
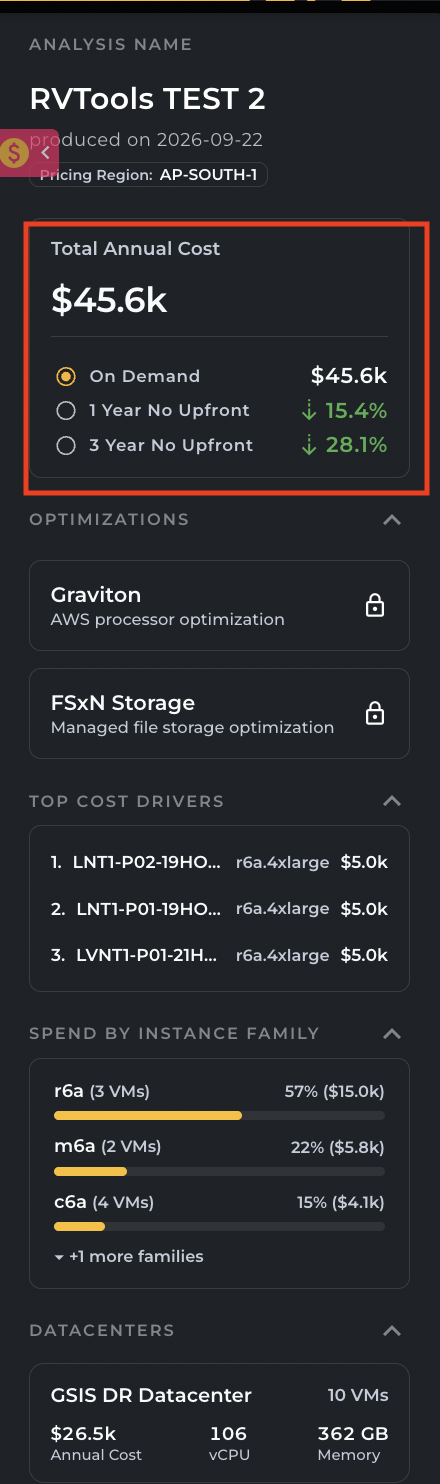
The left panel allows you to compare payment models to evaluate long-term financial impact dynamically:
-
On Demand: Represents the baseline annual cost when running workloads with full flexibility and no contractual commitments.
-
1 Year No Upfront: Reflects the immediate cost reduction achieved by committing to a 1-year AWS Savings Plan or Reserved Instance model without requiring an initial cash outlay.
-
3 Year No Upfront: Unlocks maximum financial efficiency, reducing your annual spend significantly by opting for a 3-year term commitment with zero upfront costs.
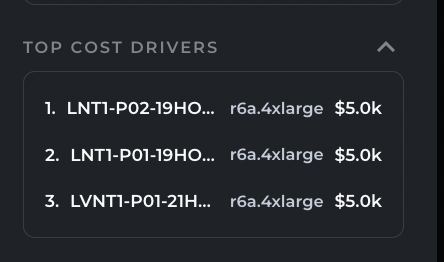
Top Cost Drivers: Automatically highlights the highest-cost virtual machine instances.
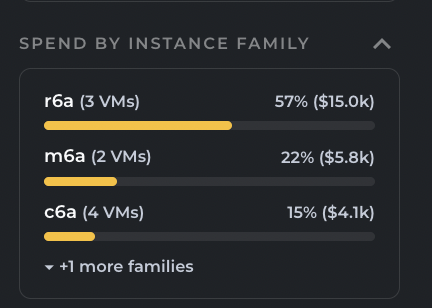
Spend by Instance Family: Displays a percentage breakdown of recommended AWS instance families (e.g., c6a, m6a, r6a).
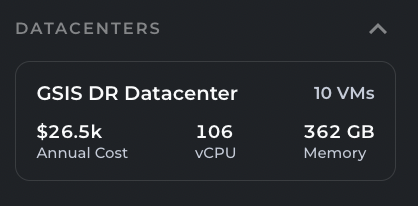
Datacenters Summary: Summarizes VM counts, total vCPUs, memory, and annual cost broken down by source vCenter datacenter.
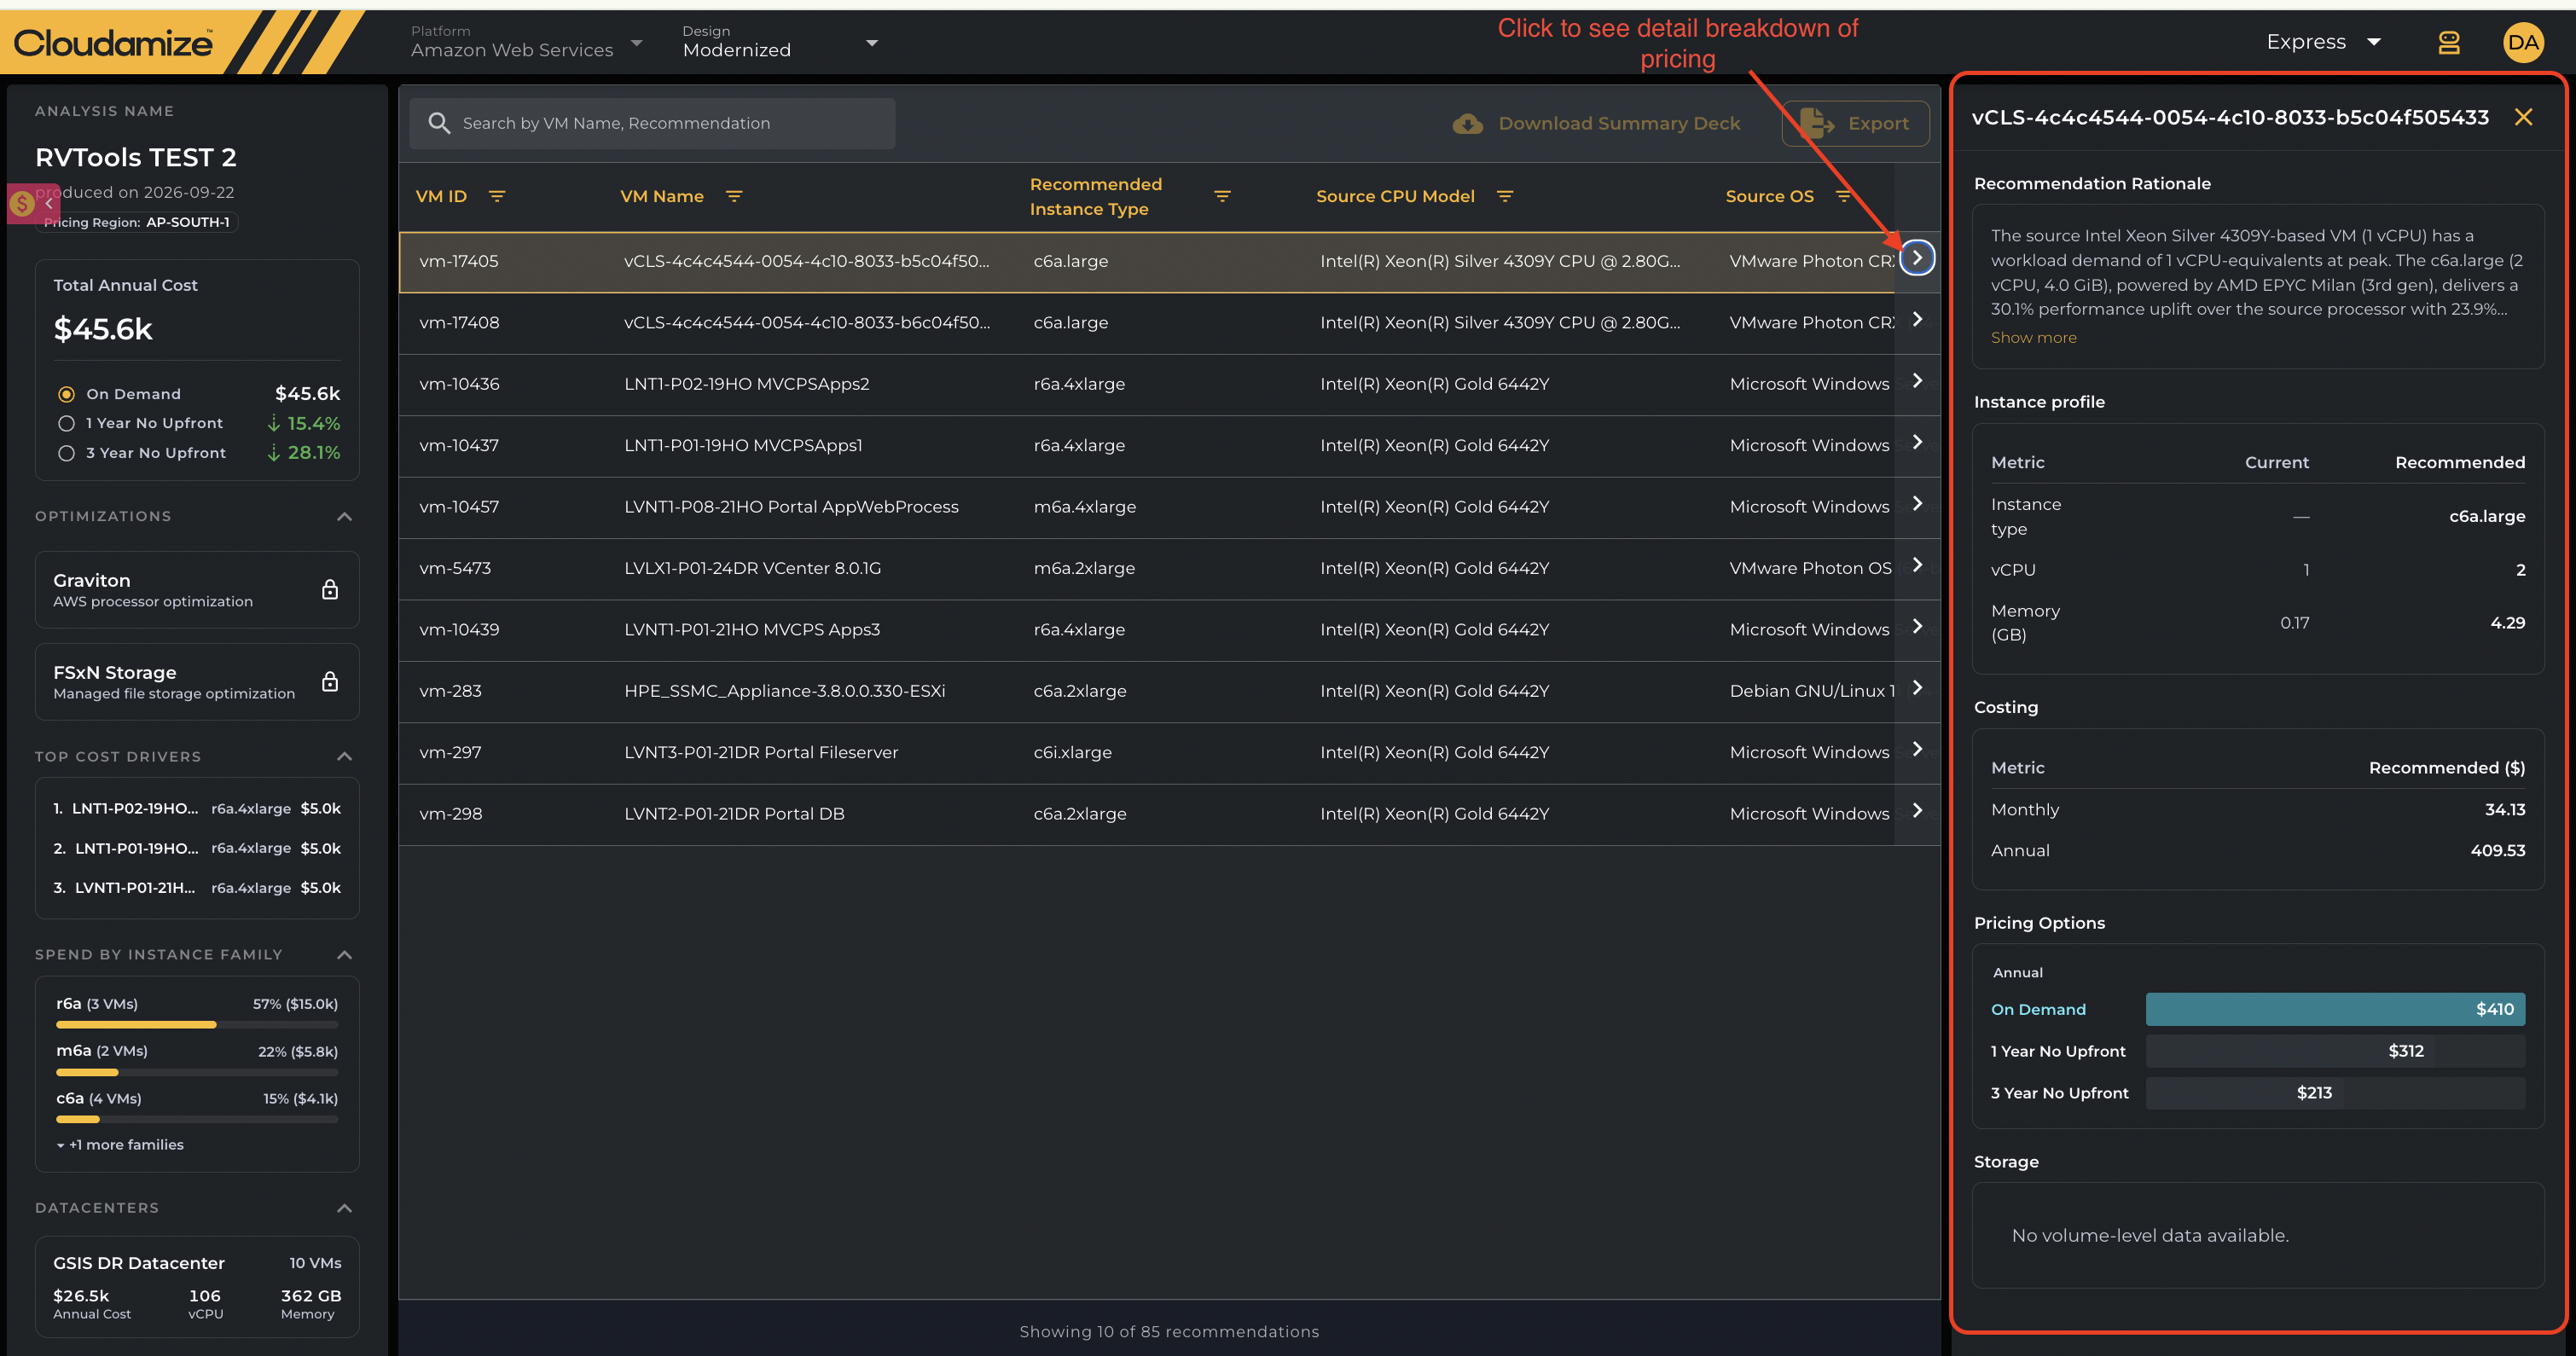
Granular Node & Disk Inspection (Right-Hand Panel)
Single-clicking any VM row in the recommendation grid opens a detailed inspection drawer:
-
Recommendation Rationale: Explains why a specific AWS instance type was chosen, detailing source CPU specs, peak demand, target instance generation, and performance uplift percentages.
-
Costing & Pricing Options: Itemizes monthly and annual costs across On Demand, 1 Year No Upfront, and 3 Year No Upfront commitments.
-
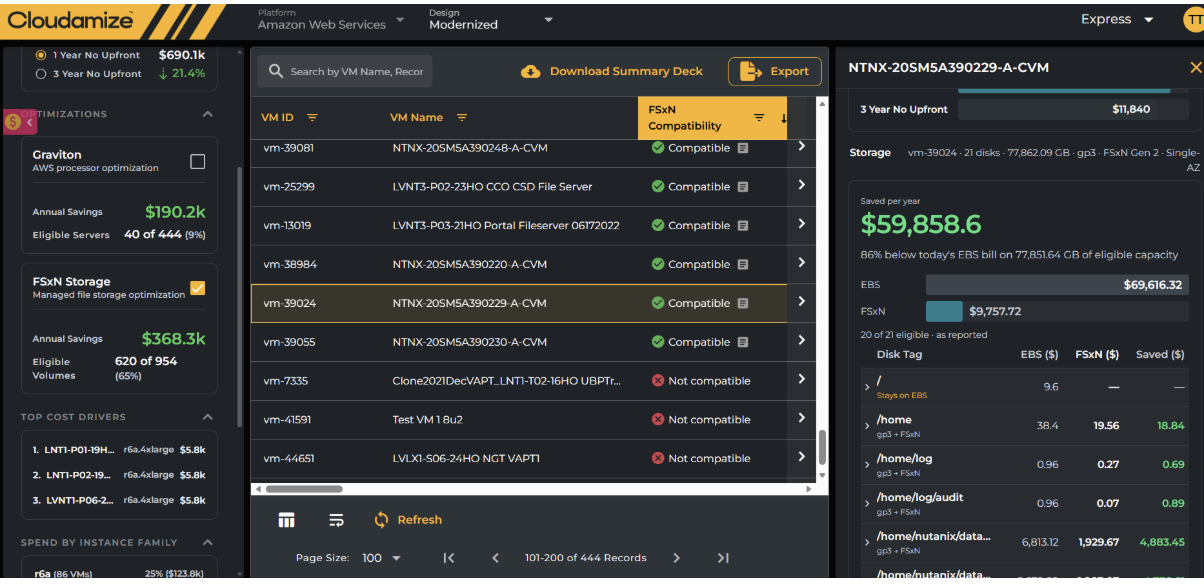
Disk-Wise Storage Breakdown (EBS vs. FSxN):
-
Compares total EBS storage costs against FSxN costs for eligible volumes.
-
Displays disk-level metrics including disk tags, mount paths, provisioned capacity, recommended storage, capacity pool allocations, throughput, and individual monthly/annual cost deltas.
-
2. Creating an Express Assessment (Existing Account Users)
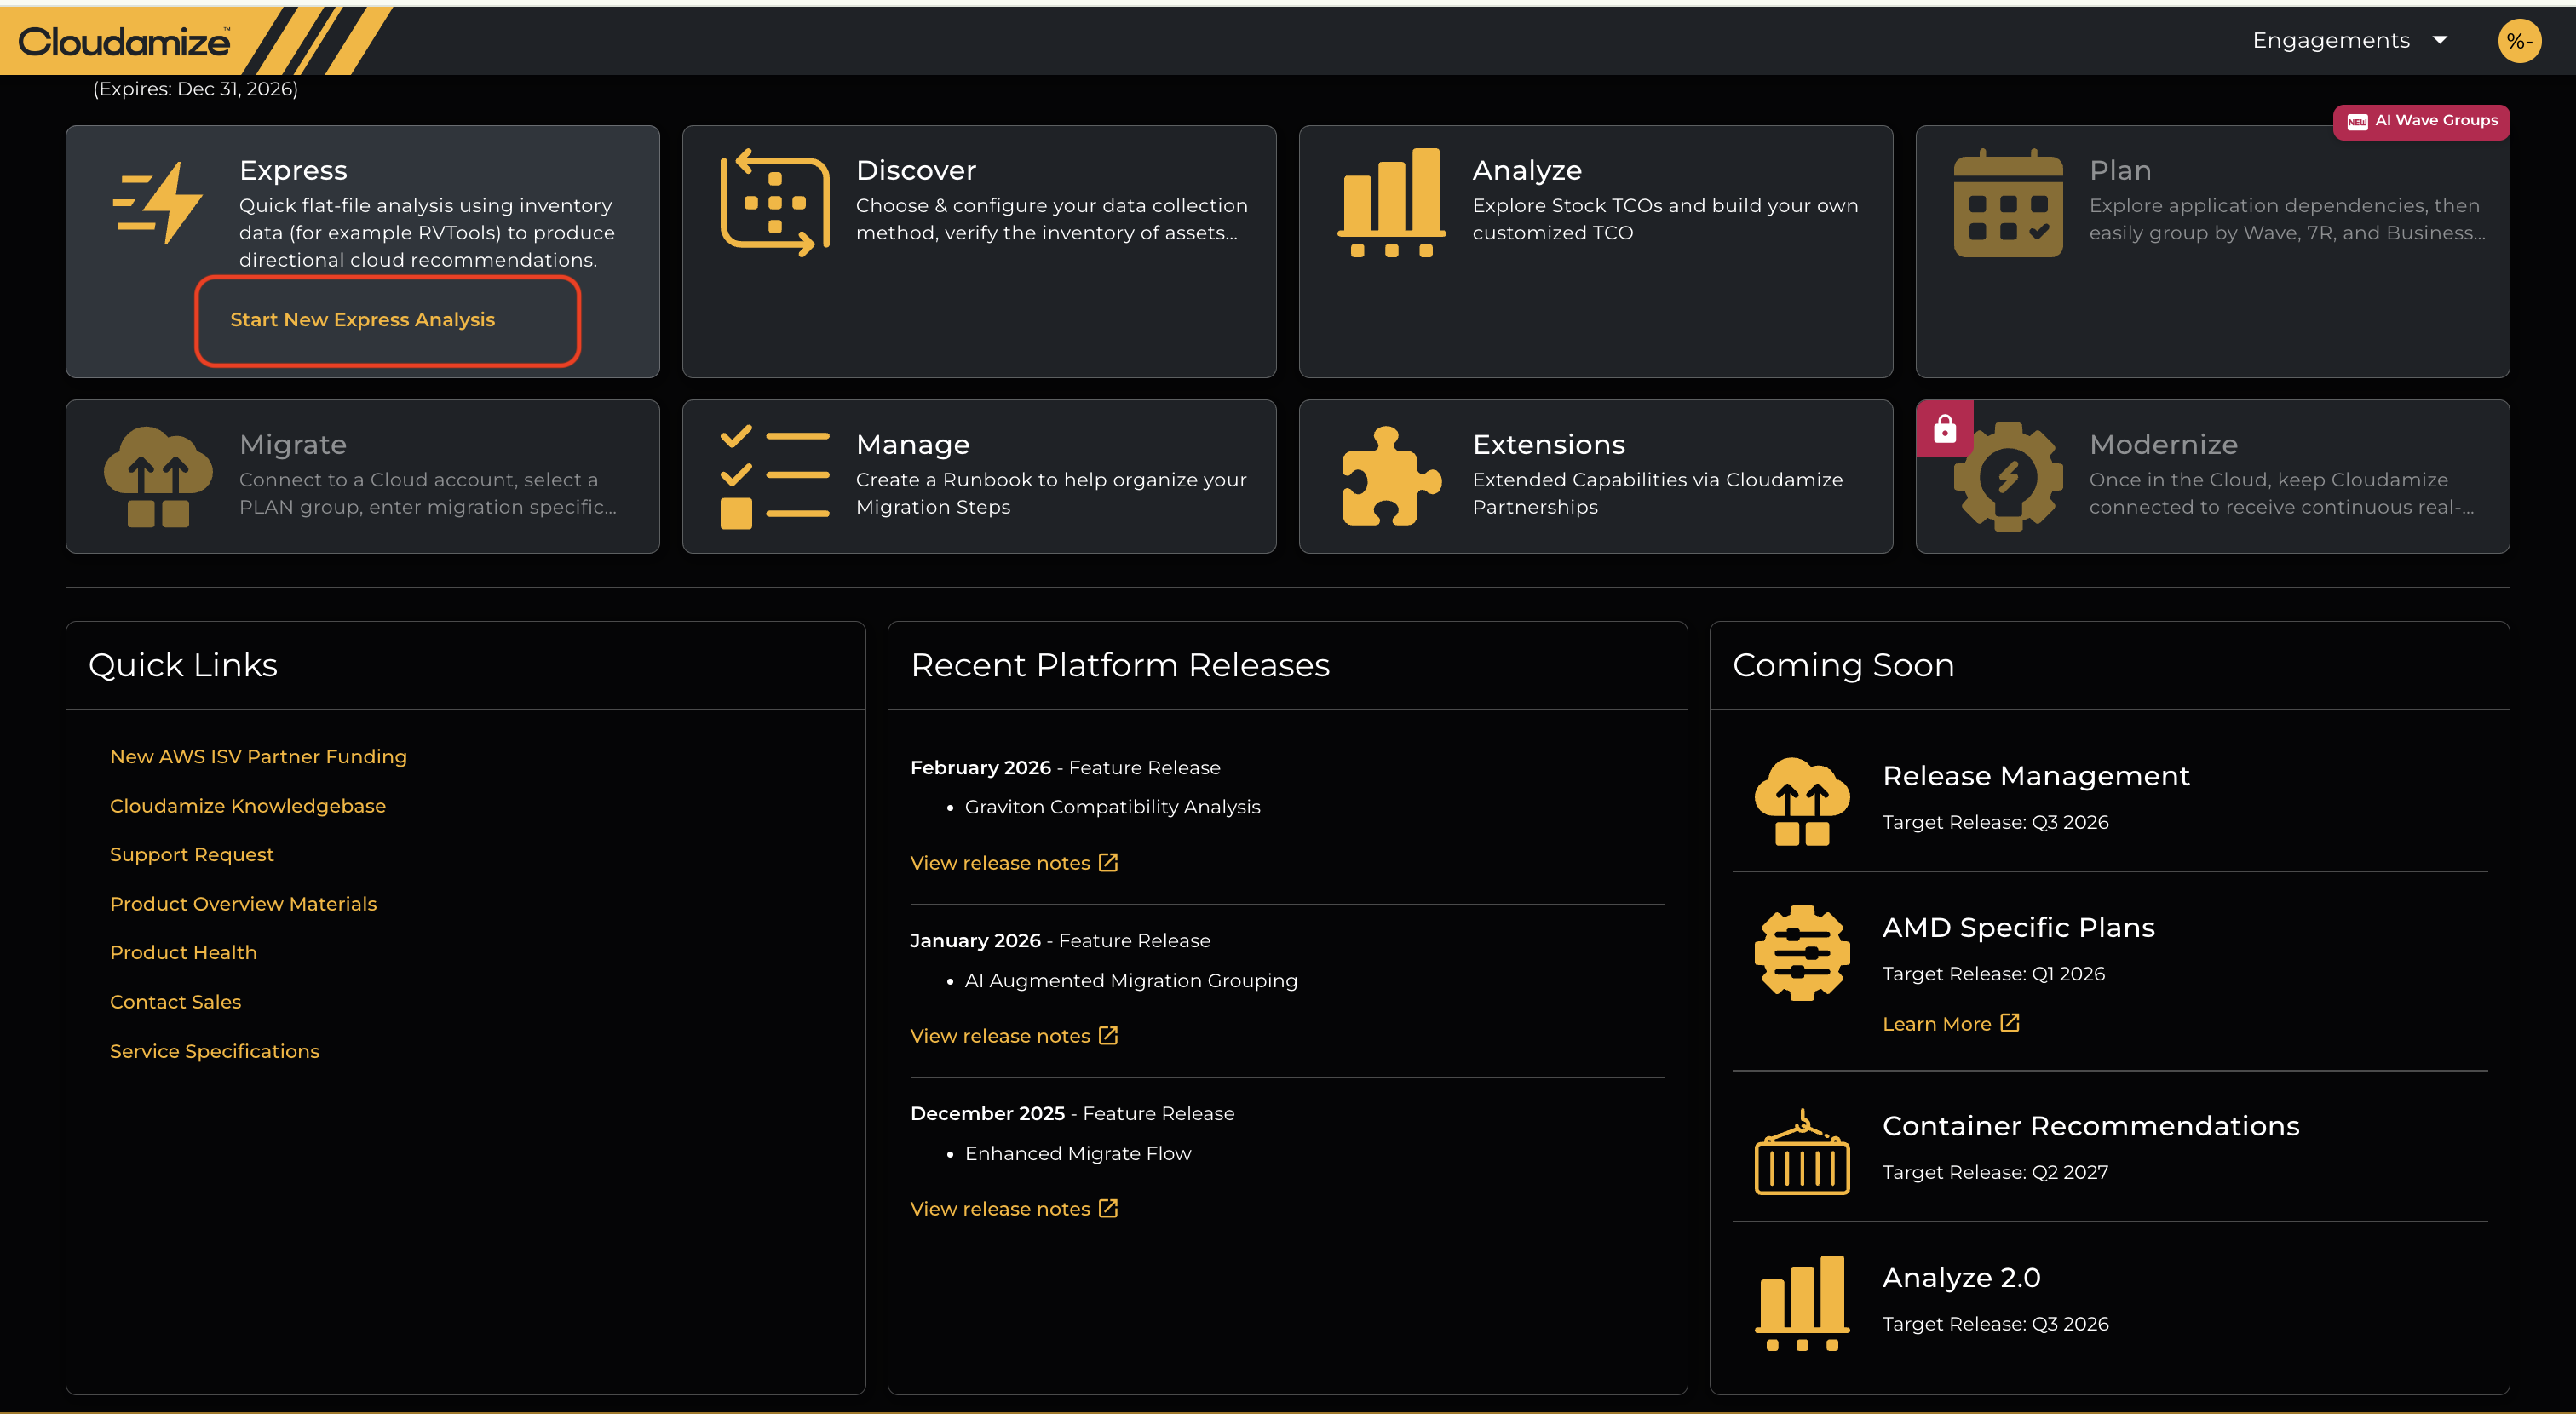
Existing Cloudamize users can launch a new Express assessment directly from within their portal workspace without creating a new account. You can initiate this workflow from either of the following locations:
-
Location A: From the Home Dashboard Hub: Log in to your account, locate the Express module card on the central dashboard hub, and click the yellow Start New Express Analysis button inside the tile
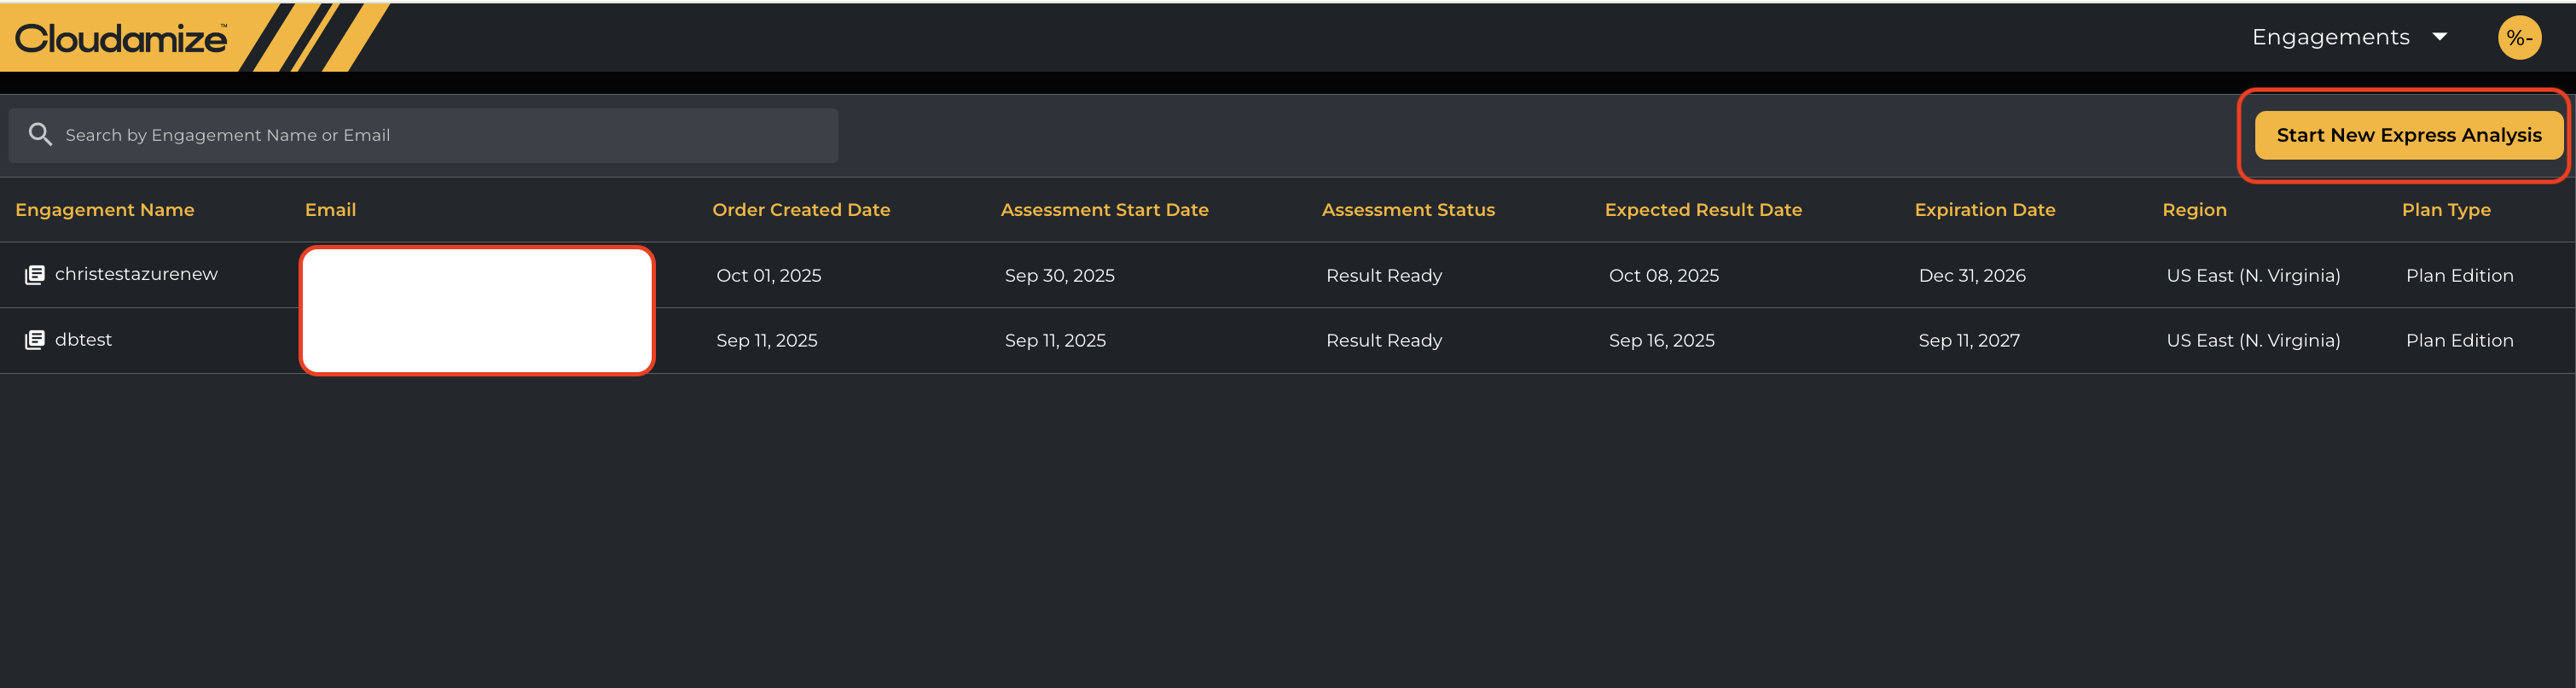
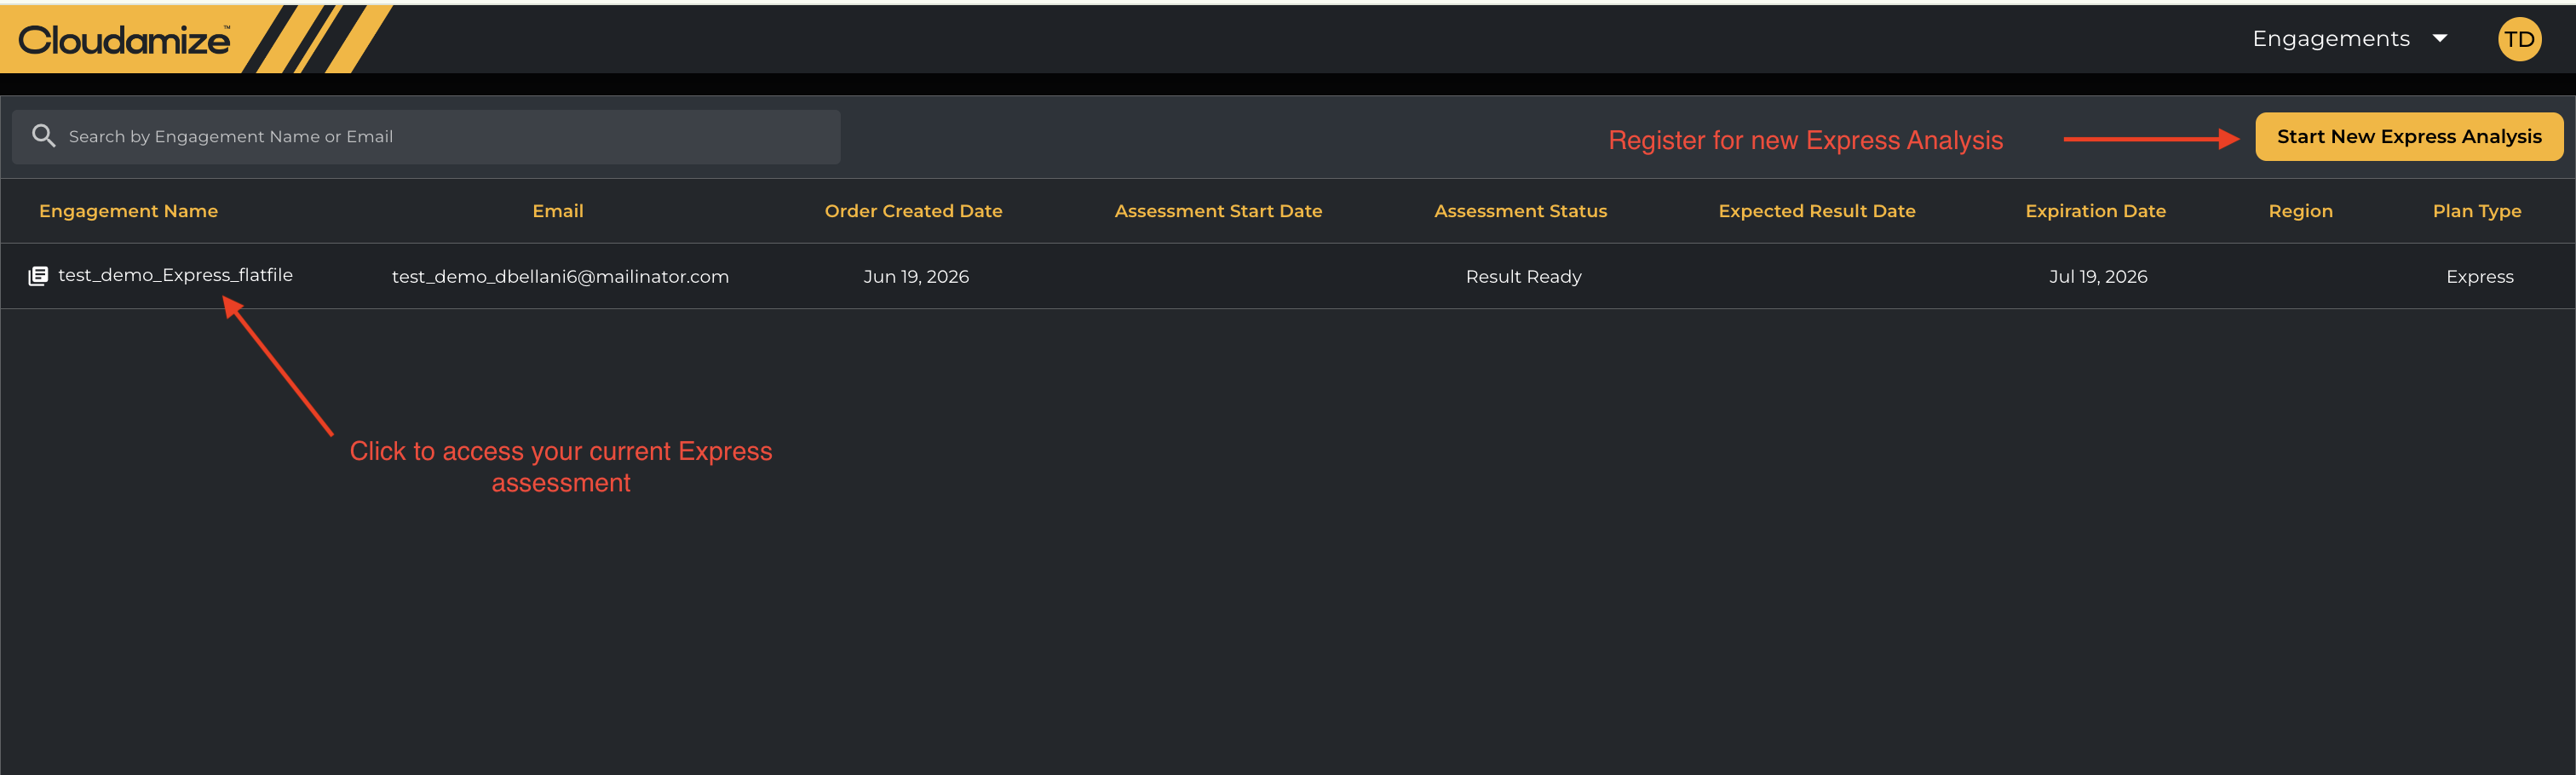
Location B: From the Engagements Dashboard: Navigate to the Engagements management view (selectable from the top header dropdown). Located above the engagements list table on the right-hand side, click the yellow Start New Express Analysis button
Upload Configuration Steps
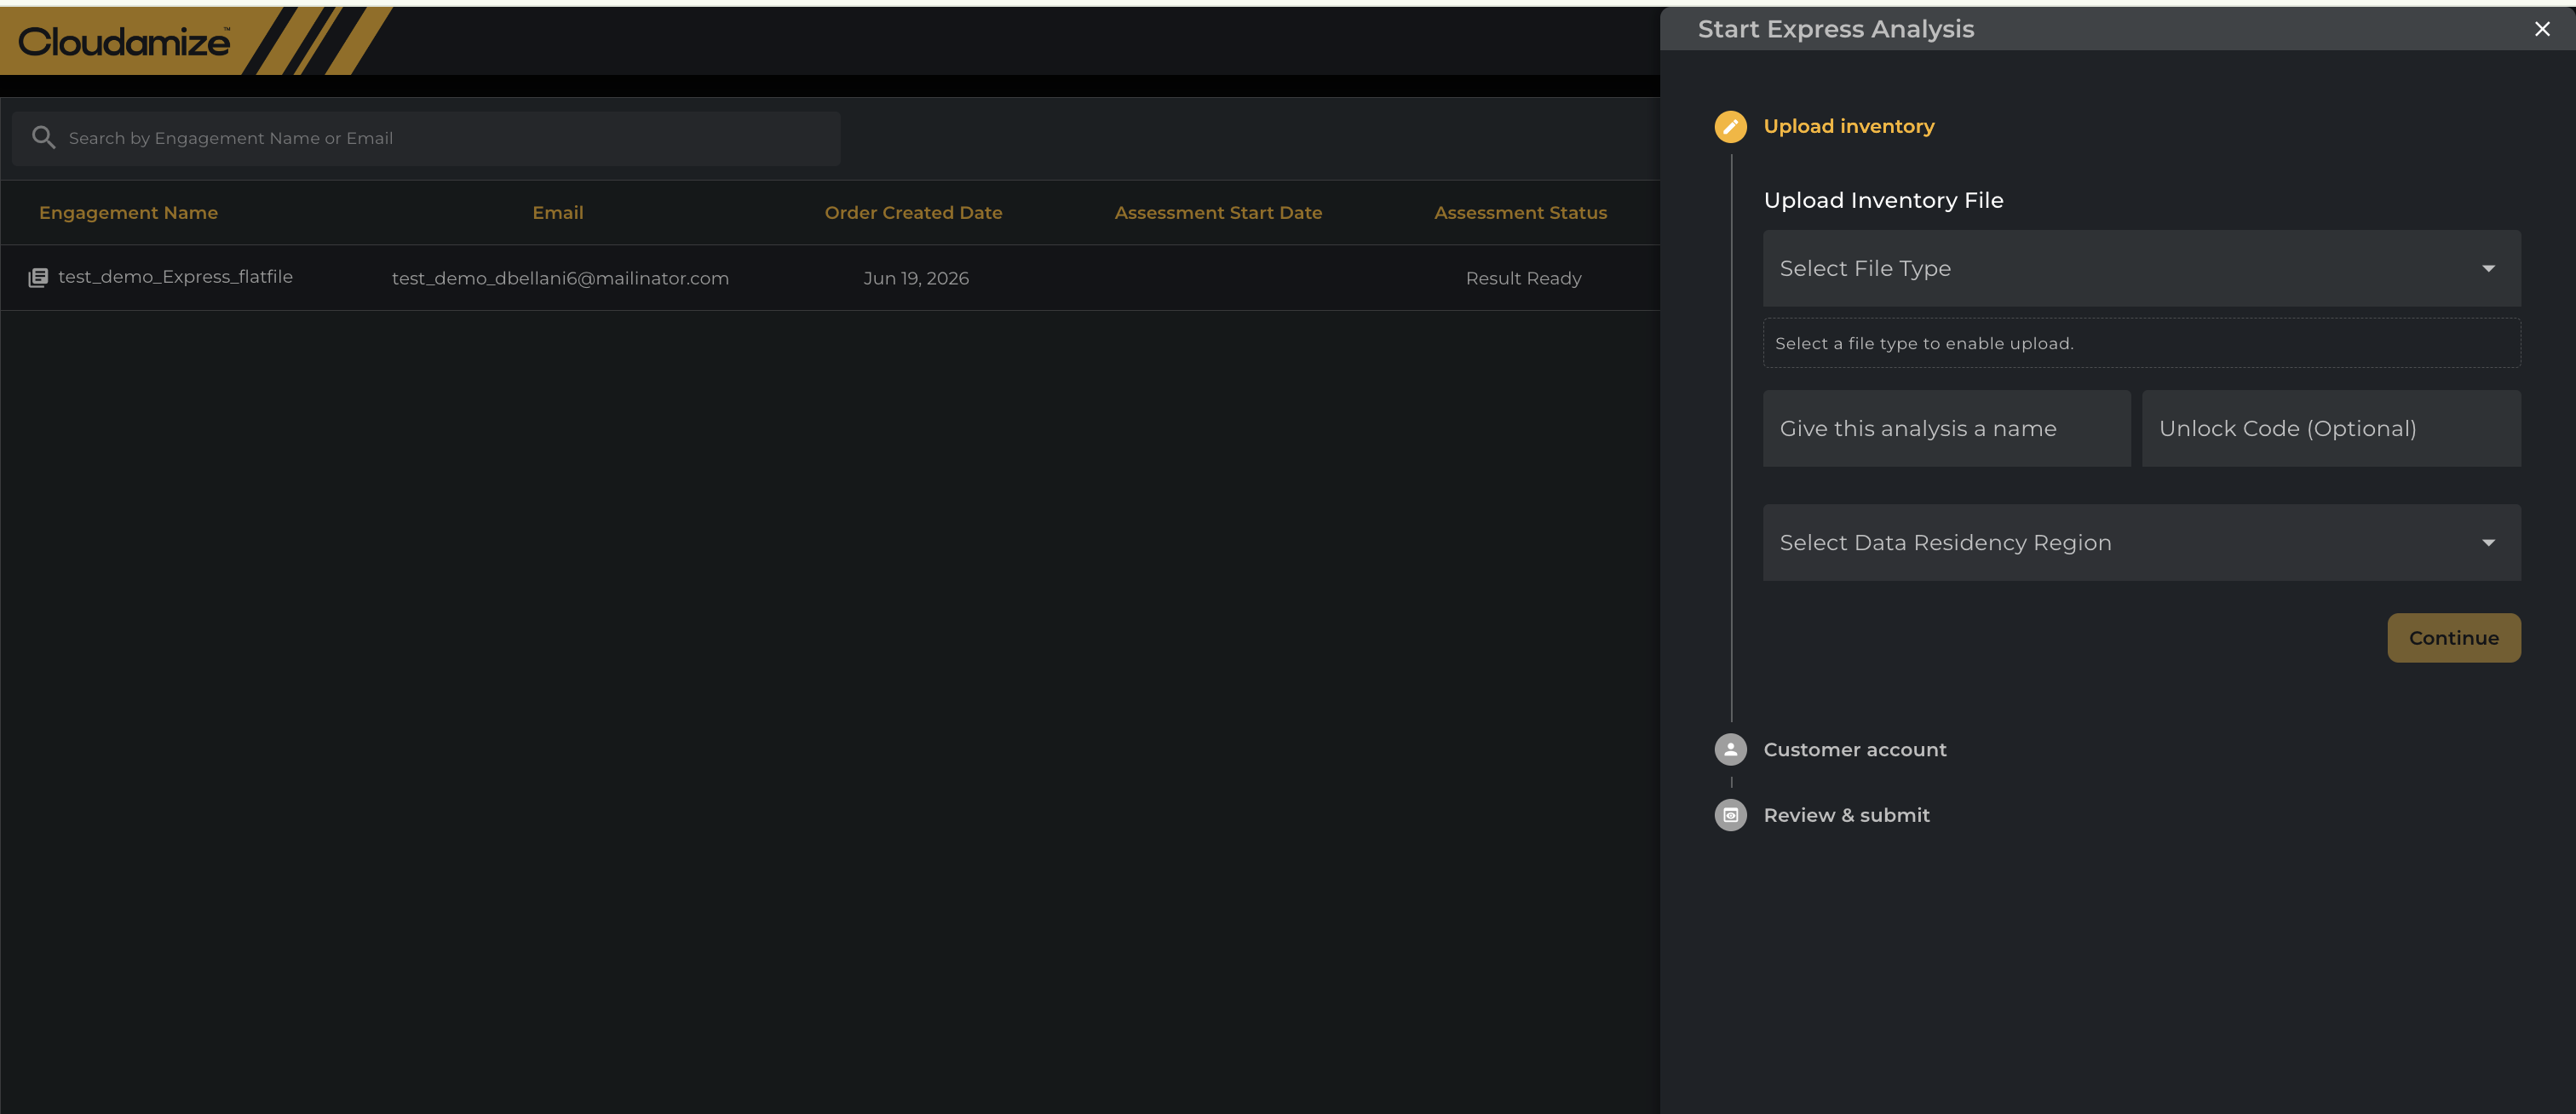
Clicking Start New Express Analysis from either location expands a sliding context panel labeled Start Express Analysis on the right side of the screen
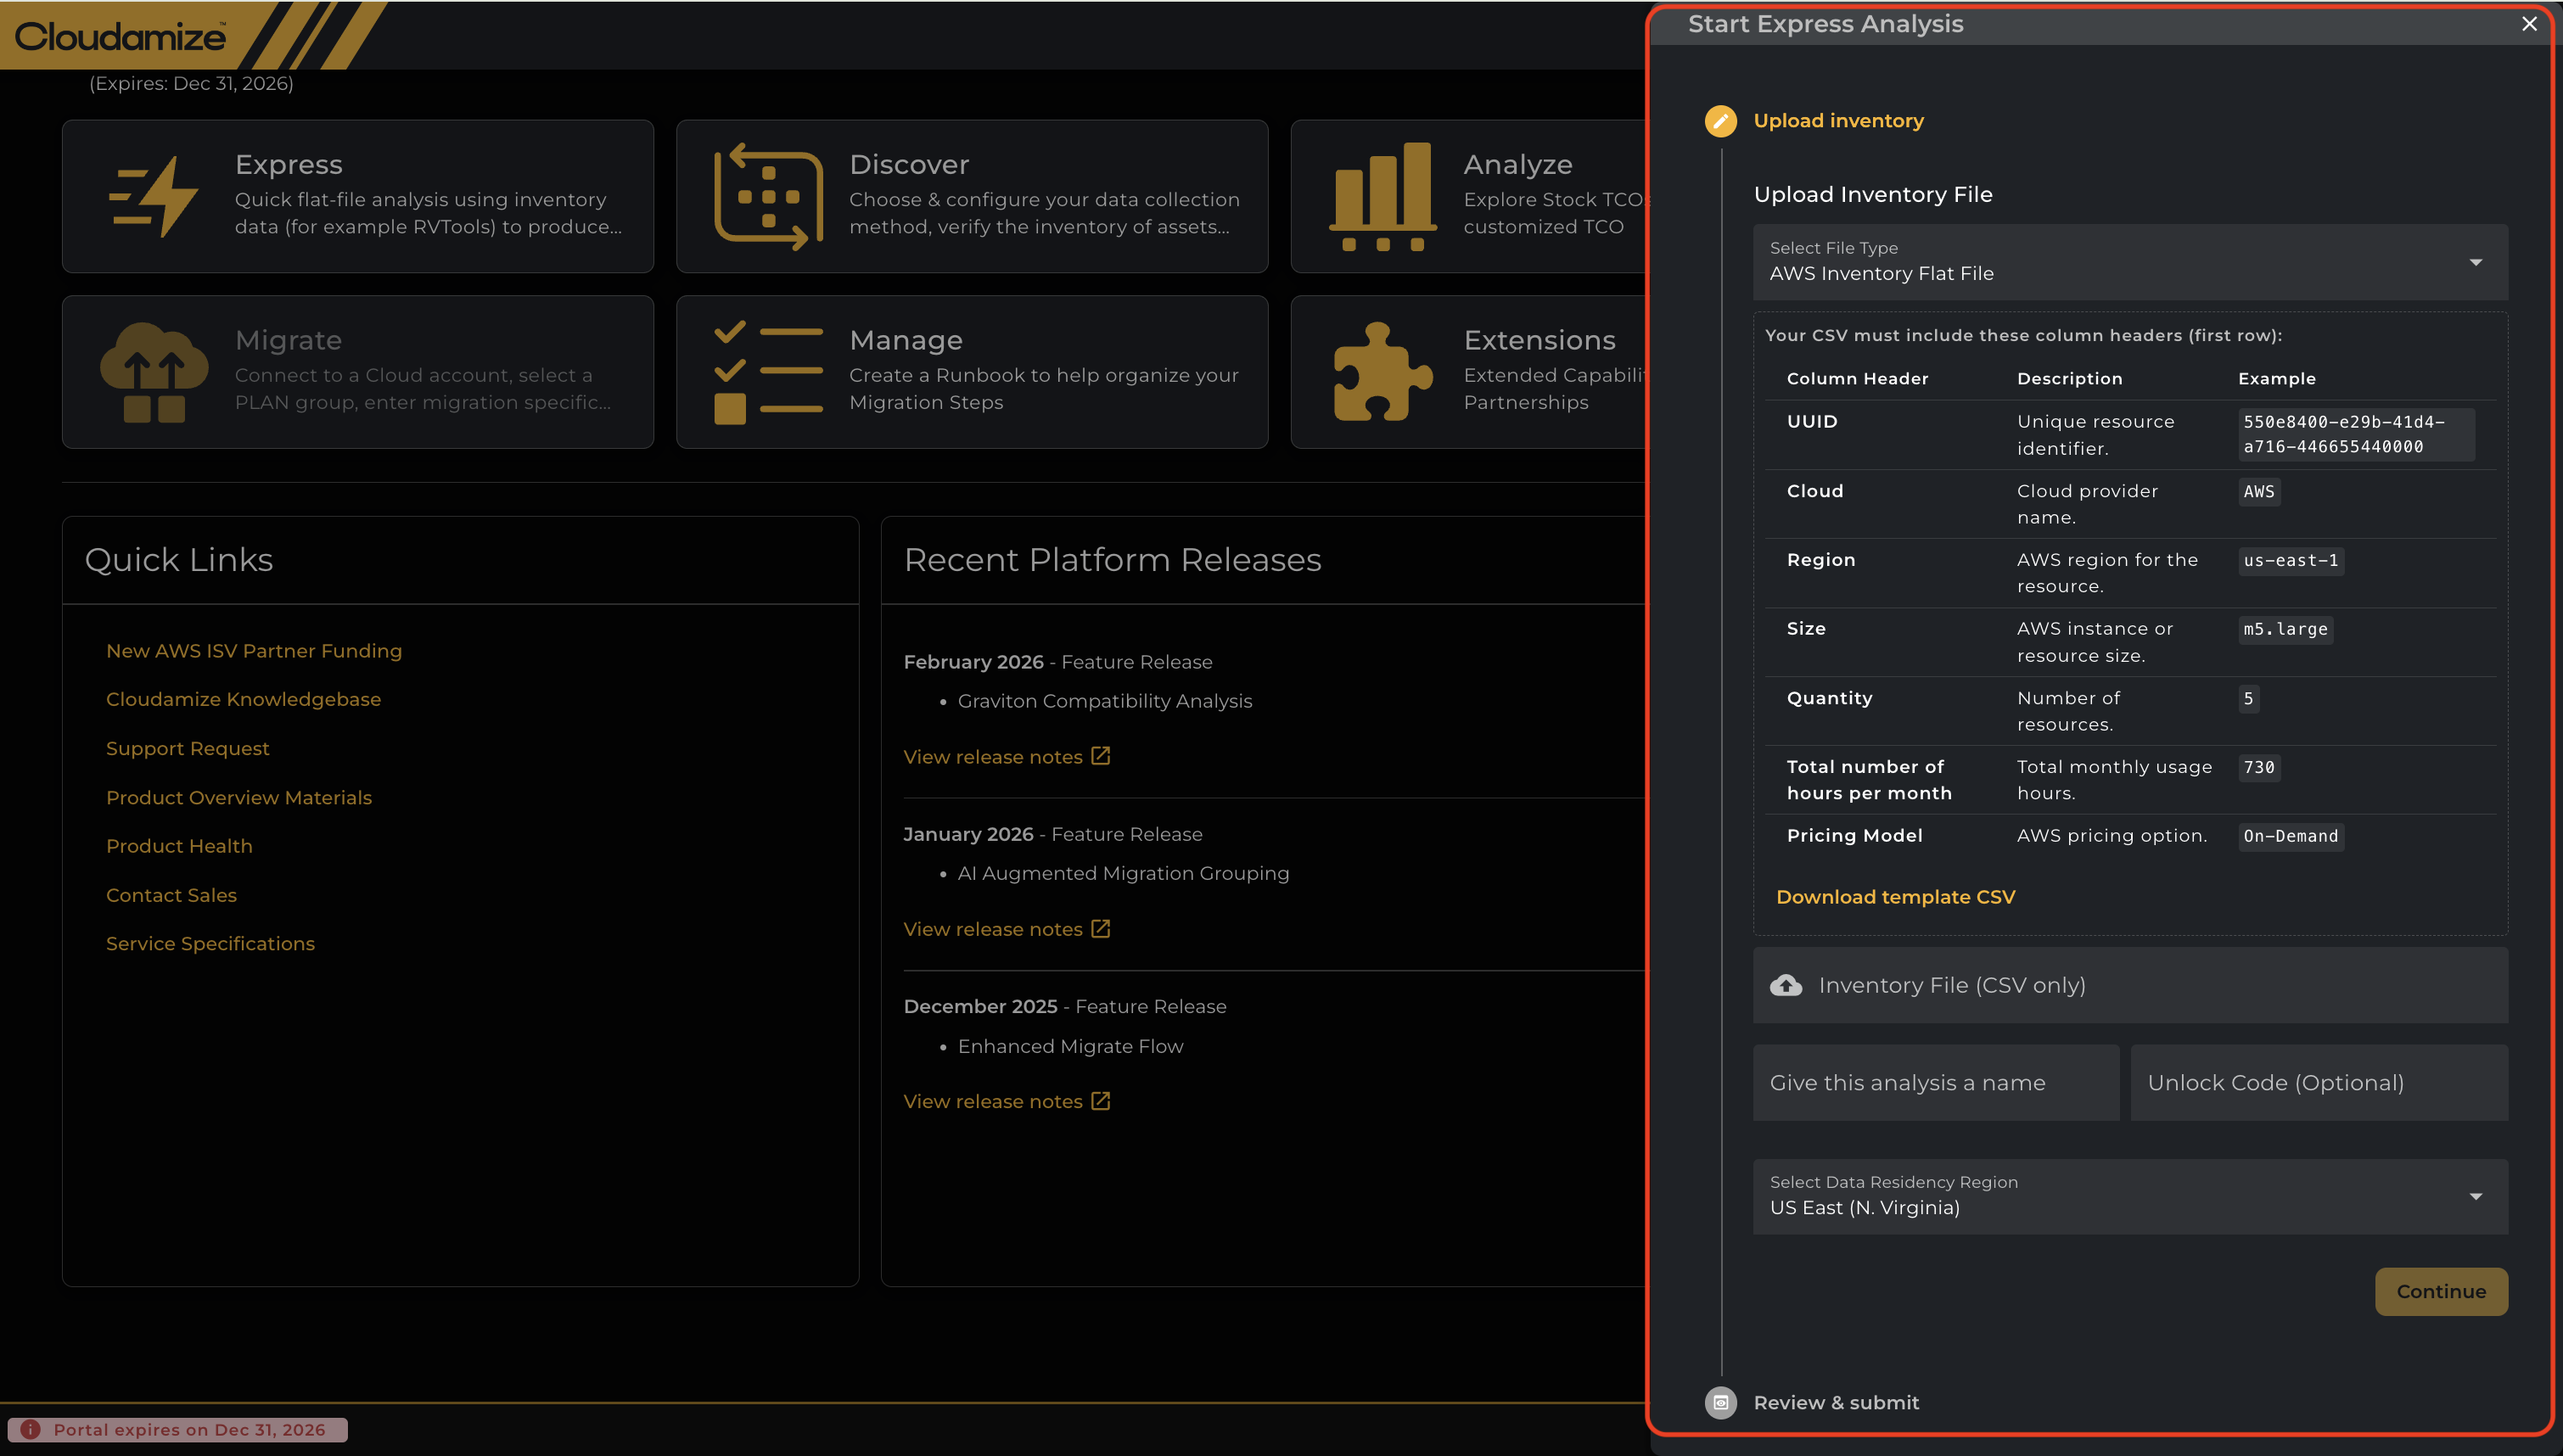
Complete the setup in the Upload Inventory Wizard panel:
-
Select File Type: Click the dropdown menu under Select File Type to choose your input format:
-
-
AWS Inventory Flat Files: Standard CSV or flat-file templates detailing existing instance configurations.
-
RVTools Export Files (
.xlsxor.xlsm): Direct import of standard VMware vCenter exports generated via RVTools.
-
-
-
Verify Required Headers: Ensure your CSV matches the required column headers specified in the panel table:
-
UUID: Unique resource identifier (e.g., 550e8400-e29b-41d4-a716-446655440000).
-
Cloud: Cloud provider name (e.g., AWS).
-
Region: AWS region for the resource (e.g., us-east-1).
-
Size: AWS instance or resource size (e.g., m5.large).
-
Quantity: Number of resources.
-
Total number of hours per month: Total monthly usage hours (e.g., 730).
-
Pricing Model: AWS pricing option (e.g., On-Demand).
(Click Download template CSV if you need a pre-formatted template).
-
-
Inventory File (CSV only): Click to browse and upload your .csv inventory file.
-
Give this analysis a name: Enter a unique identifier for this assessment run.
-
Unlock Code (Optional): Enter an unlock code if provided by your account manager.
-
Select Data Residency Region: Choose your target cloud region (e.g., US East (N. Virginia)).
-
Click Continue to move to Review & Submit, then submit your analysis into the engine queue.
How to Access and Manage Engagements
Once your account registration is complete, follow these steps to access the platform and manage your ongoing flat-file analyses:
Step 1: Accessing the Portal
-
If you have already registered, navigate directly to the Cloudamize login portal at console.cloudamize.com.
-
Enter your registered business email address and password to sign in.
Step 2: Selecting the Express Module
-
After you login successfuly, you will land on the main Cloudamize Home Dashboard Hub.
-
Locate the navigation tiles array across the top of the interface.
-
Click on the Express module tile (identified by the lightning bolt icon) to open your active workload workspace.
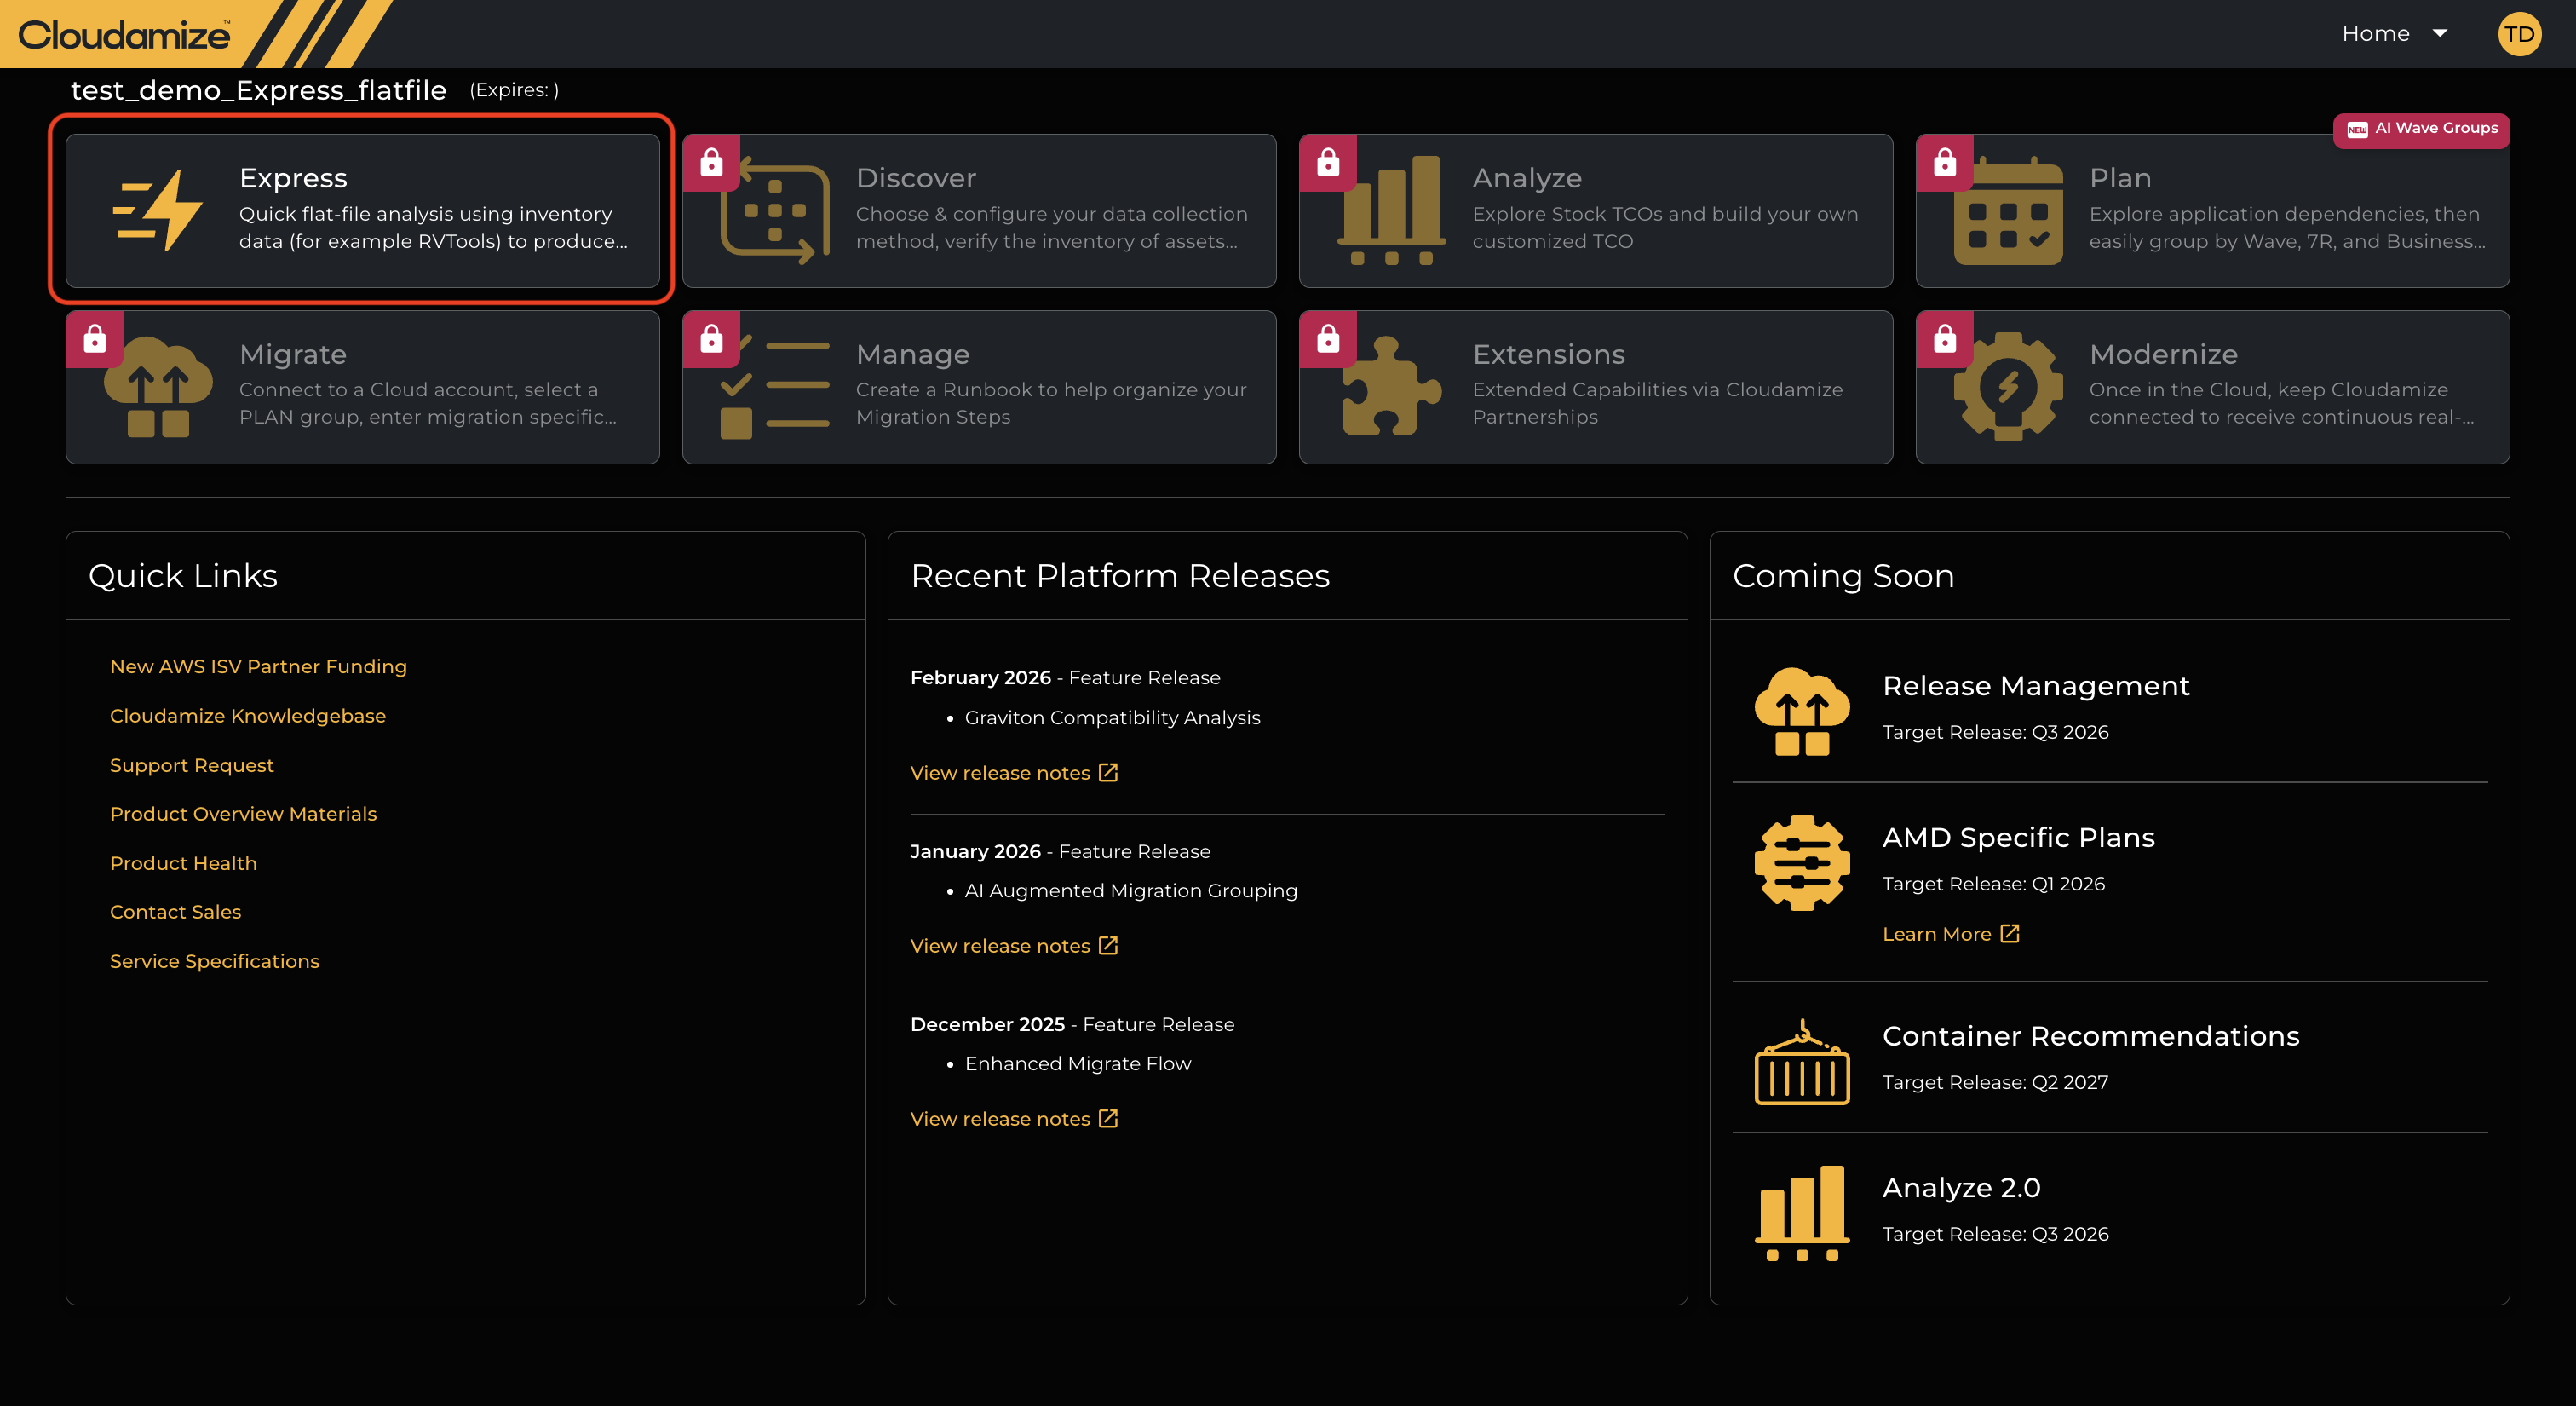
⚠️ IMPORTANT NOTE: Because your account framework is tailored specifically for a fast-path flat-file analysis, all modules other than Express will display a red padlock icon and remain locked (including Discover, Analyze, Plan, Migrate, Manage, Extensions, and Modernize). These options will only unlock if you choose to transition your engagement to a full, live collector infrastructure assessment.
Step 3: Navigating the Express Dashboard
Once you enter the Express workspace, you can manage and track your flat-file infrastructure workloads directly from your workspace panel:
-
Engagement Dashboard Availability: Once you register your Express assessment, your account and file details will be immediately available in the central engagement dashboard tracking table.
-
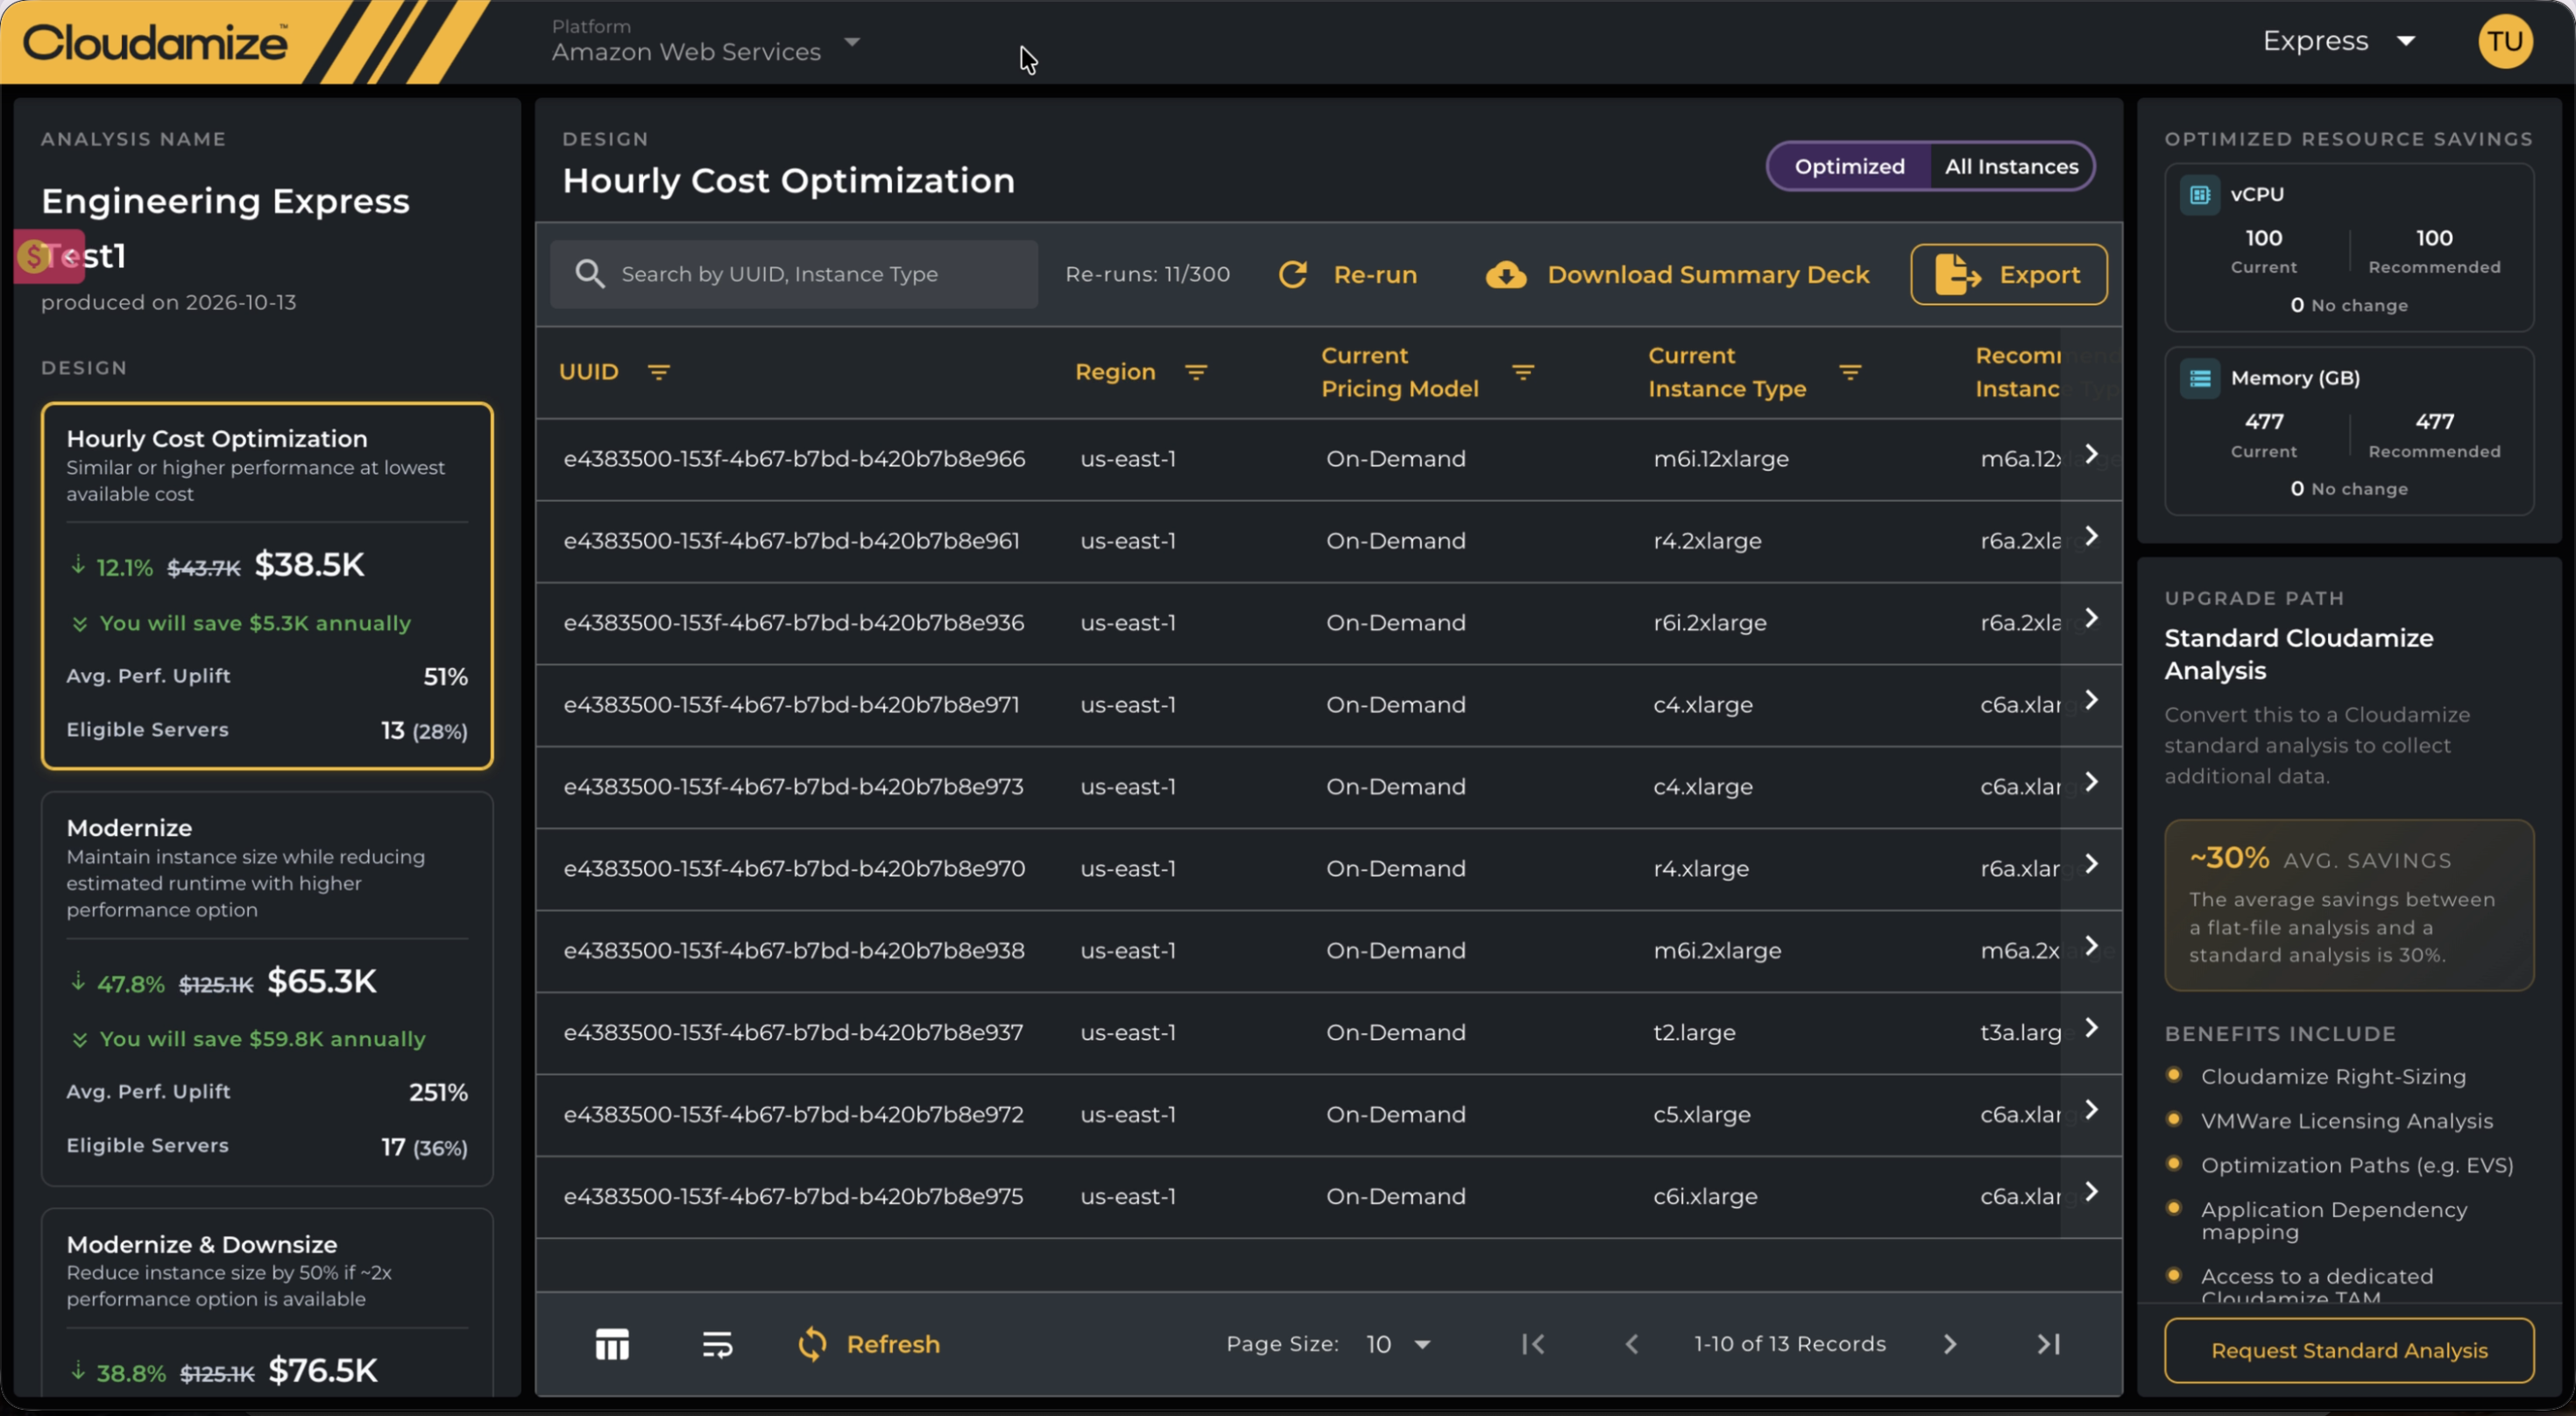
Registering for a New Express Analysis: If you need to evaluate a separate infrastructure batch, you have the option to register for a brand new Express assessment directly from this screen. As shown in the screenshot below, click the yellow Start New Express Analysis button in the upper right corner.
Upload Sidebar Flow: Clicking this option expands a sliding context wizard labeled Start Express Analysis on the right side of your dashboard. This multi-step menu guides you through uploading inventory (selecting file types, names, unlock codes, and data residency regions), setting up the Customer account, and completing a final Review & Submit to cleanly push your new assessment into the engine queue.
Reviewing Your Express Results
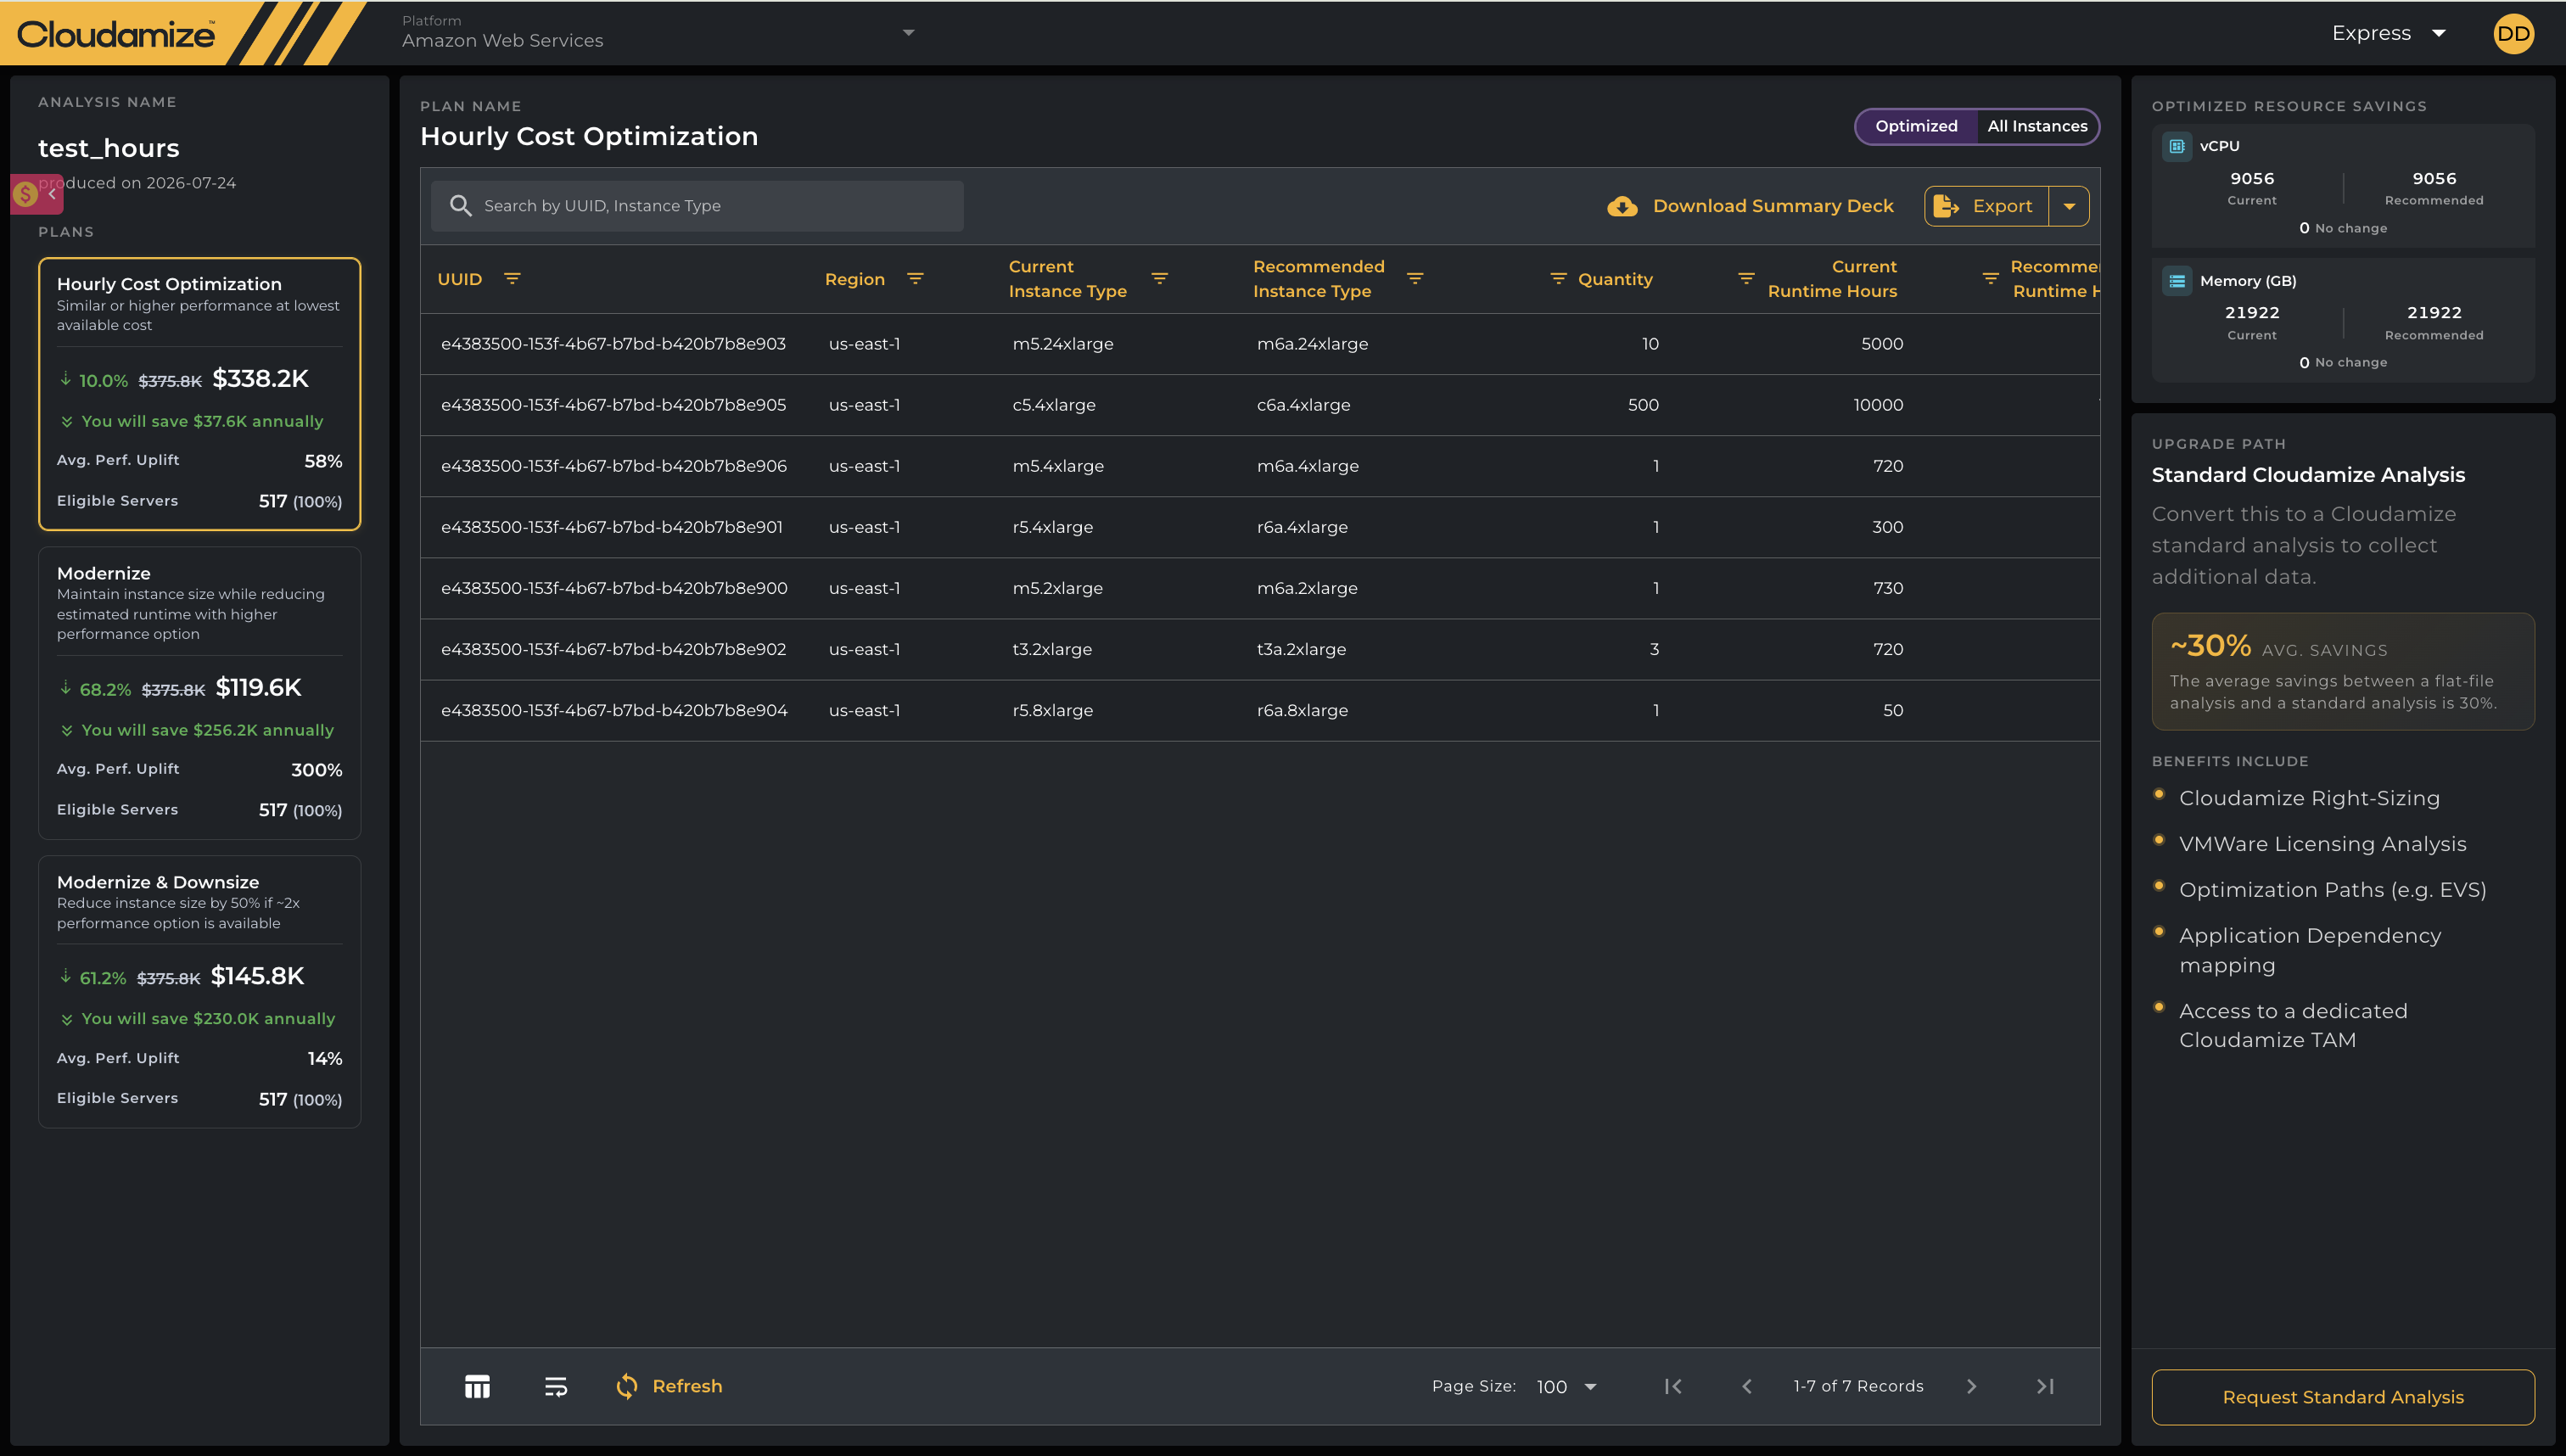
Once backend processing completes and your assessment opens, you will land on the Express Interactive Results Hub:
1. View Controls (Optimized vs. All Instances)
Located at the top right of the primary plan data grid, users can toggle between two view modes:
-
Optimized: Displays only the subset of servers that have identified optimization recommendations, potential cost savings, or performance uplifts.
-
All Instances: Displays the complete list of all servers ingested from the uploaded flat file, including those without specific recommendations.
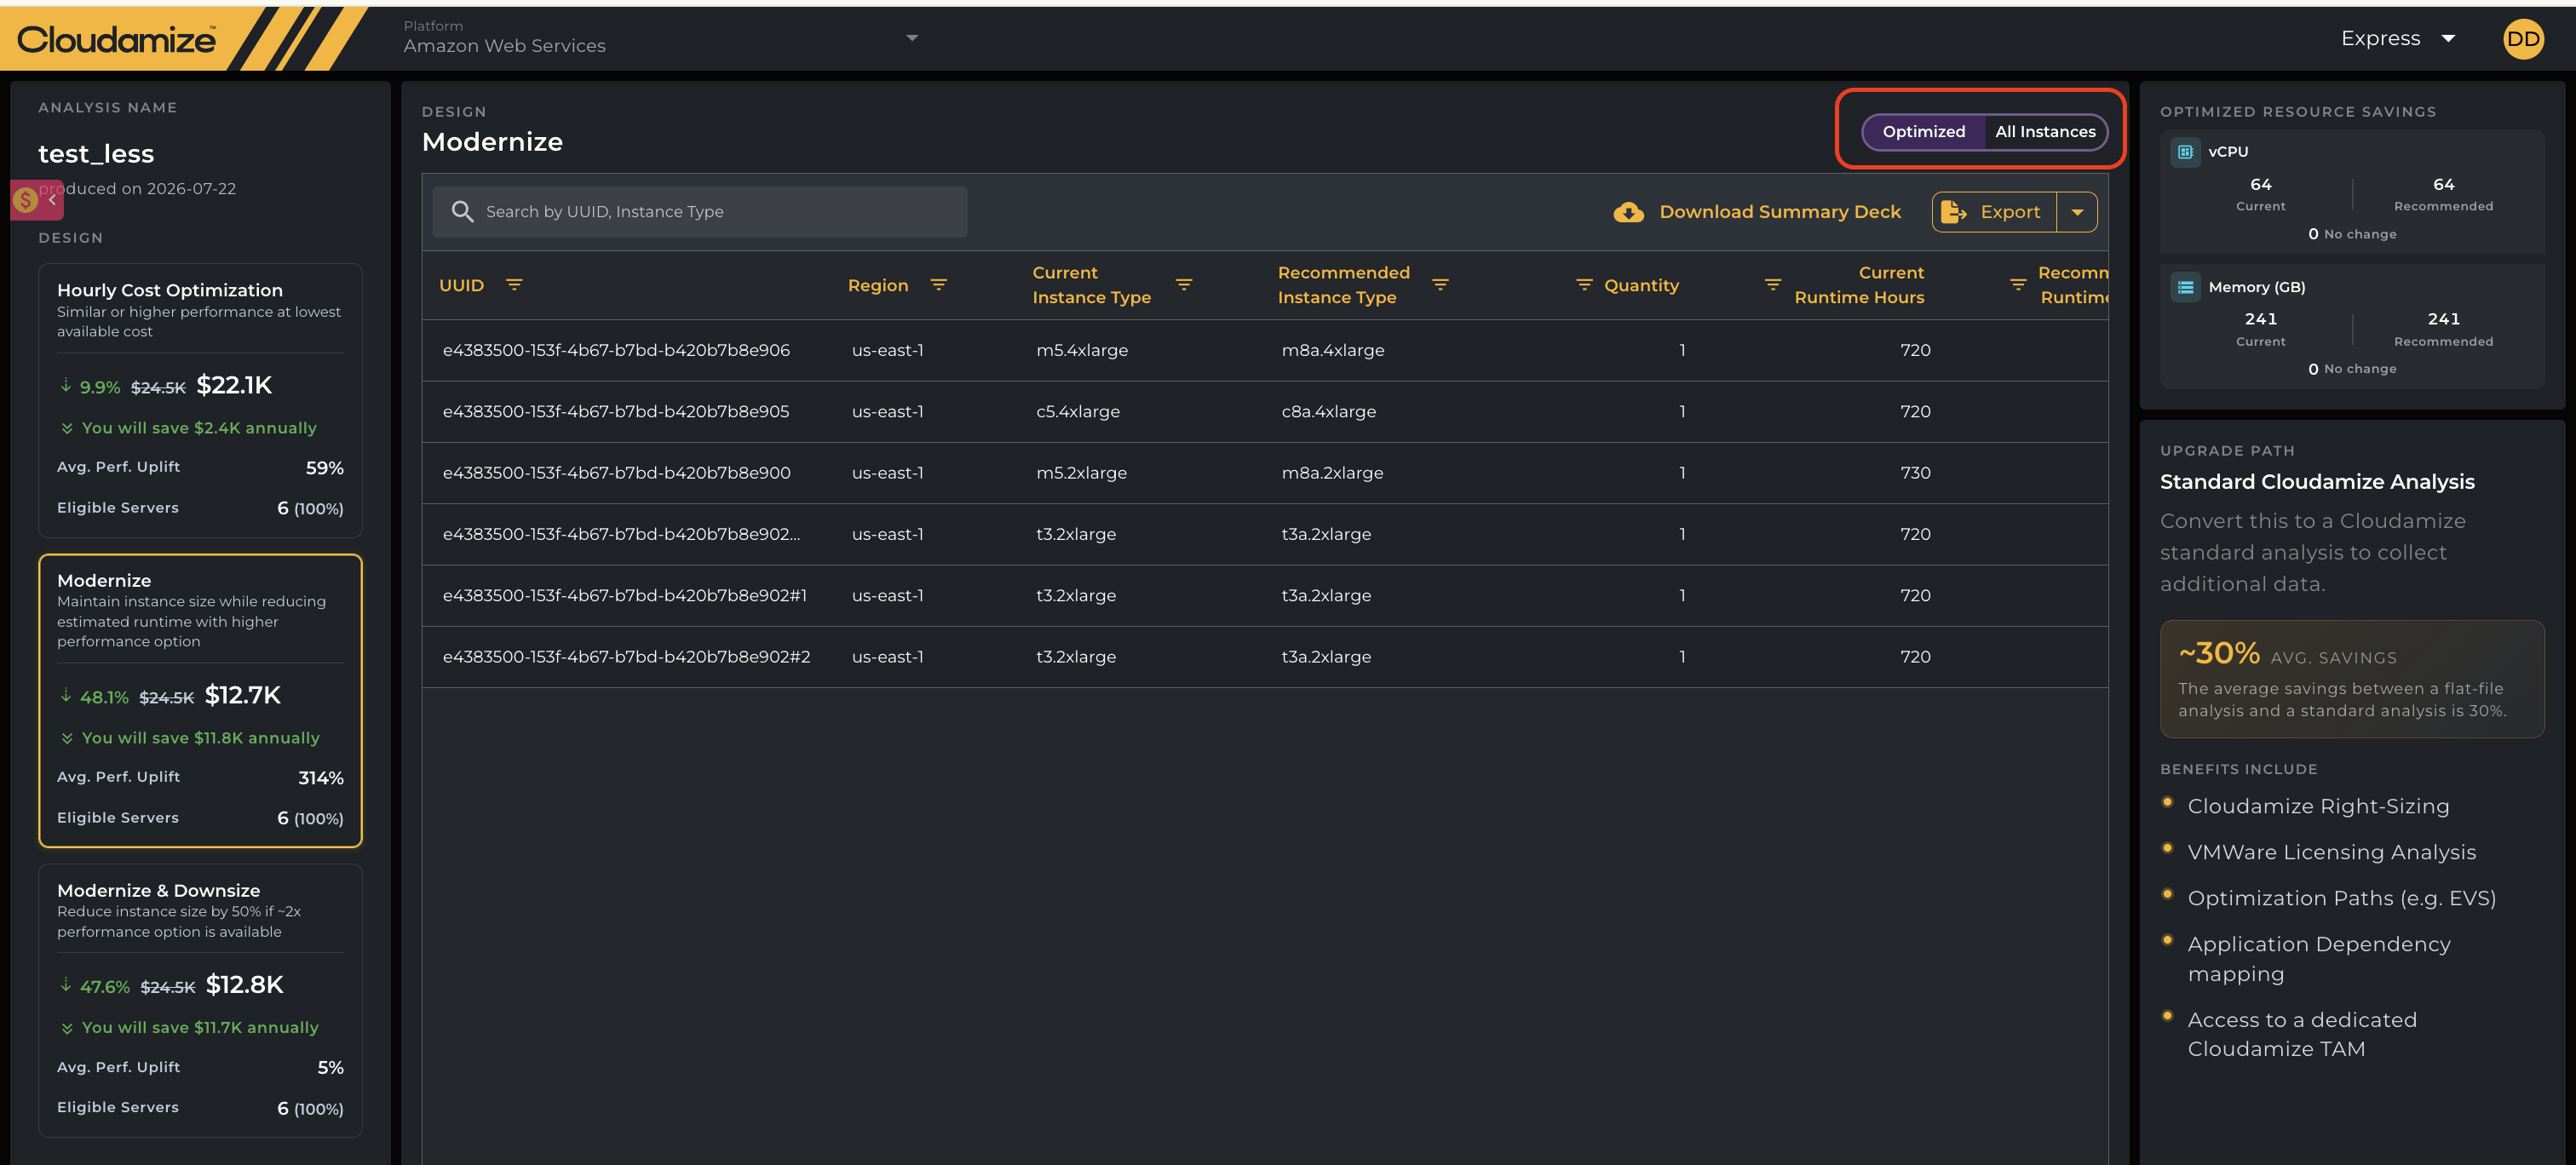
2. Left Panel: Optimization Plans (Costing Options)
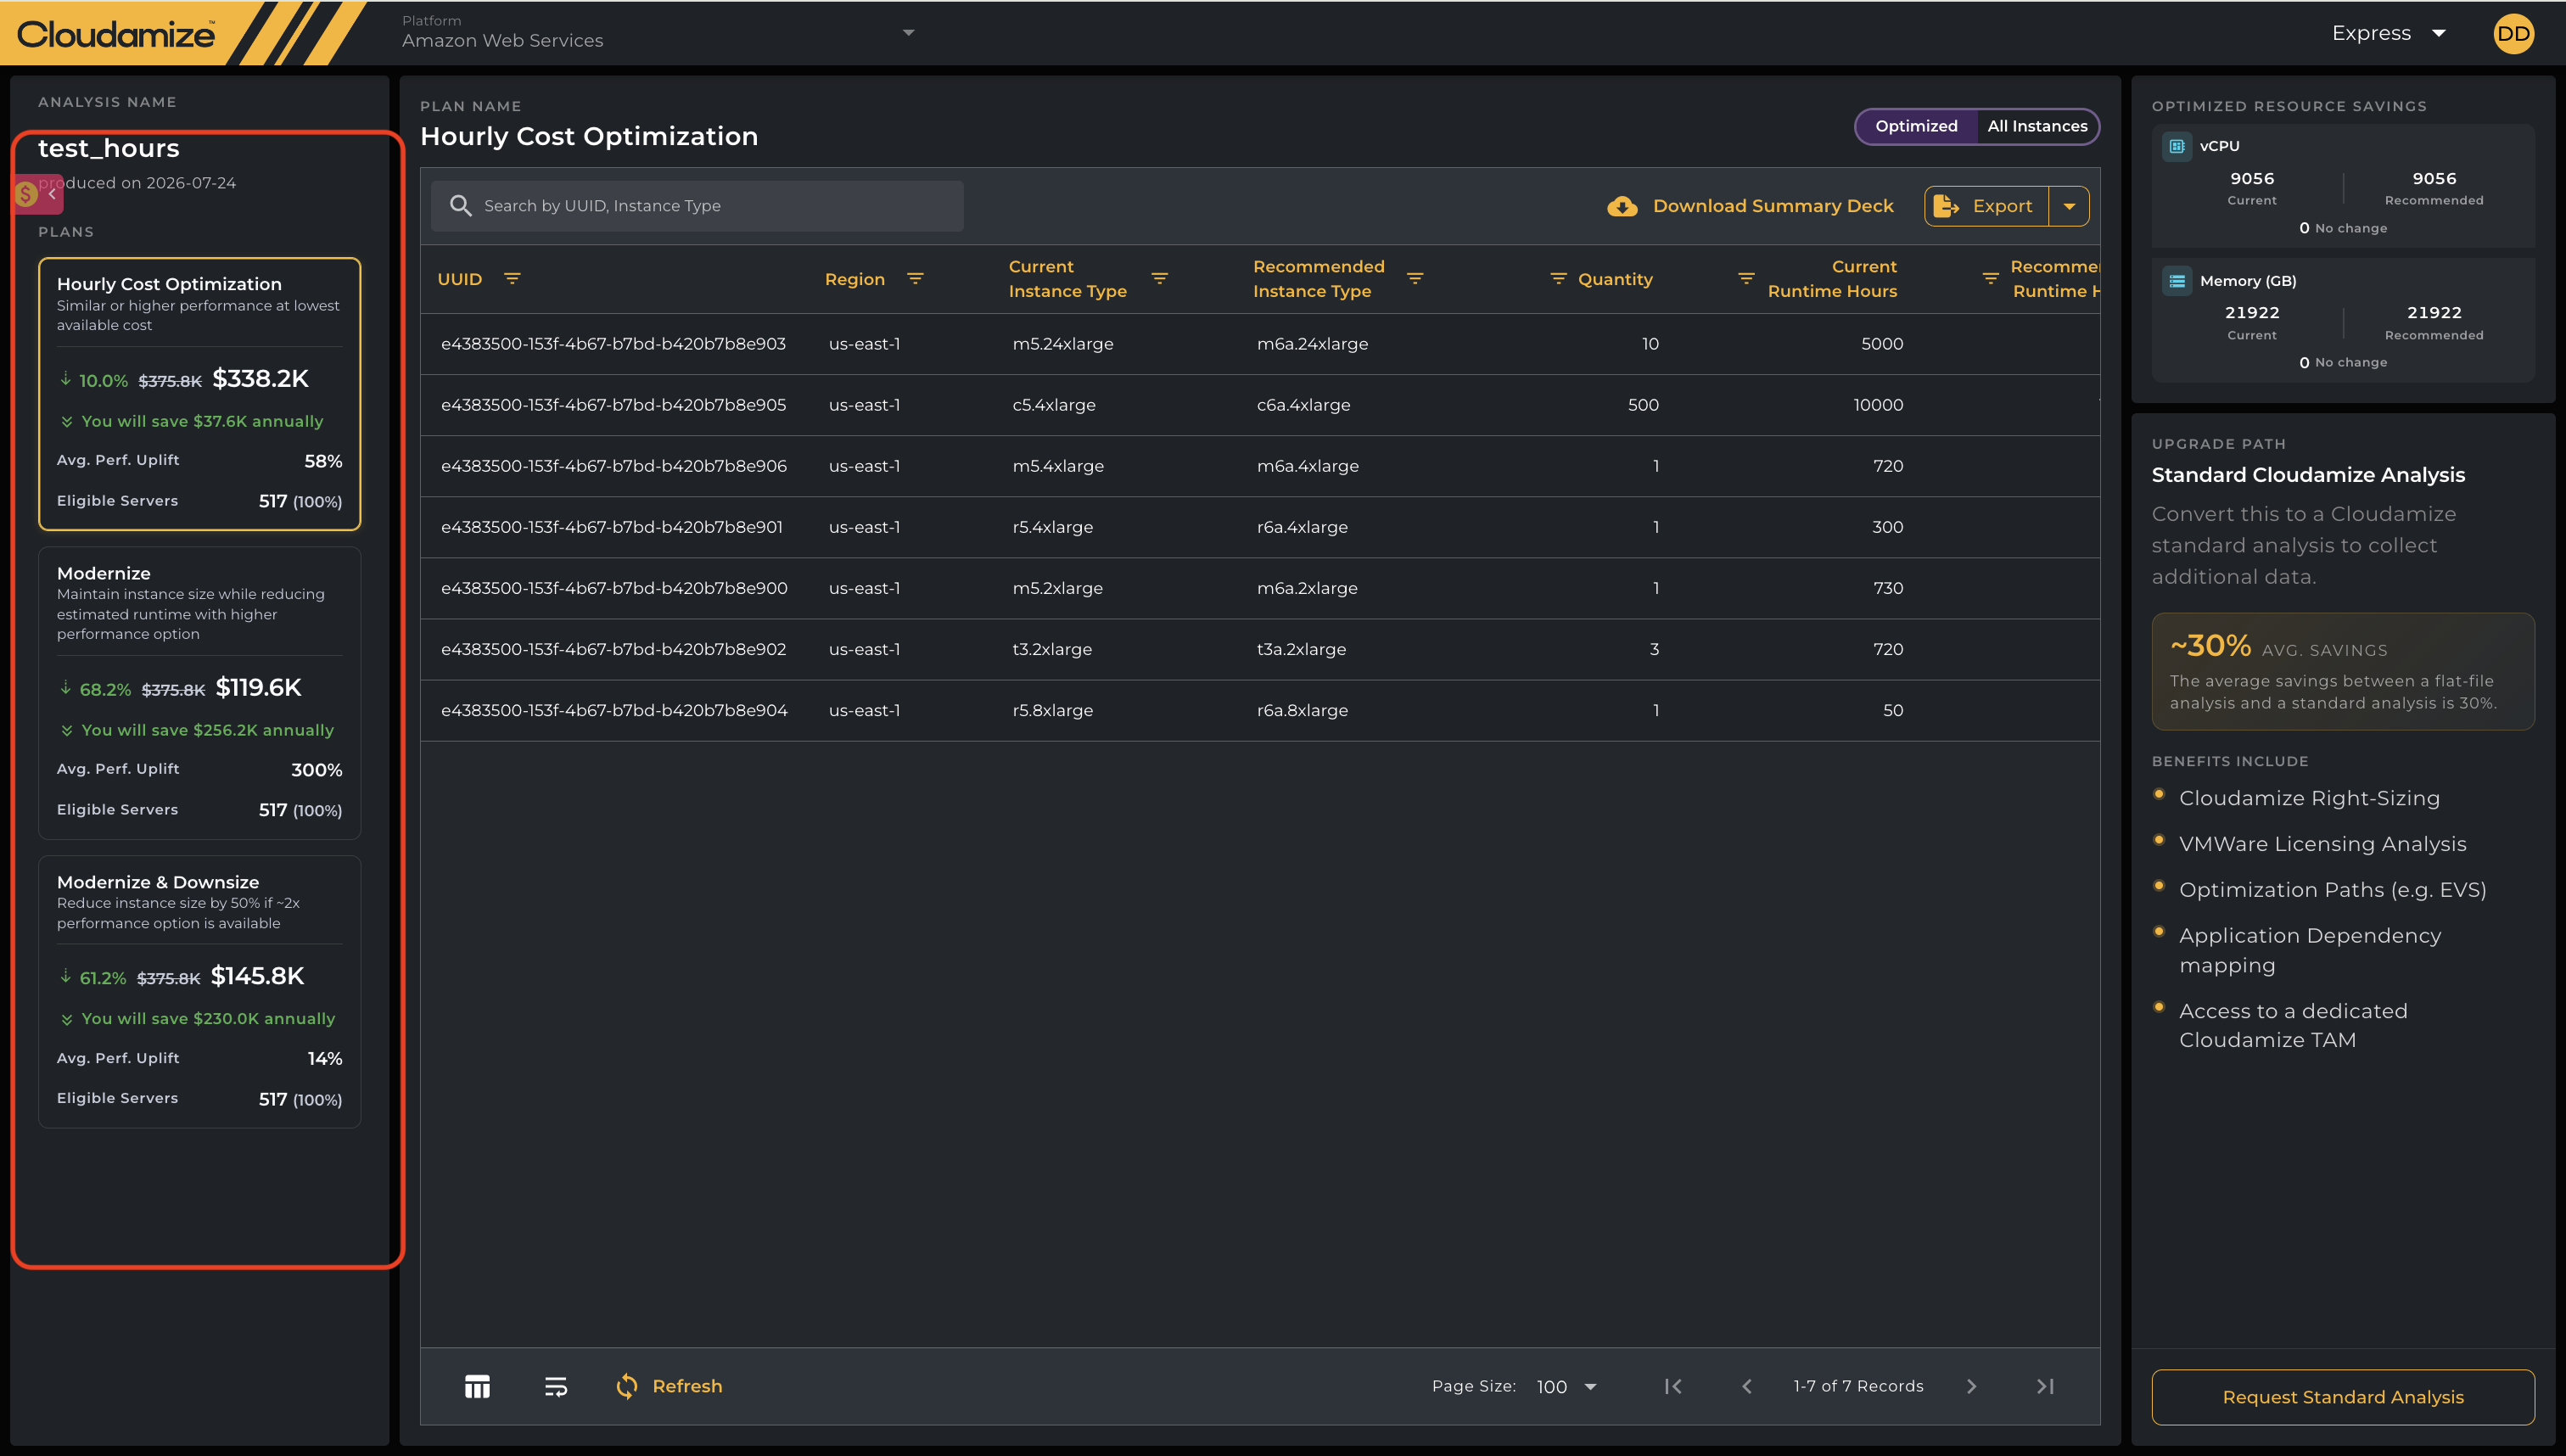
Optimization strategies are listed directly as interactive plan cards on the left panel. Clicking any plan card instantly updates the center grid and metrics with that strategy's specific recommendations:
-
Hourly Cost Optimization: Delivers similar or higher performance at the lowest available cost. Displays net annual savings percentage, total cost, average performance uplift, and eligible server counts.
-
Modernize: Maintains instance size while reducing estimated runtime with higher performance options.
-
Mechanics: Reduces the instance size by 50% if a ~2x (approximately double) or greater performance option is available in modern instance families.
Caveat: Network-Intensive Intel Instances: Intel instance types optimized for high network performance (c5n, m5n, r5n, r5dn, c6in, m6in, r6in, and r6idn) will default to a MAINTAIN recommendation with no alternative recommendations generated across all three plans.
5th Gen vs. 6th Gen AMD Instance Recommendations:
-
By default, 5th generation AMD instances (
r5a,m5a,c5a) receive a MAINTAIN status if their 6th generation counterparts (r6a,m6a,c6a) cost the same or more. -
Exception: In specific regions where 6th generation instances are cheaper, the system will recommend upgrading to the 6th generation.
Caveat: Unsupported Legacy Instances: The t1.micro instance type does not support Modernize or Modernize & Optimize (M&D) recommendation workflows.
3. Center Panel: Recommendation Grid & Optimization Designs
This interactive table features column-level filters for rapid sorting, allowing users to segment, search, and parse assets seamlessly. The table provides a complete, granular data view across the following columns: Recommendation Grid Columns & Data Export
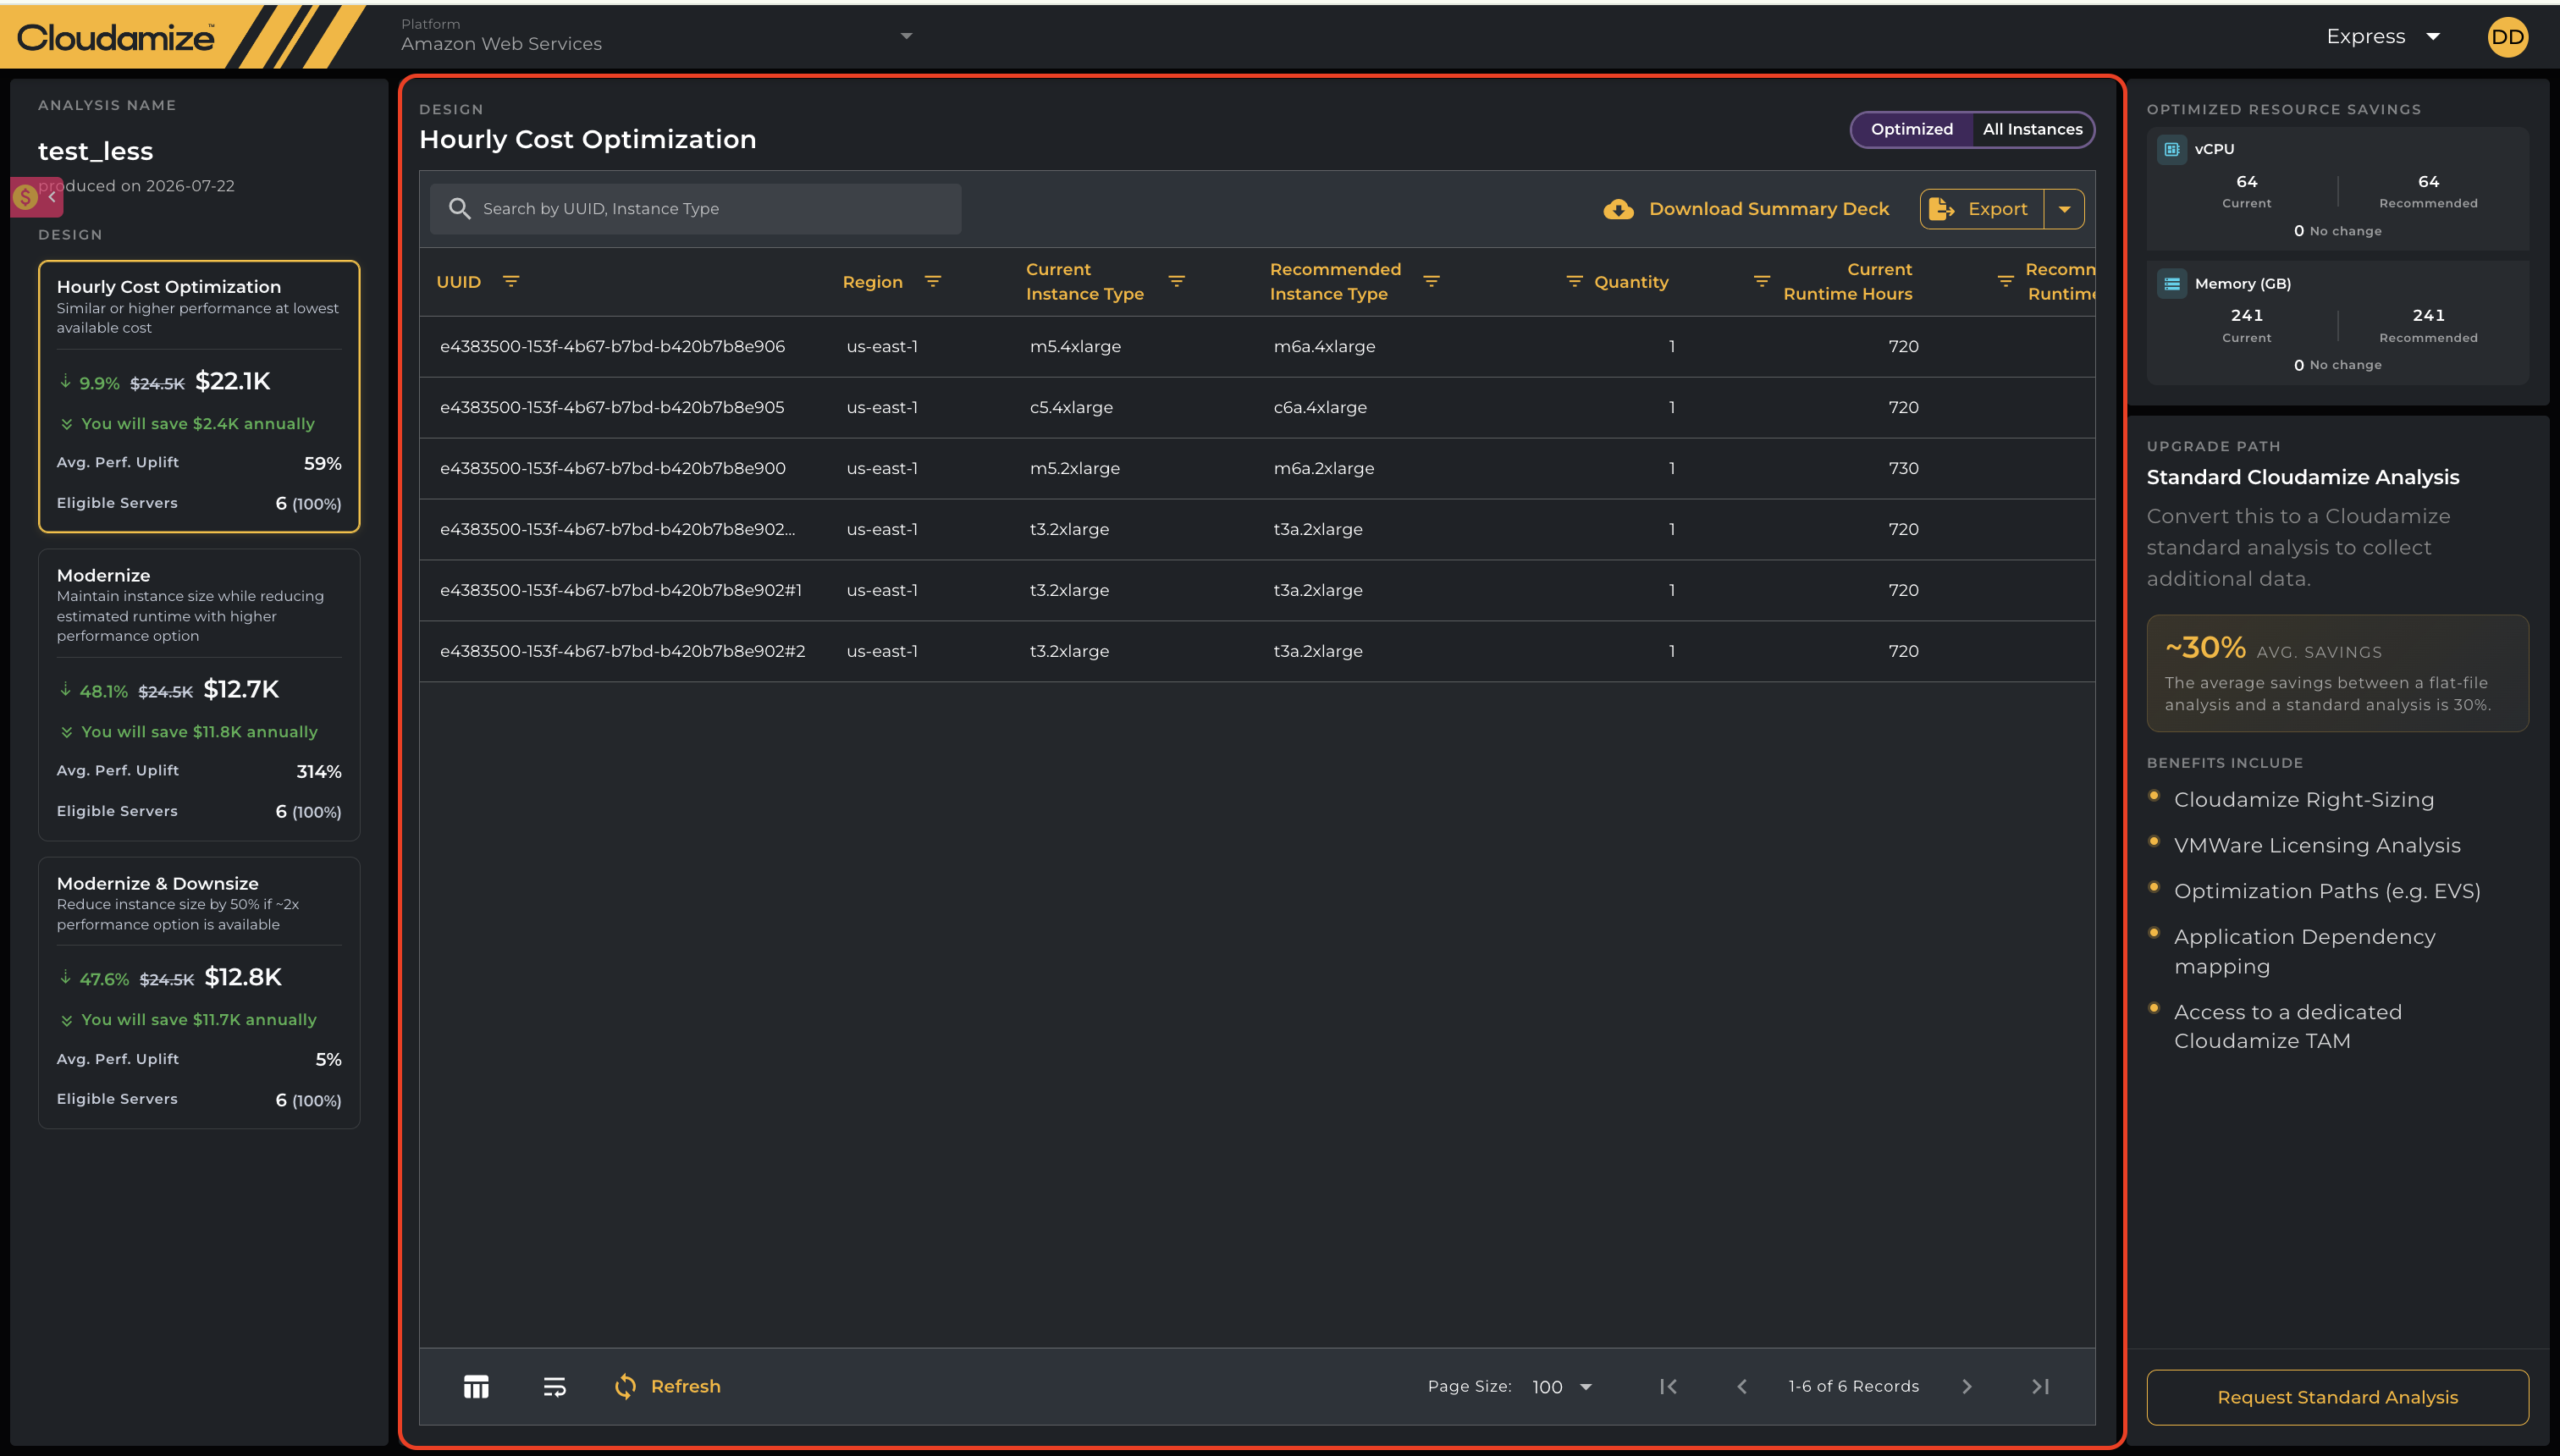
Caveat: Instances belonging to families without specific AMD benchmarks (e.g., r5d, r7iz, m5d, m5dn, m5zn, and c1) will return a null performance score.
When viewing the table or clicking Export, the report outputs the following detailed attributes:
|
Column Name |
Description |
|
UUID / Instance Name |
The unique identifier or hostname of the resource parsed from your file. |
|
Region |
The target AWS region (e.g., us-east-1). |
|
Current Instance Type |
Baseline AWS instance size identified in the upload (e.g., m5.24xlarge). |
|
Recommended Instance Type |
Suggested AWS instance size under the selected plan (e.g., m6a.24xlarge). |
|
Quantity |
Total number of identical server instances for this row. |
|
Current Monthly Cost ($) |
Baseline monthly operating cost. |
|
Recommended Monthly Cost ($) |
Projected monthly cost for the recommended instance size. |
|
Current Annual Cost ($) |
Baseline annual operating cost. |
|
Recommended Annual Cost ($) |
Projected annual cost for the recommended footprint. |
|
Annual Savings ($) |
Total annual savings achieved by adopting the recommendation. |
|
Current vCPU |
Baseline allocated virtual CPU count. |
|
Recommended vCPU |
Virtual CPU count allocated in the recommended target. |
|
Current Memory (GB) |
Baseline allocated RAM in GB. |
|
Recommended Memory (GB) |
Recommended RAM in GB. |
|
Current Runtime Hours |
Total monthly usage hours in the baseline environment. |
|
Recommended Runtime Hours |
Projected monthly usage hours for the recommended instance. |
Node Restriction Behavior: If you registered to Express without an initial unlock code, the recommendation grid limits visibility to a basic assessment trial. As shown in the below screenshot, the workspace displays a status message stating "Showing 10 of [X] recommendations" and masks data past the initial 10 server nodes details and recommendations.
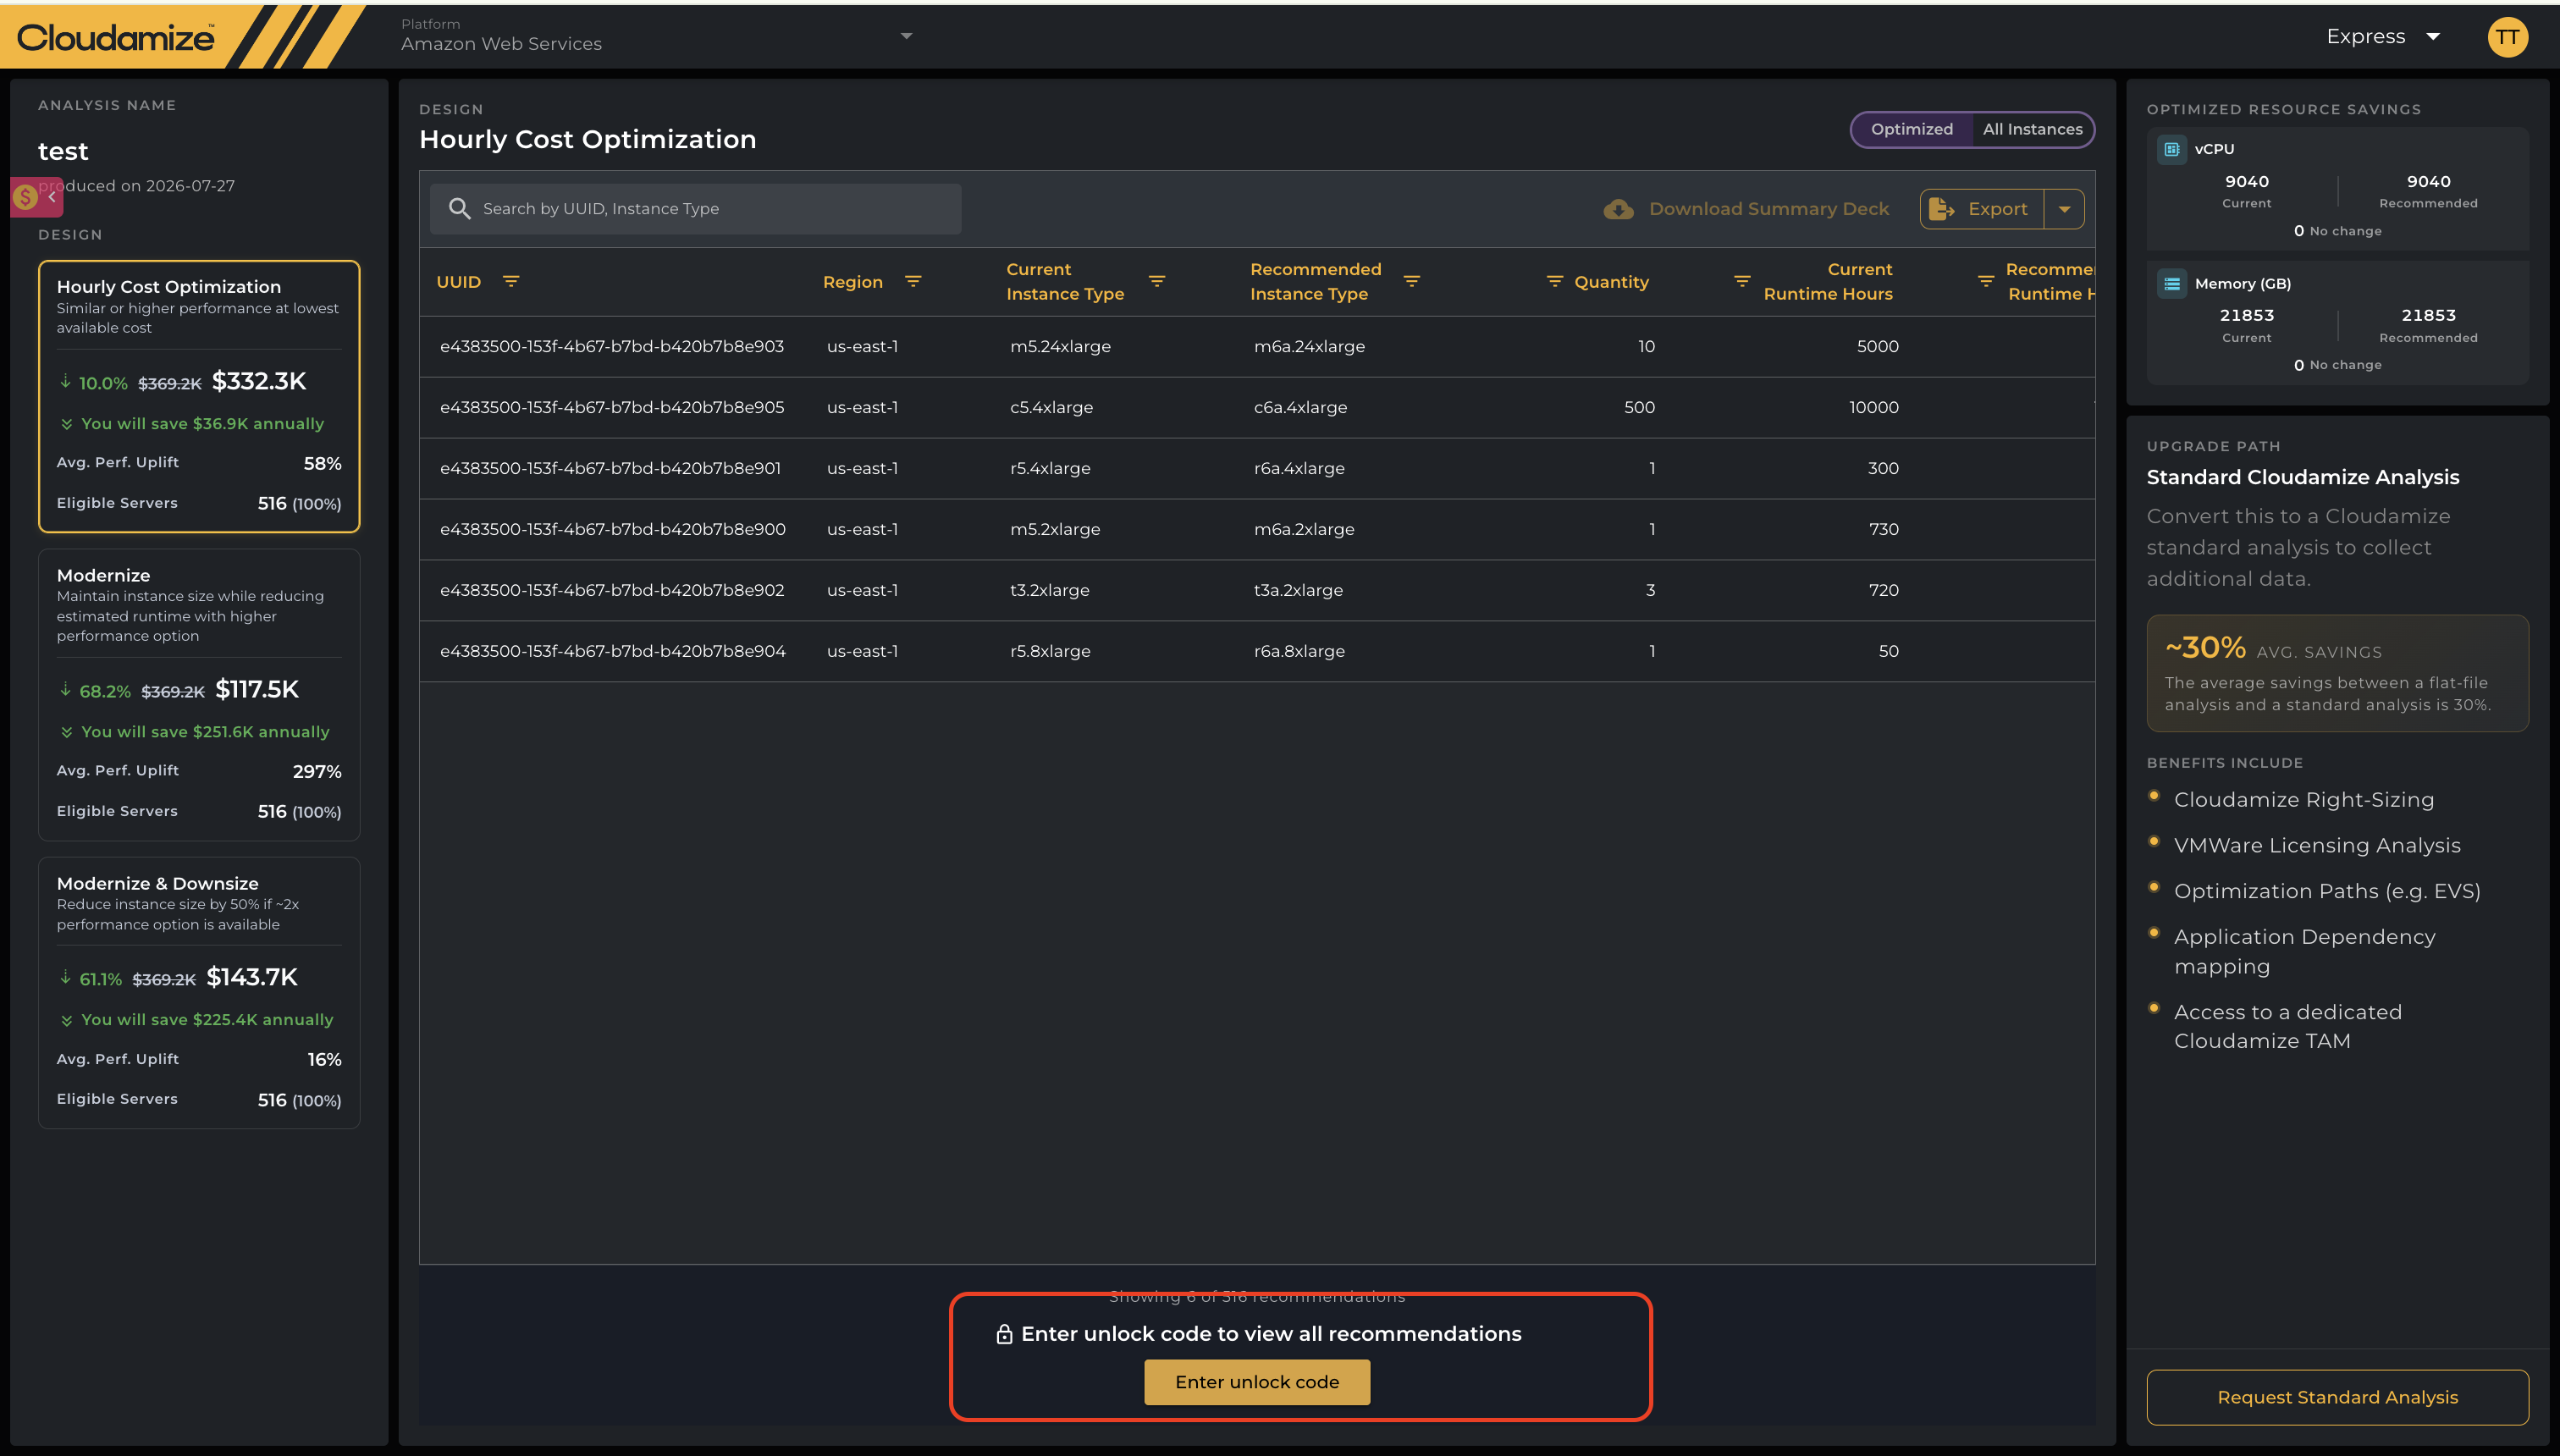
Unlocking the Remaining Nodes
To unmask the full contents of your flat file and view all locked nodes/recommendations, you must apply a code from within the interactive interface:
-
Scroll to the bottom of the center recommendation table to locate the action prompt labeled: "Enter unlock code to view all recommendations," as seen in the screenshot above.
-
Click the Enter unlock code button.
-
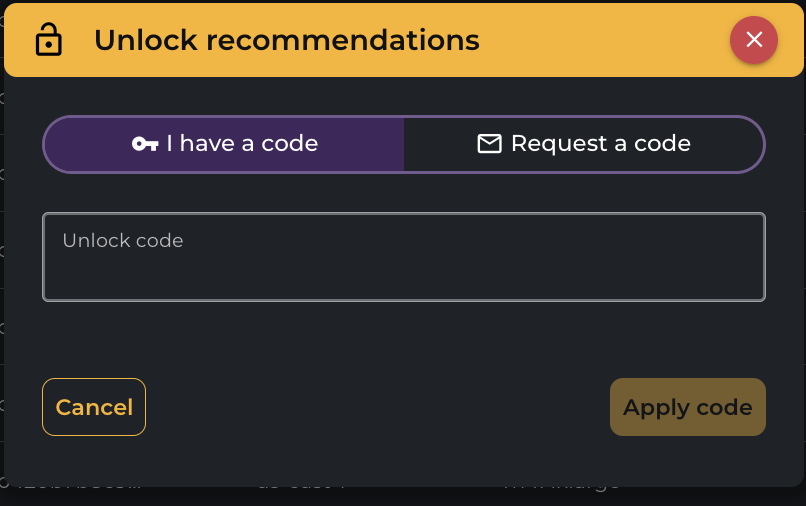
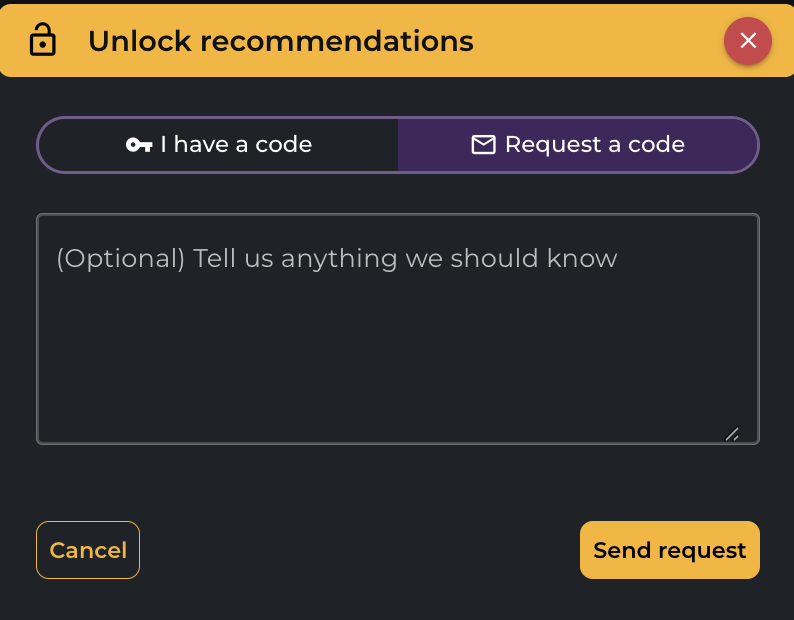
An Unlock recommendations modal window will appear,
-
If you have a code: Ensure the I have a code tab is highlighted, input your code to immediately unlock the remaining nodes from your flat file, and submit.
-
If you do not have a code, click on the adjacent Request a code option tab. You can use this request code option to fill out the text field labeled
(Optional) Tell us anything we should knowto outline your project details, and click Send request. The account management team will review your submission to help unlock your full inventory footprint.
Deep-Dive Node Inspection
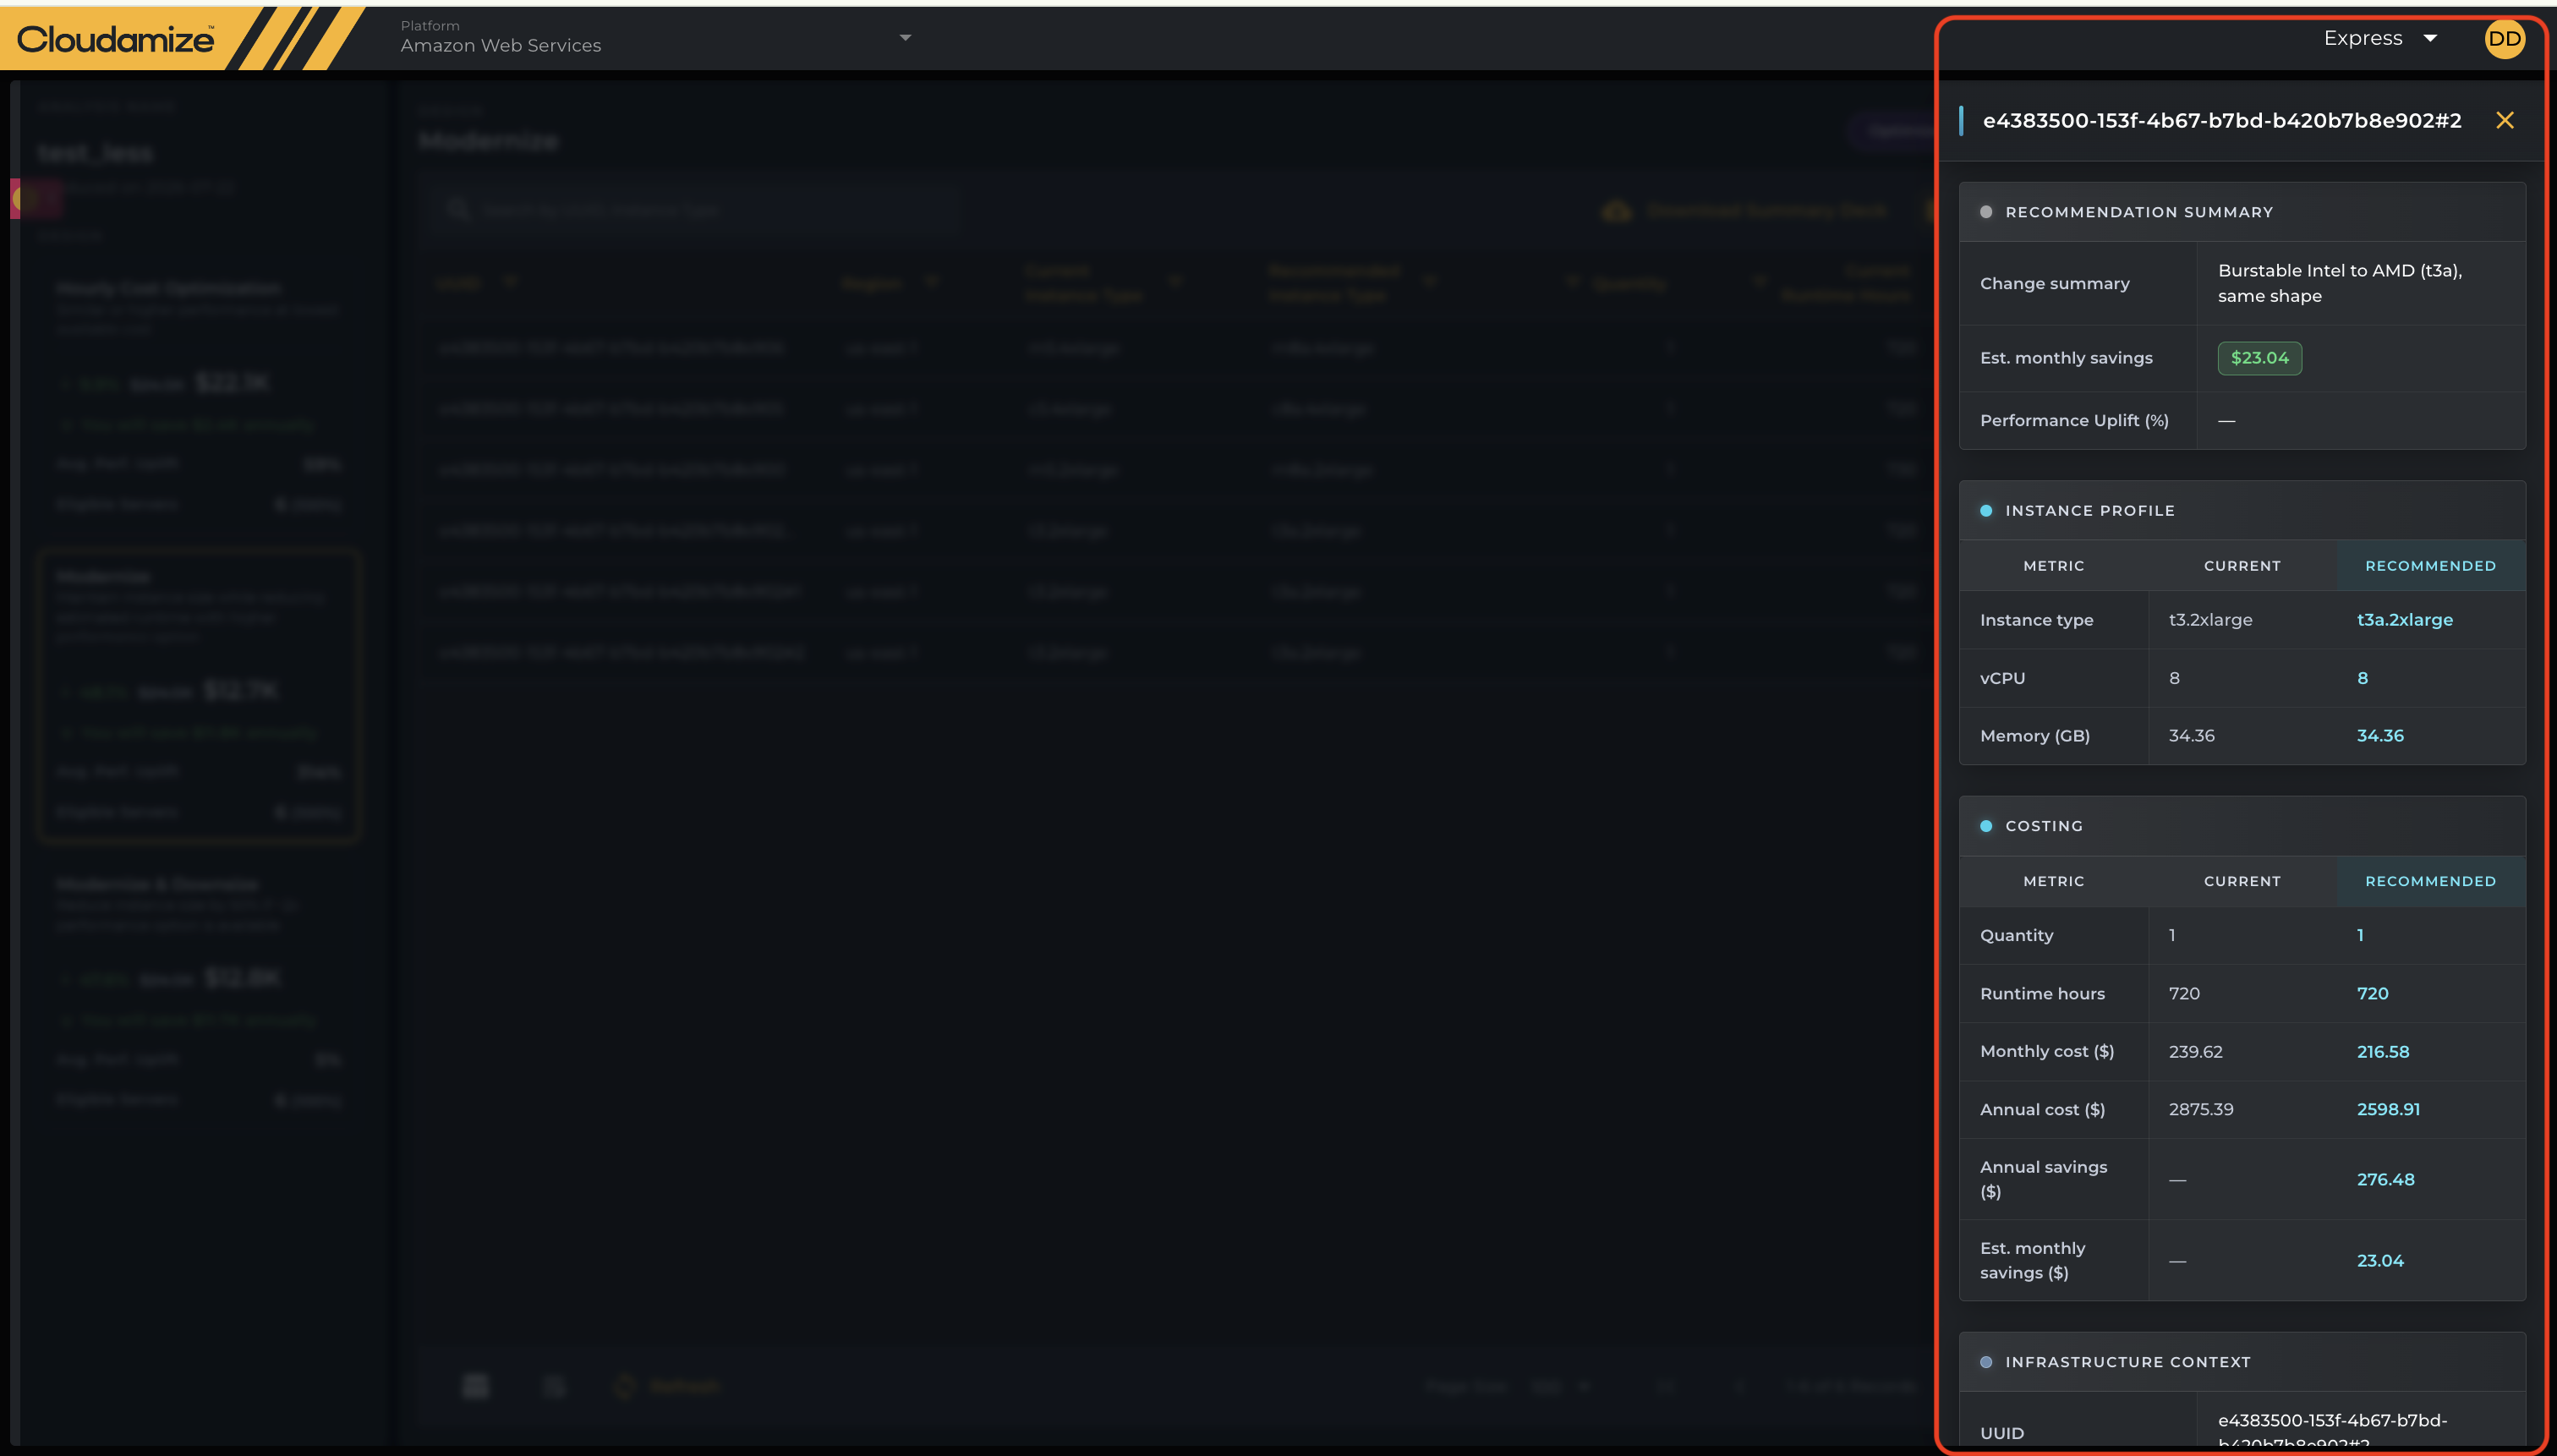
Clicking on any individual row within the main center table expands a detailed right-hand slide-out drawer. This panel breaks down the recommendation details across four primary operational sections:
|
Section |
Parameter / Metric |
Description & Examples |
|
Recommendation Summary |
Change Summary |
Details the specific sizing or architectural migration action (e.g., "Burstable Intel to AMD [t3a], same shape"). |
|
|
Est. Monthly Savings |
Displays the projected monthly cost reduction (e.g., $23.04). |
|
|
Performance Uplift (%) |
Indicates expected performance gains resulting from the hardware or chipset change. |
|
Instance Profile(Current vs. Recommended) |
Instance Type |
Compares current instance shape against the recommended target (e.g., t3.2xlarge → t3a.2xlarge). |
|
|
vCPU |
Displays side-by-side virtual CPU allocation (e.g., 8 vs. 8). |
|
|
Memory (GB) |
Compares RAM allocation side-by-side (e.g., 34.36 vs. 34.36). |
|
Costing(Current vs. Recommended) |
Quantity |
Number of active instances analyzed in this recommendation. |
|
|
Runtime Hours |
Estimated execution duration (e.g., 720 hours). |
|
|
Monthly Cost ($) |
Compares current monthly run-rate against the proposed updated cost. |
|
|
Annual Cost ($) |
Compares total annualized spending before and after optimization. |
|
|
Annual Savings ($) |
Total projected net yearly savings. |
|
|
Est. Monthly Savings ($) |
Net monthly cost reduction for the selected asset. |
|
Infrastructure Context |
UUID |
Unique system identifier assigned to the specific server asset. |
|
|
Updated At |
Timestamp showing when the data snapshot was processed by the engine (e.g., Jul 22, 2026, 4:26 PM). |
Caveat: Burstable Instances: Burstable instances cannot be benchmarked; as a result, performance ratios will not be displayed for these instances.
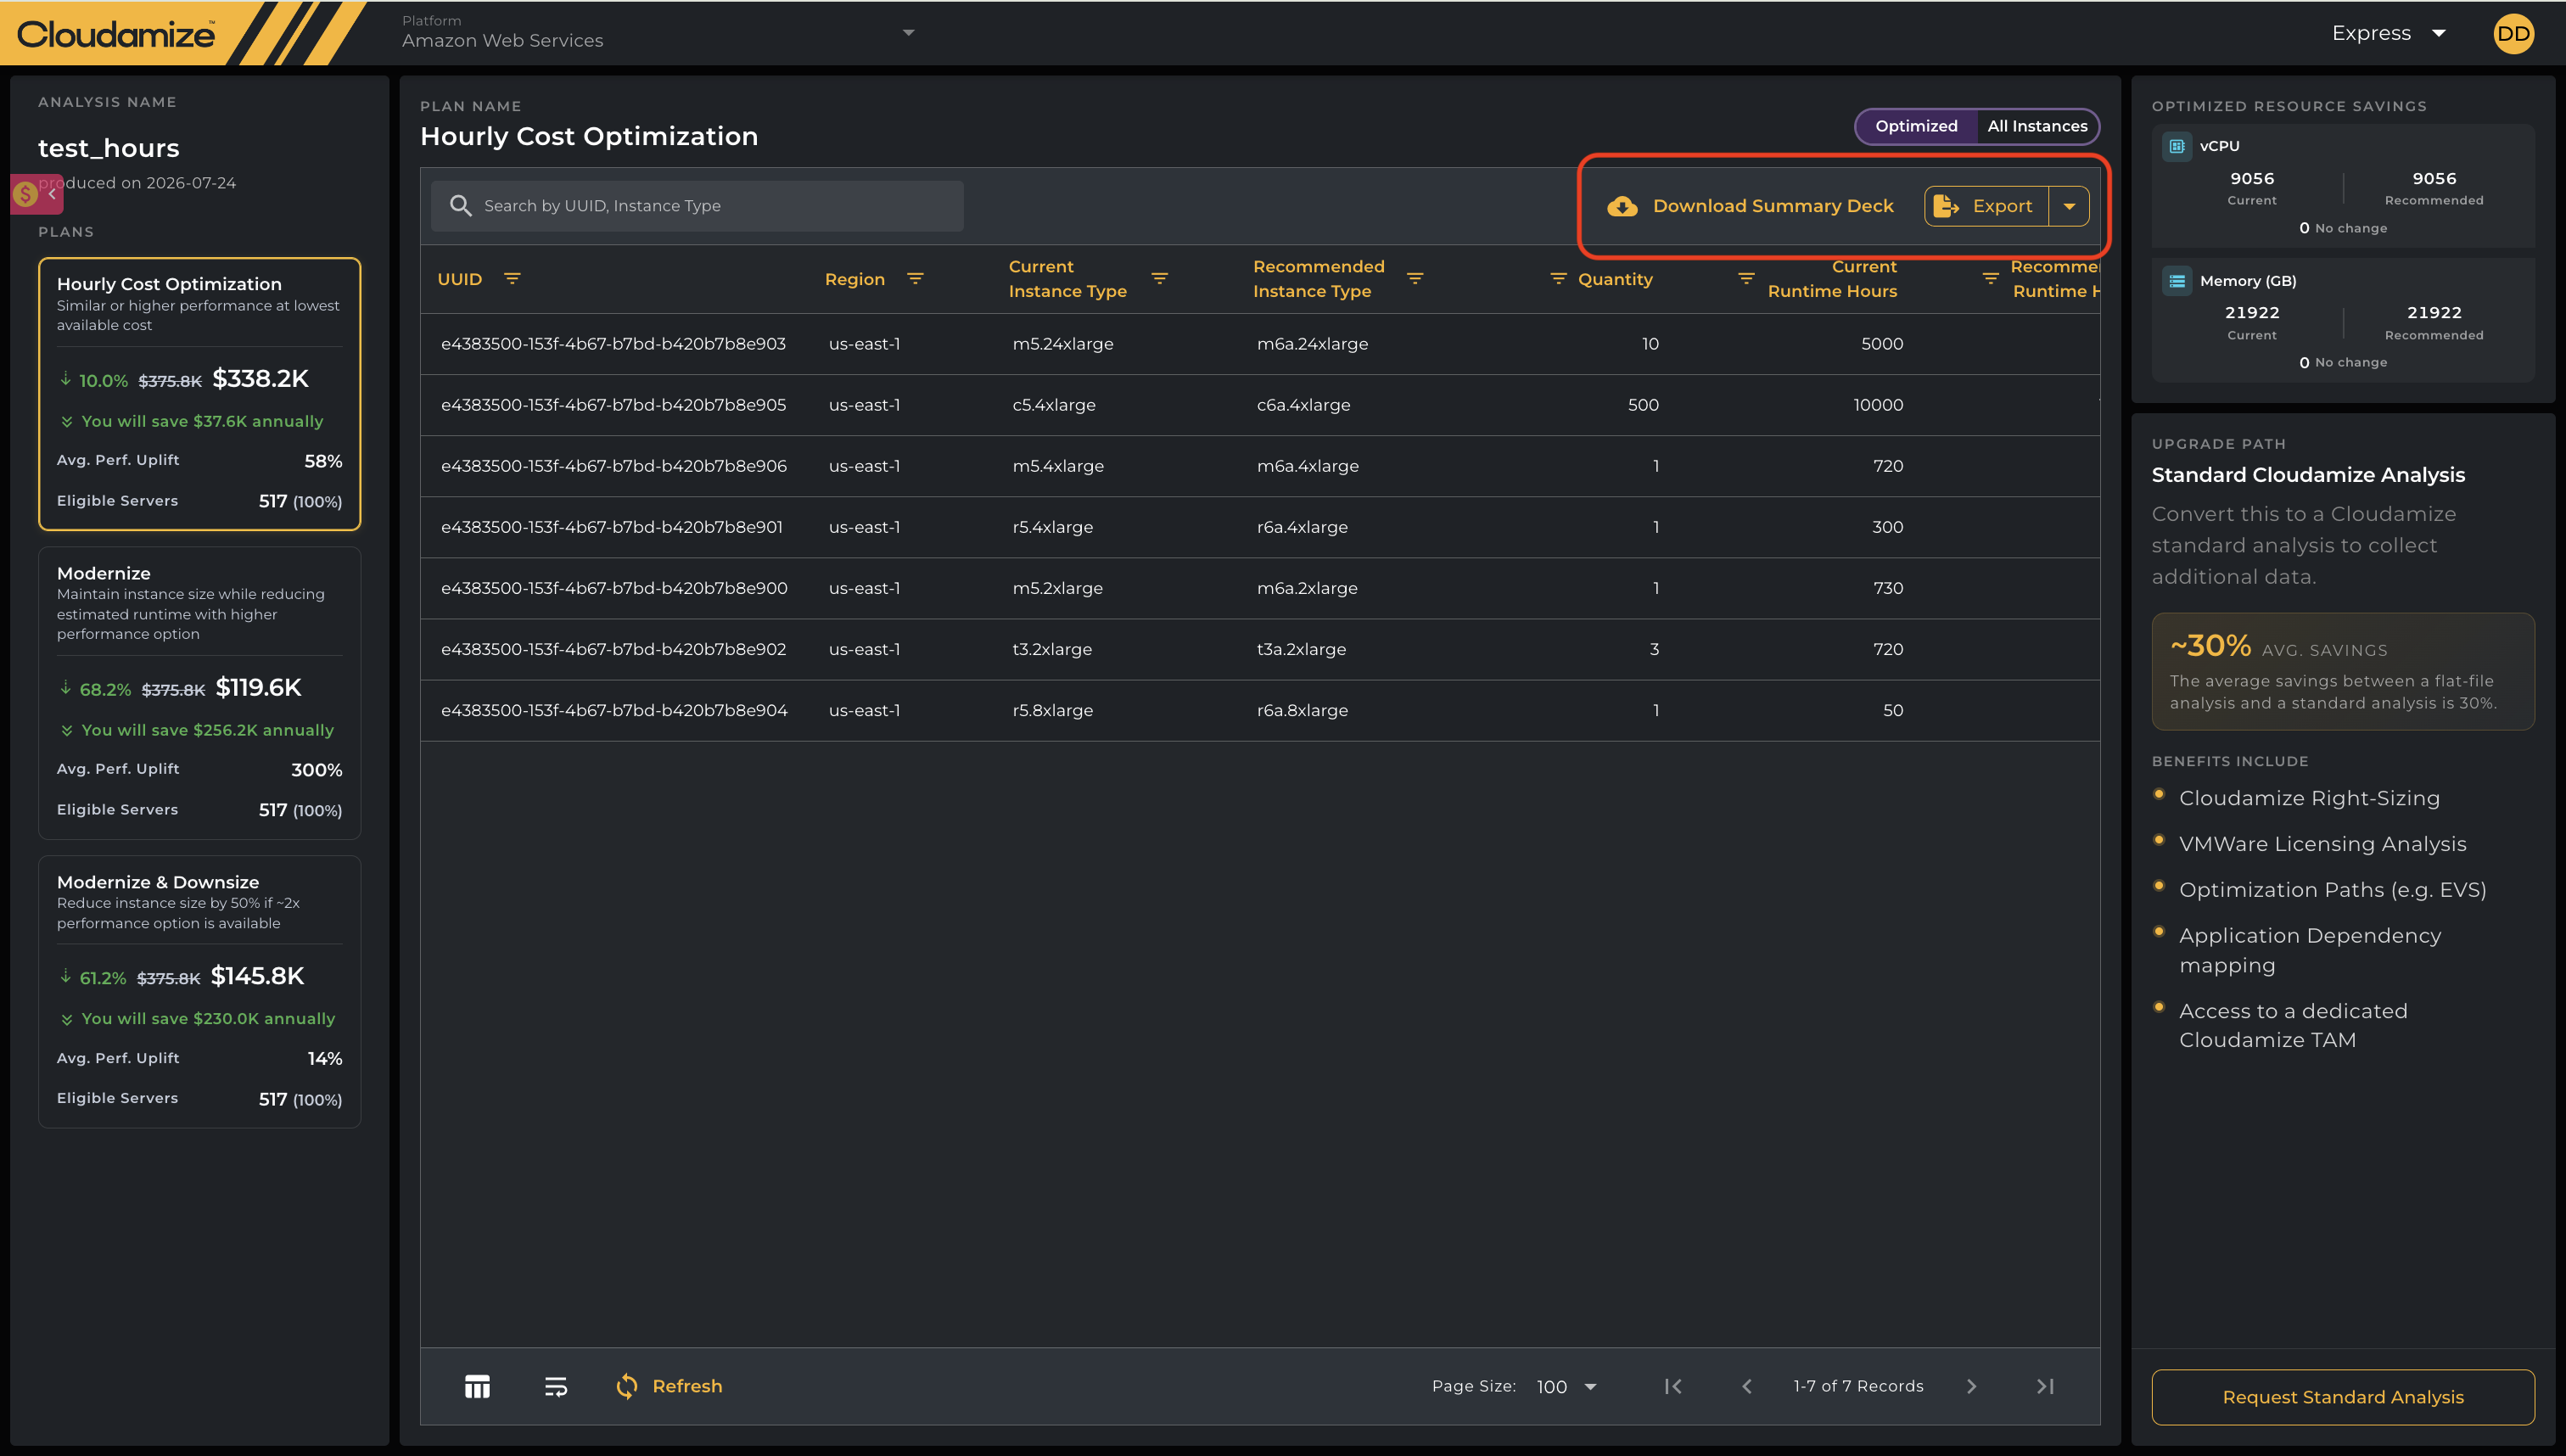
Exporting Your Data: You can click Download Summary Deck to download an executive presentation of your findings, or click Export to grab the raw data sheet.
Re-running an Express Analysis
If your inventory changes, you can upload an updated file and re-run the analysis to refresh the recommendations, without creating a new assessment.
Note: Re-run is available only for unlocked Express assessments.
How to Re-run an Express Analysis
-
Open your unlocked Express assessment.
-
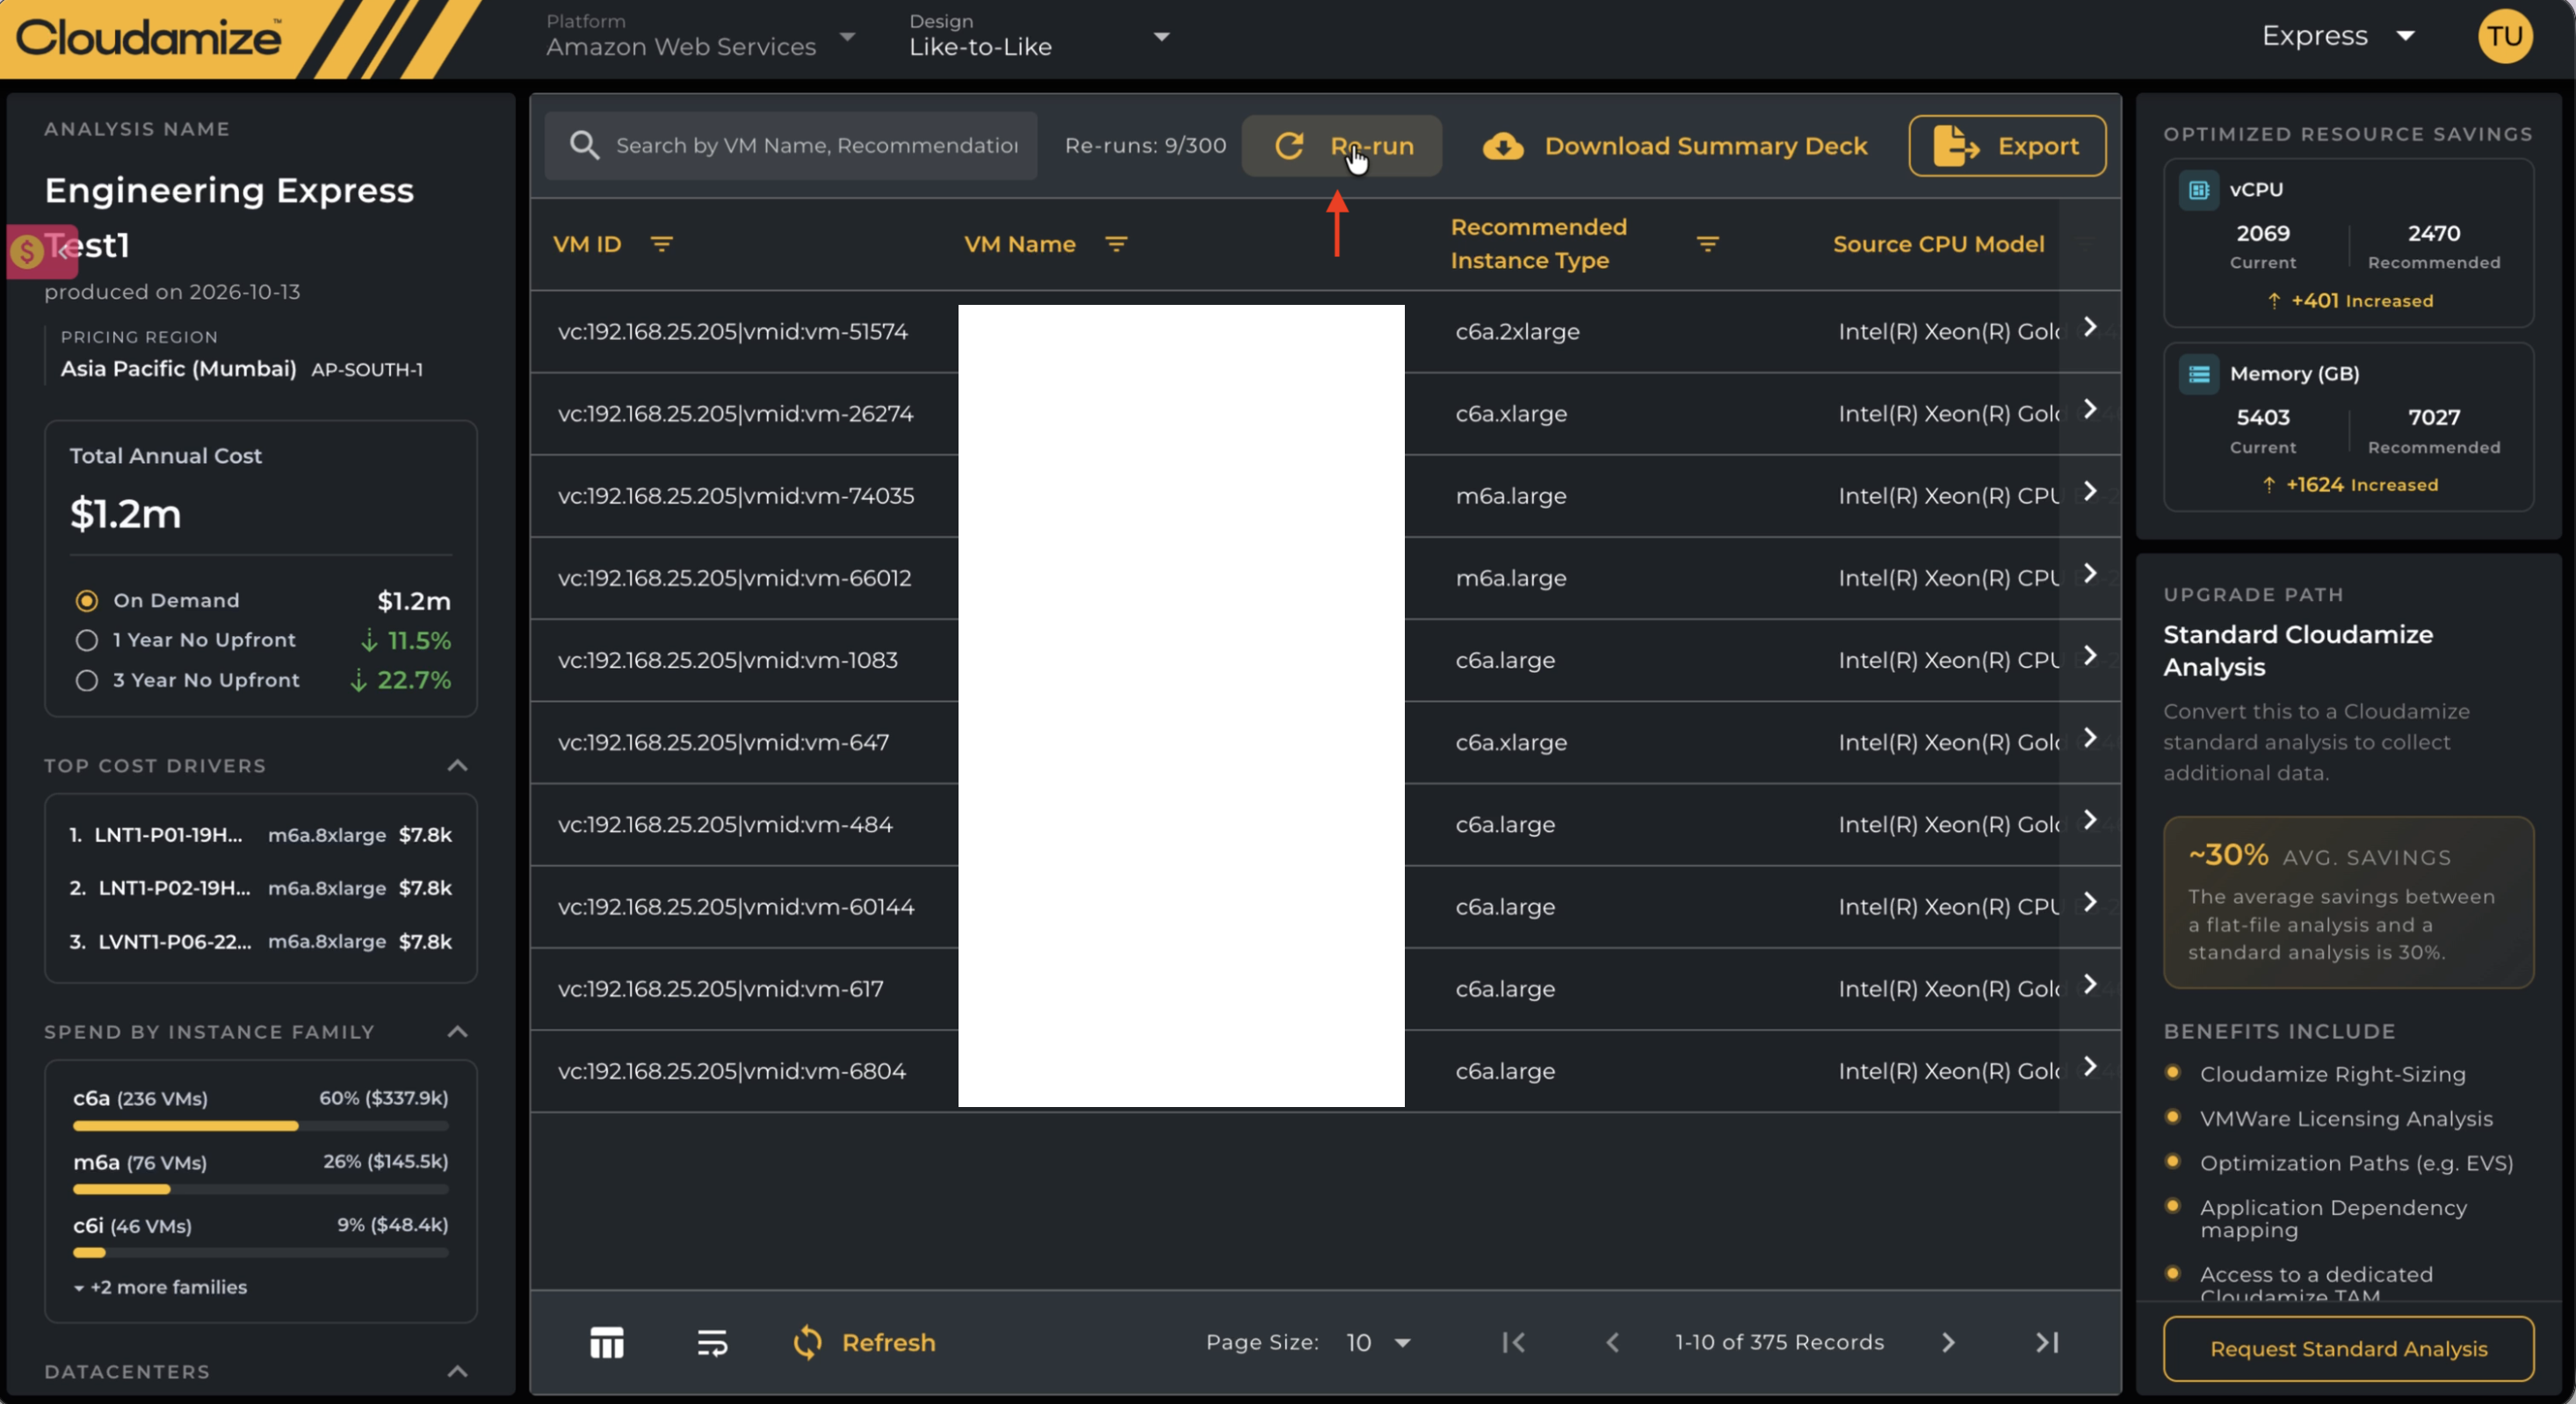
Click Re-run in the top toolbar, next to Download Summary Deck and Export.
-
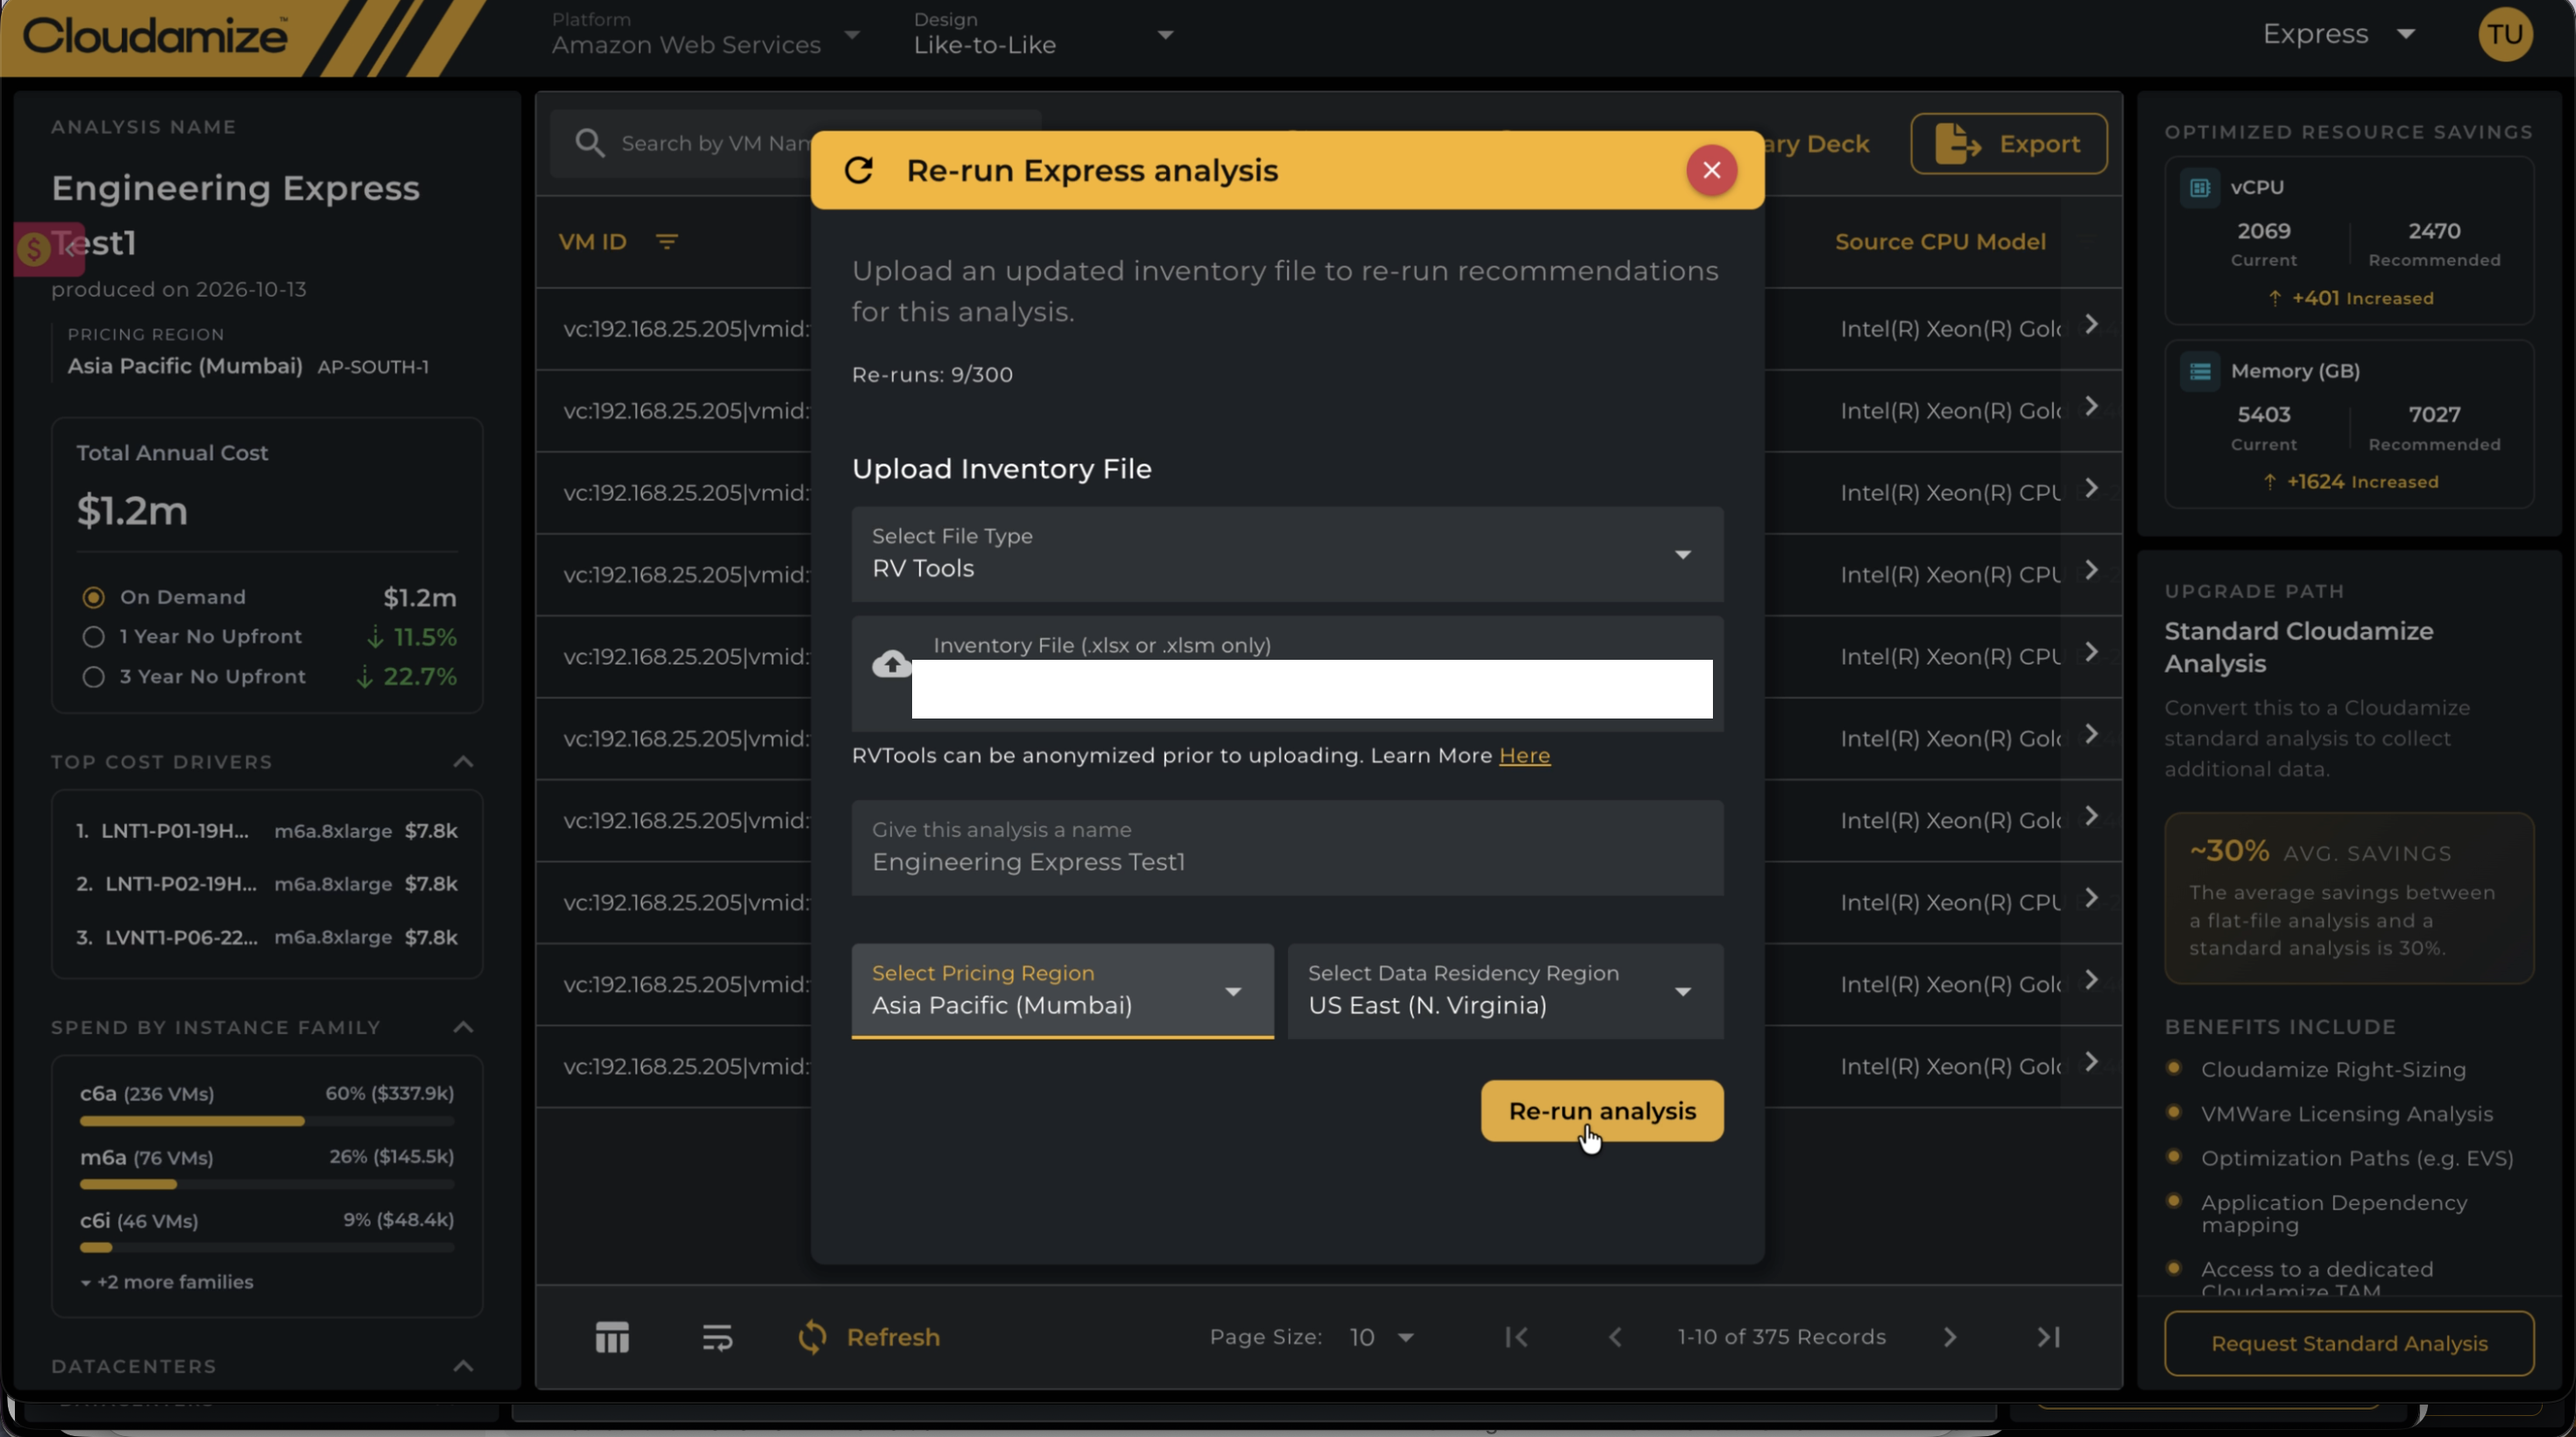
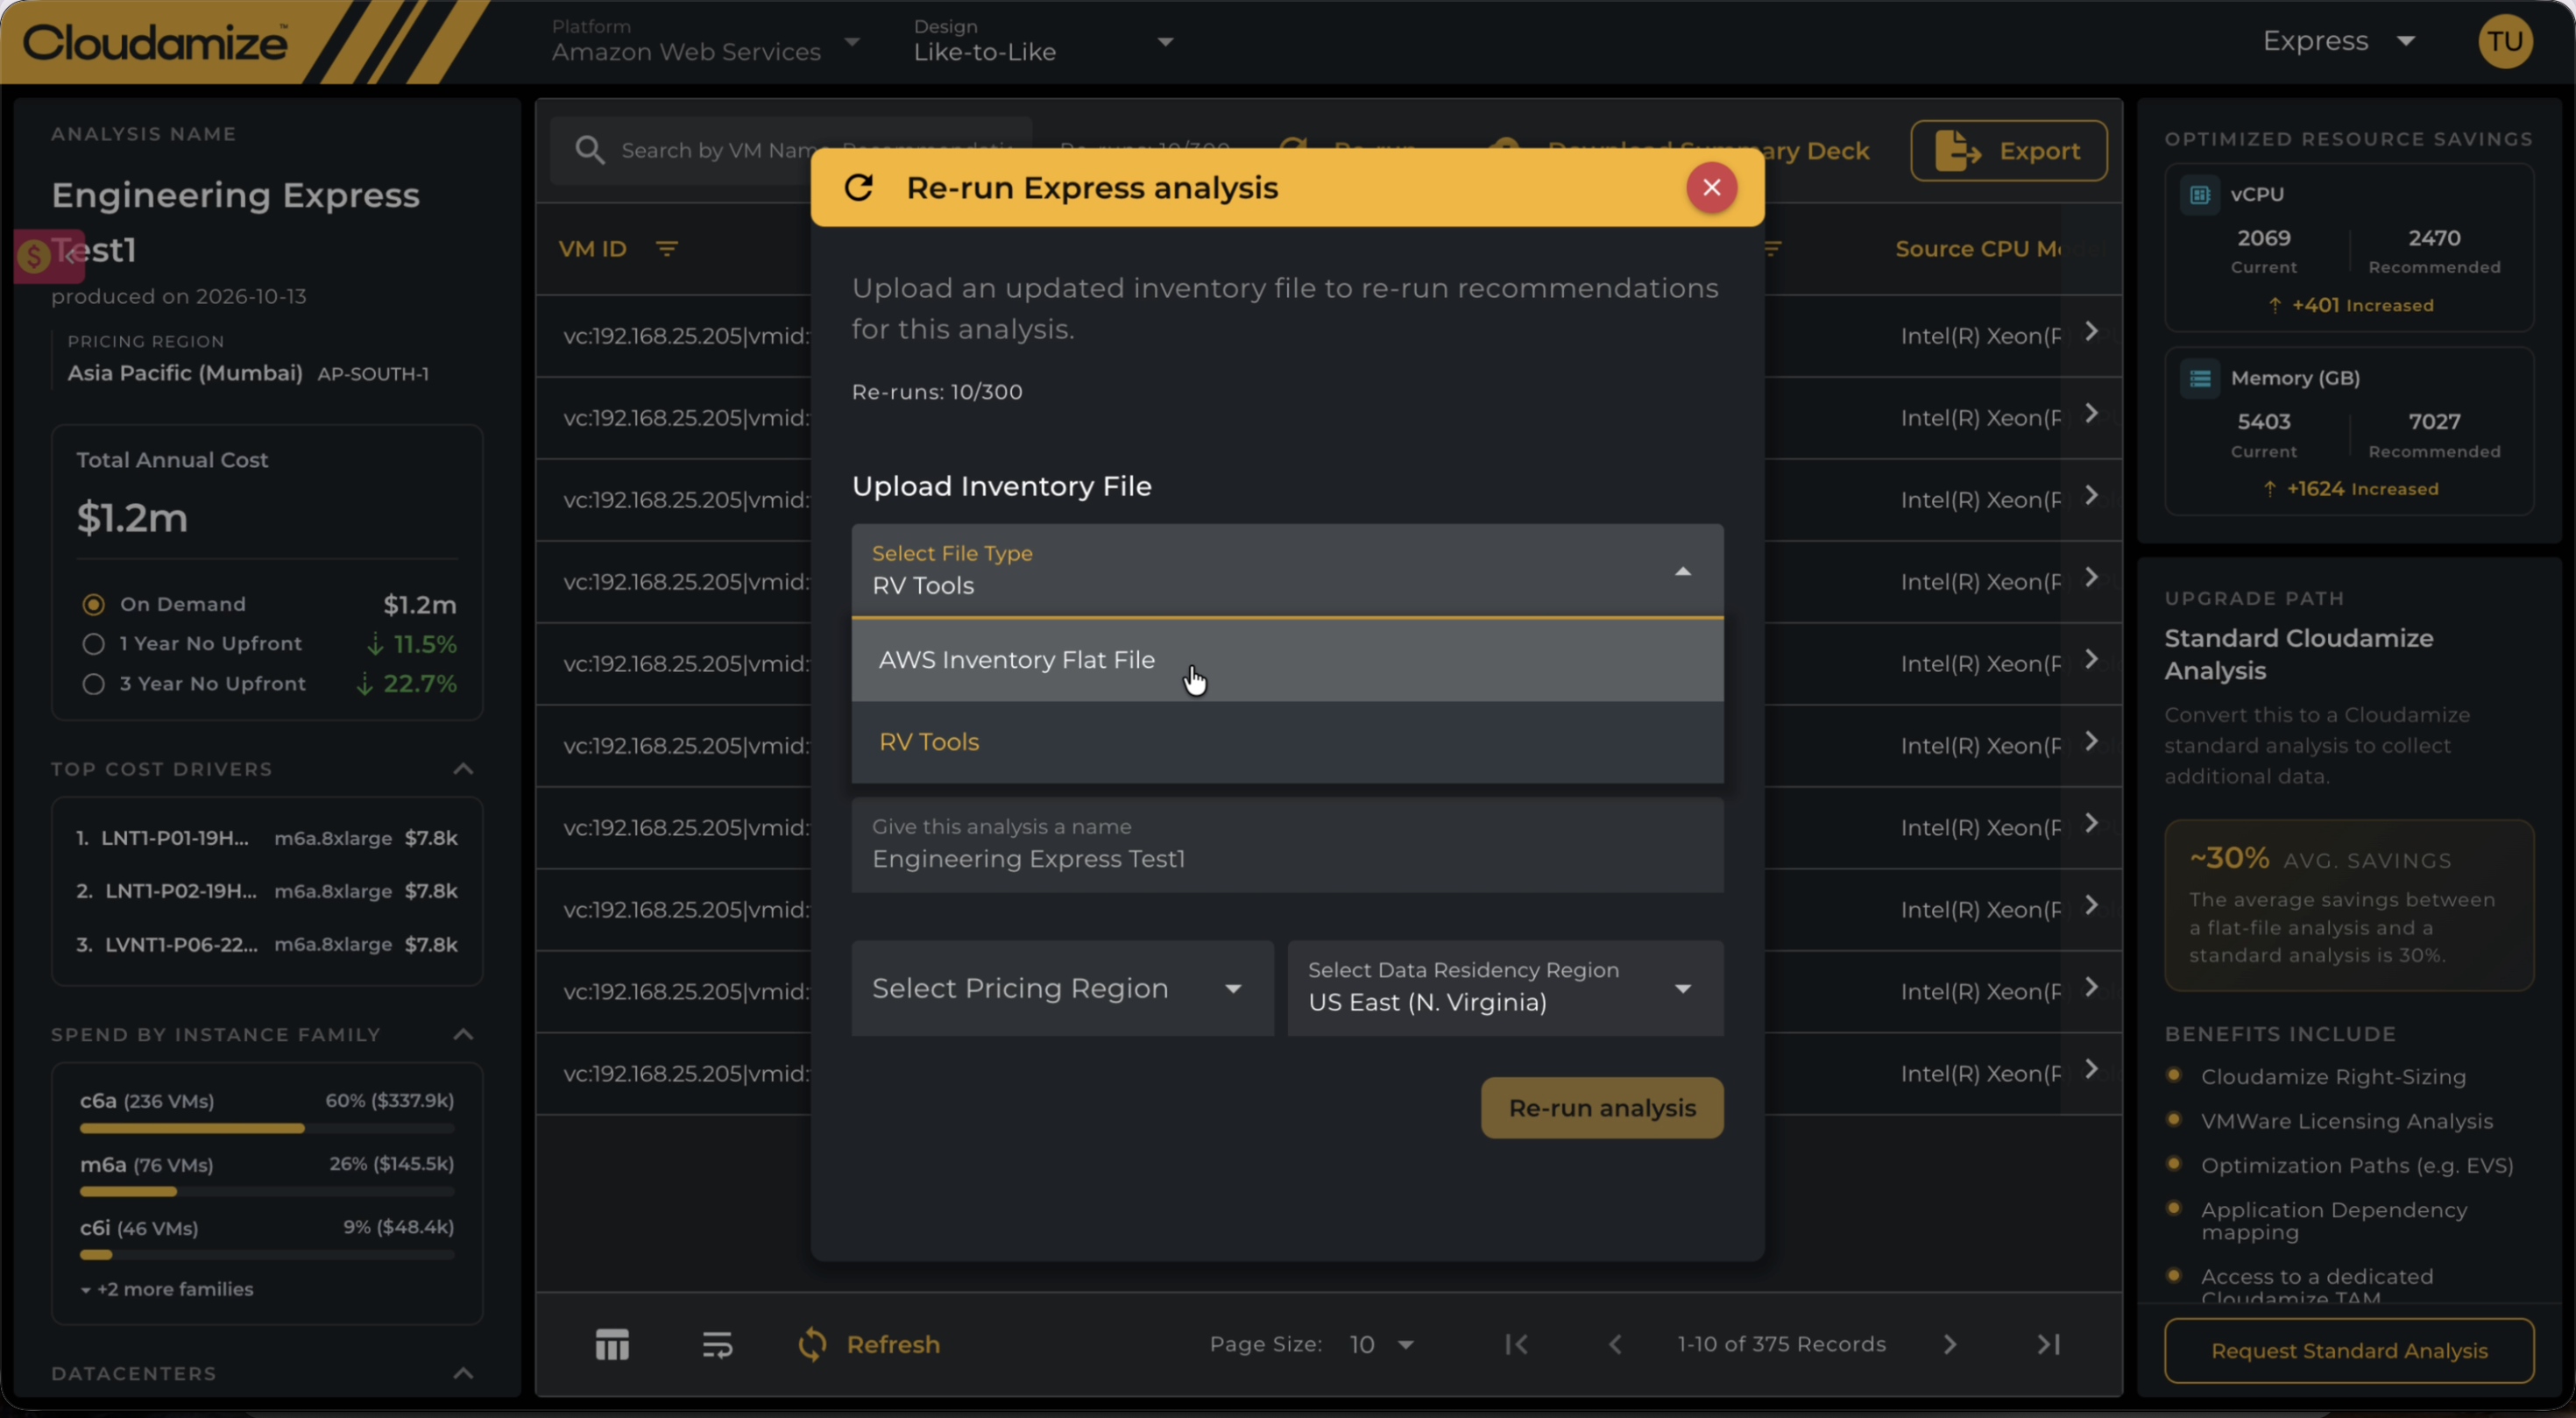
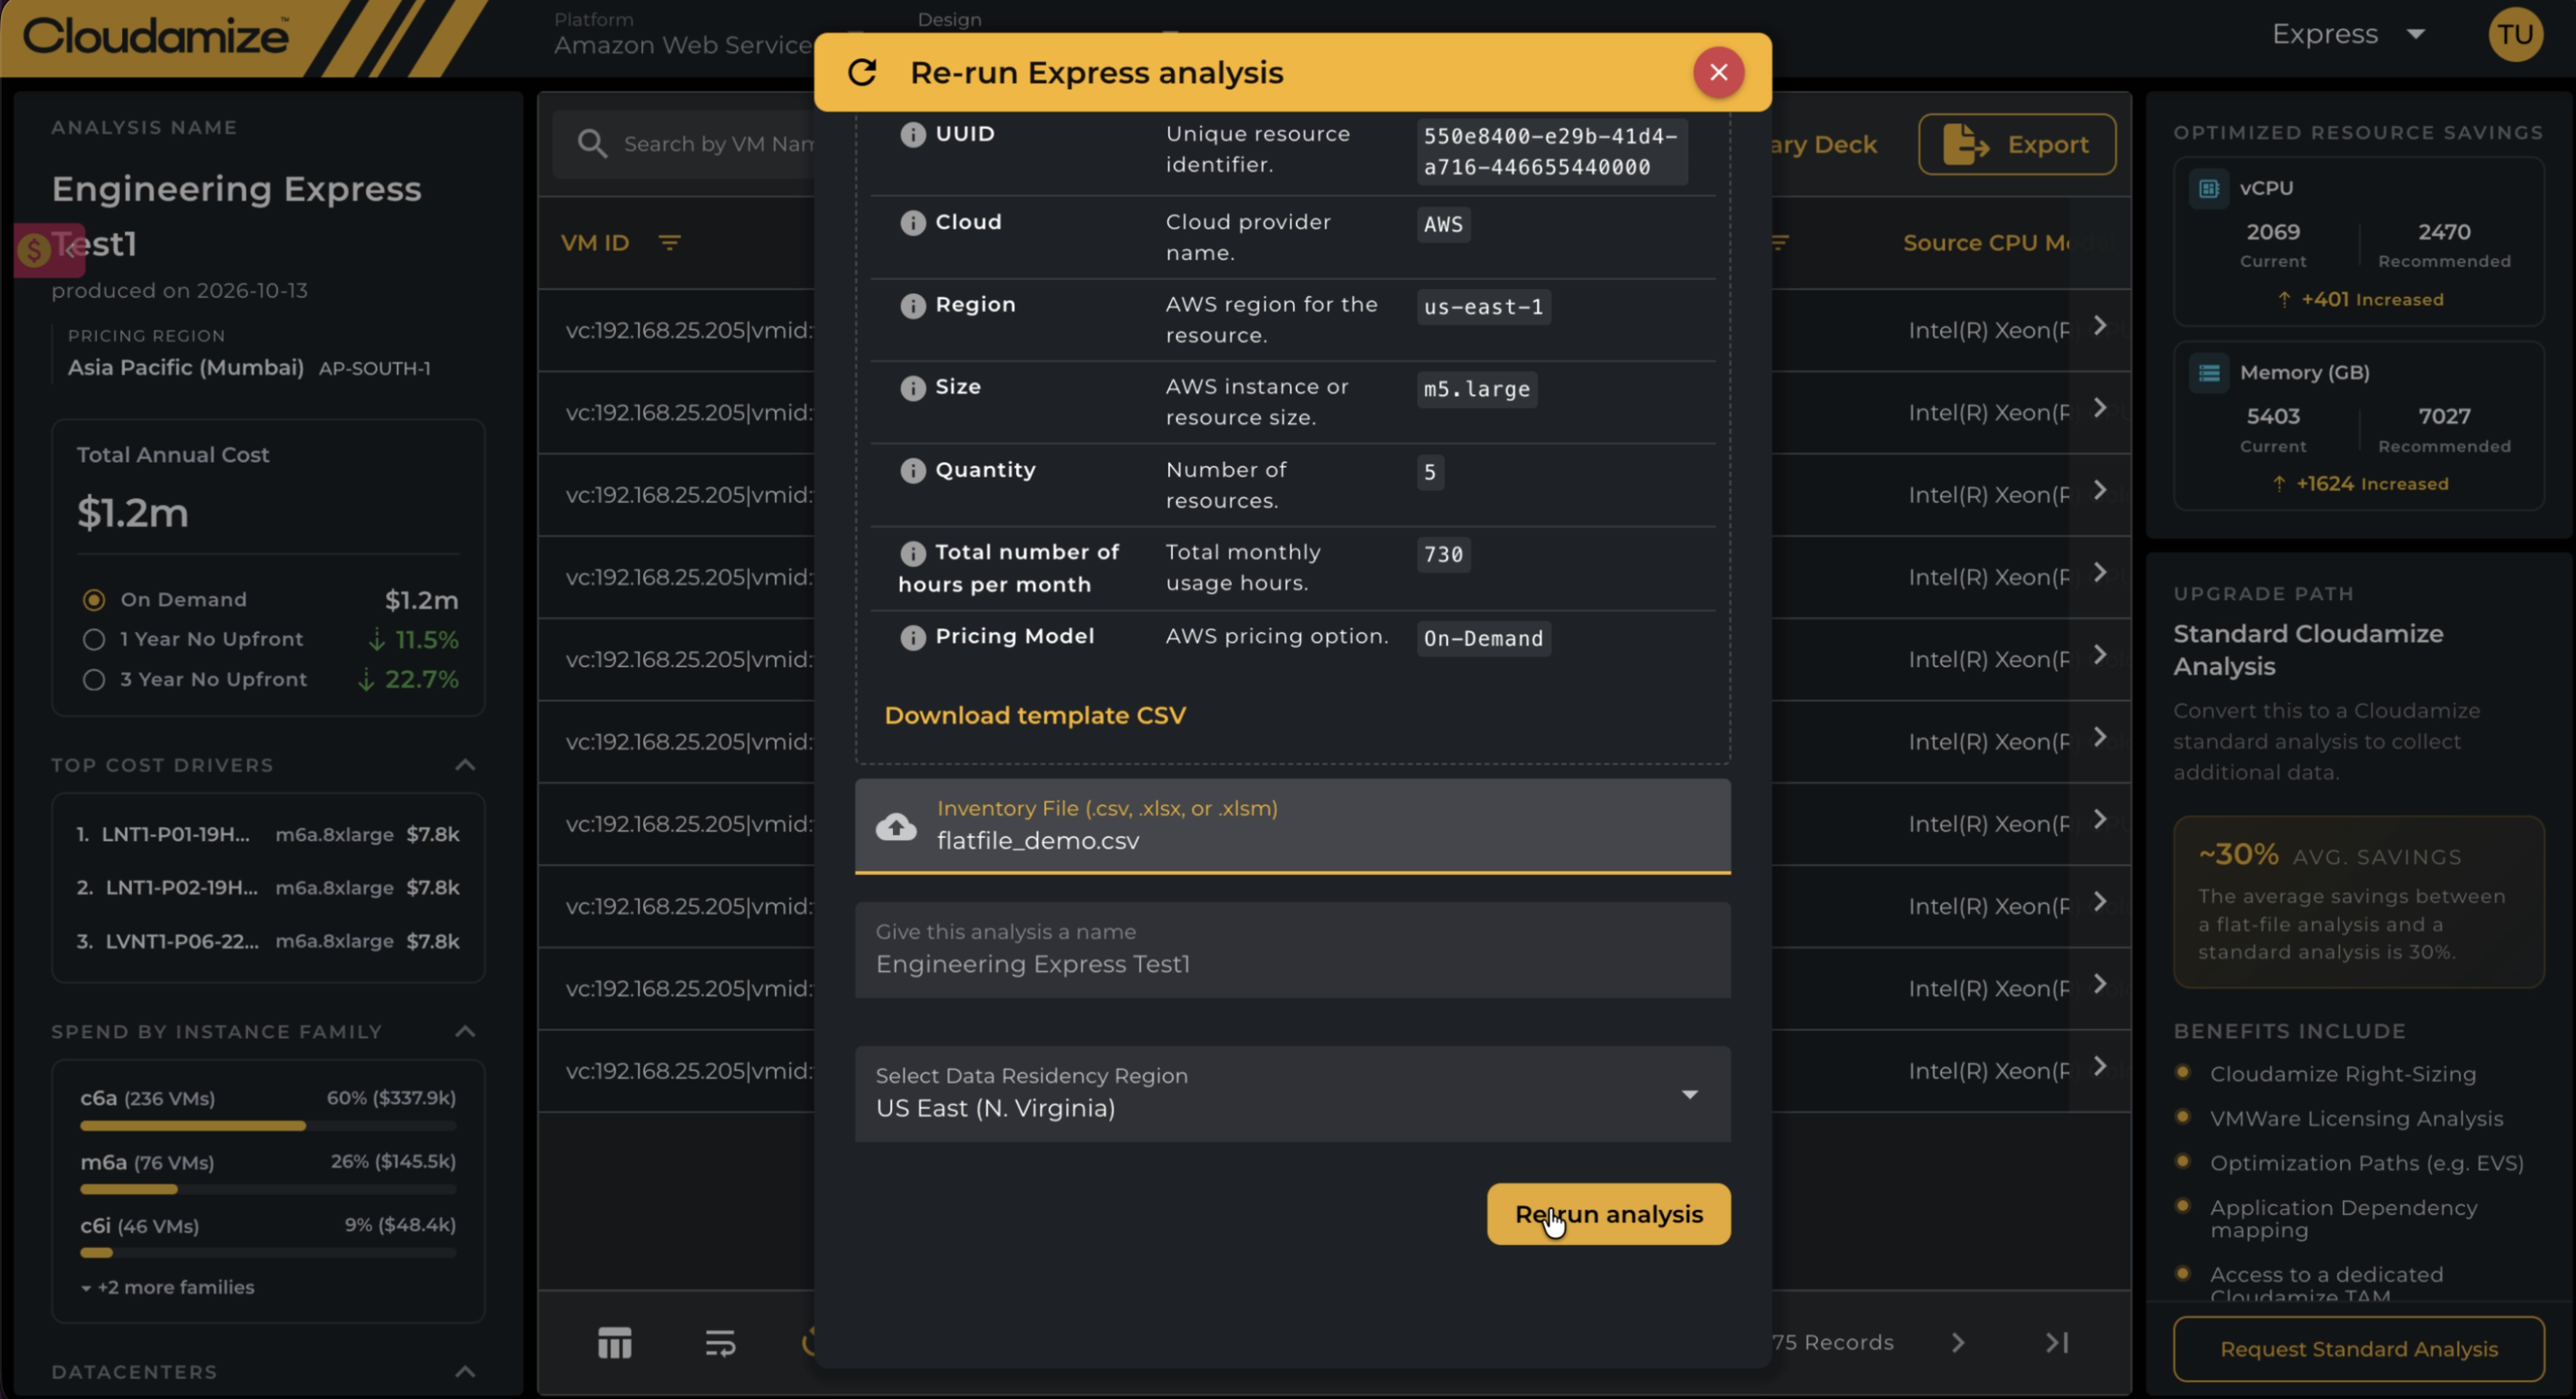
Select your updated inventory file (RV Tools or AWS Inventory Flat file), upload the .xlsx or .xlsm file, enter an analysis name, then select the pricing region and data residency region.
-
Click Re-run Analysis.
After you submit the file, an Inventory uploaded successfully confirmation message appears, and the assessment results refresh with the updated recommendations.
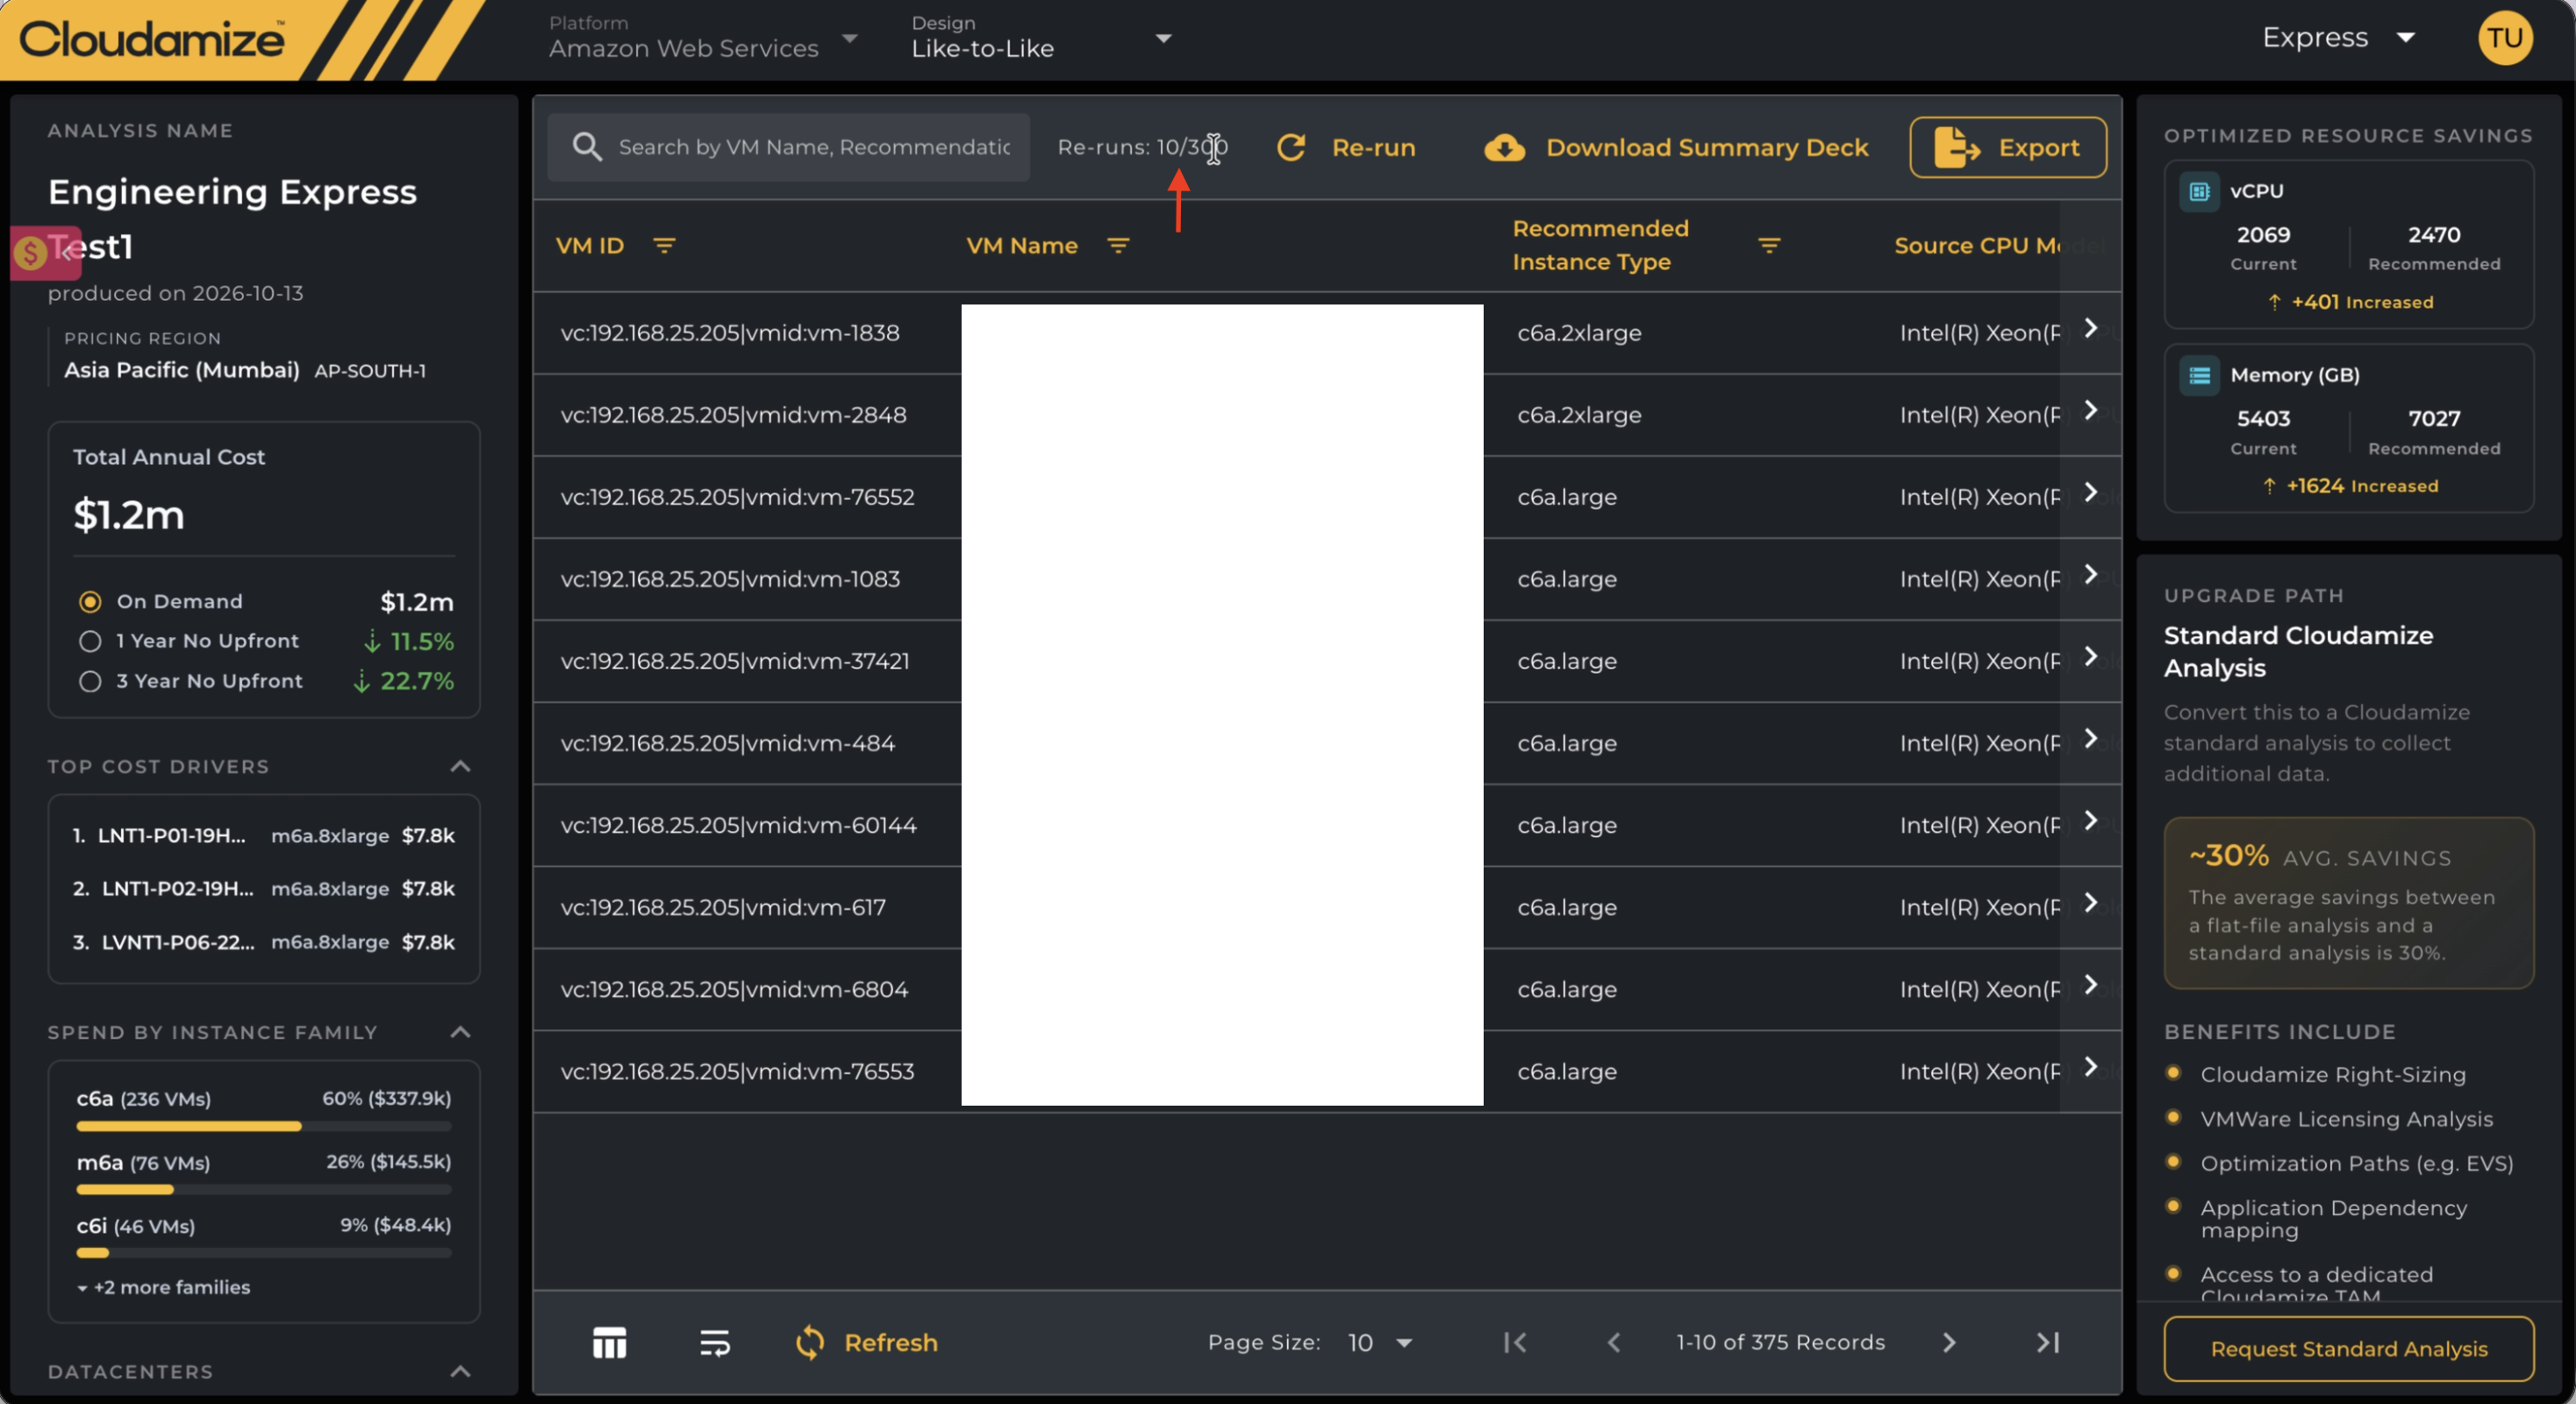
Re-run Counter
The toolbar shows how many re-runs you have used and how many remain (for example, Re-runs: 10 / 300).
-
Re-run limit: The unlock code applied to your assessment determines how many re-runs are available. When the limit is reached, the Re-run button is disabled and displays Re-run limit reached.
-
Repeat uploads: Each upload counts as one re-run, even if you upload the same file again.
Transitioning from Express to Standard Analysis
If your directional Express flat-file results show a significant opportunity and you wish to build a migration-grade blueprint, you can upgrade seamlessly:
-
Click the Convert to Standard button located in the bottom-right corner of the results workspace.
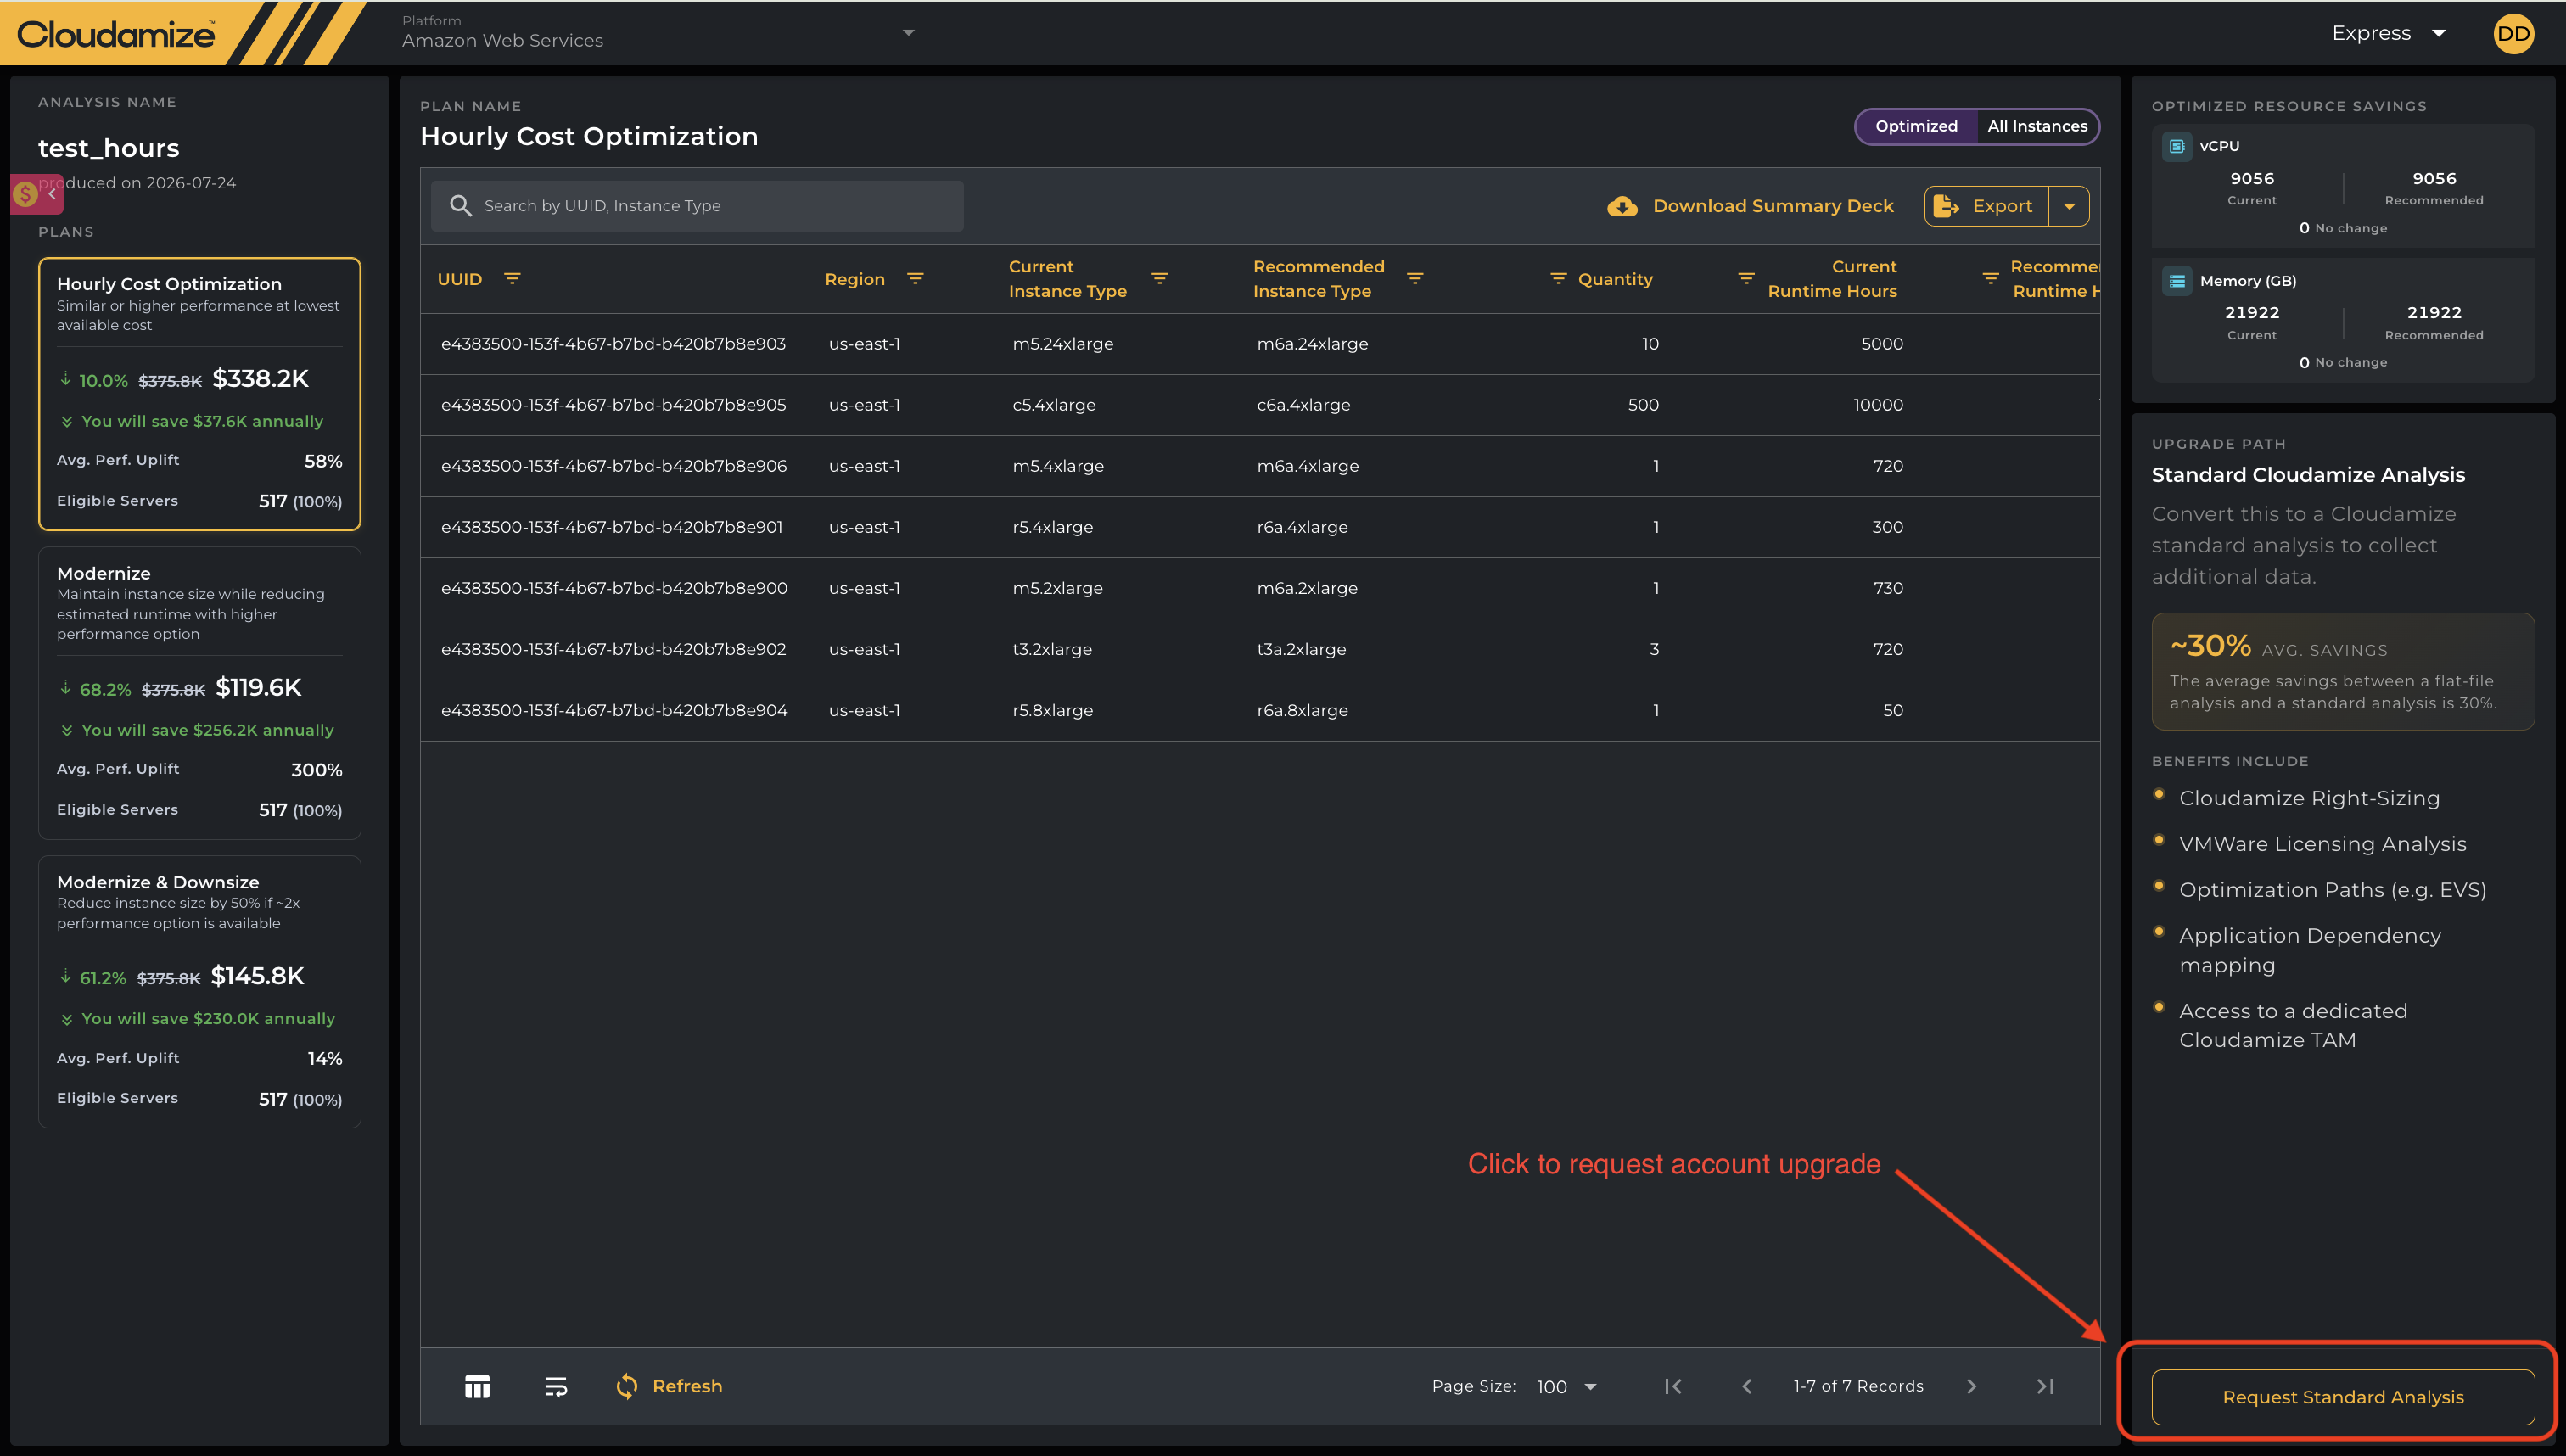
-
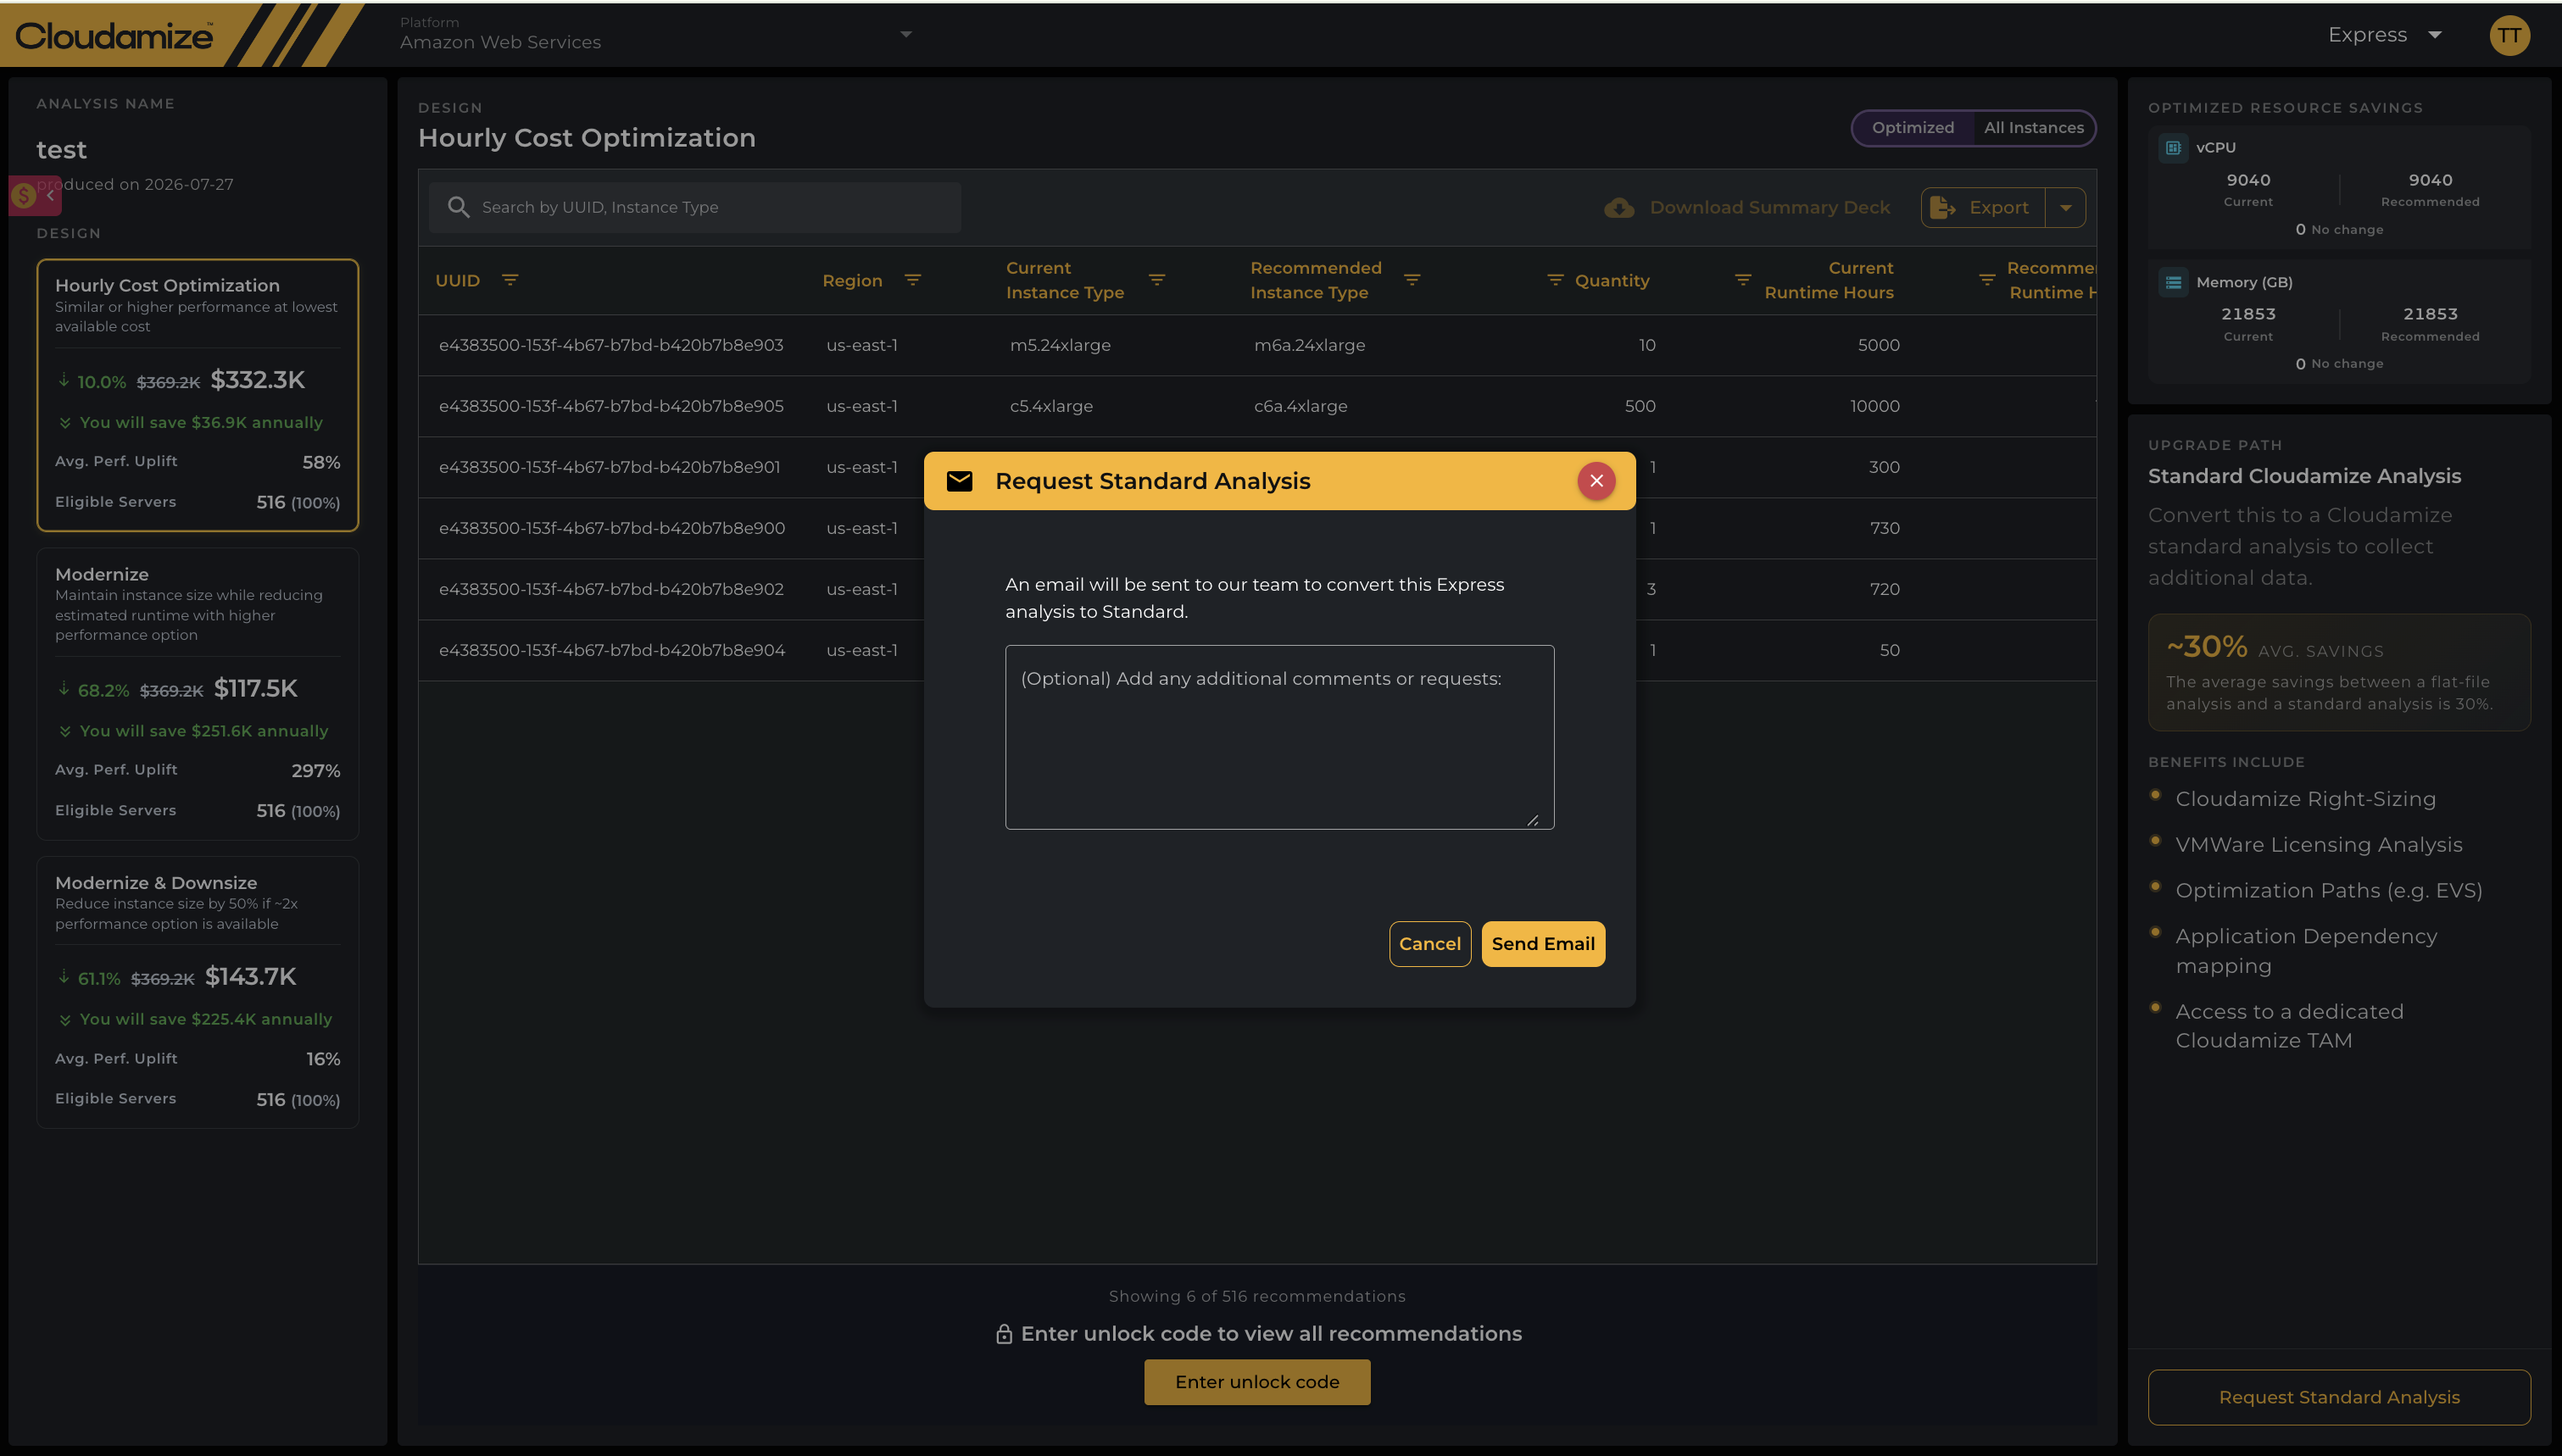
A Convert to Standard modal window will appear.
-
Optional: Add any additional scoping comments or environment requests in the provided text field.
-
Click Send Email. This alerts the Cloudamize architectural team to help route you toward setting up a live Collector assessment.
If you have any queries, please get in touch with the helpdesk via our Helpdesk Portal or by email at helpdesk@cloudamize.com.