

Overview
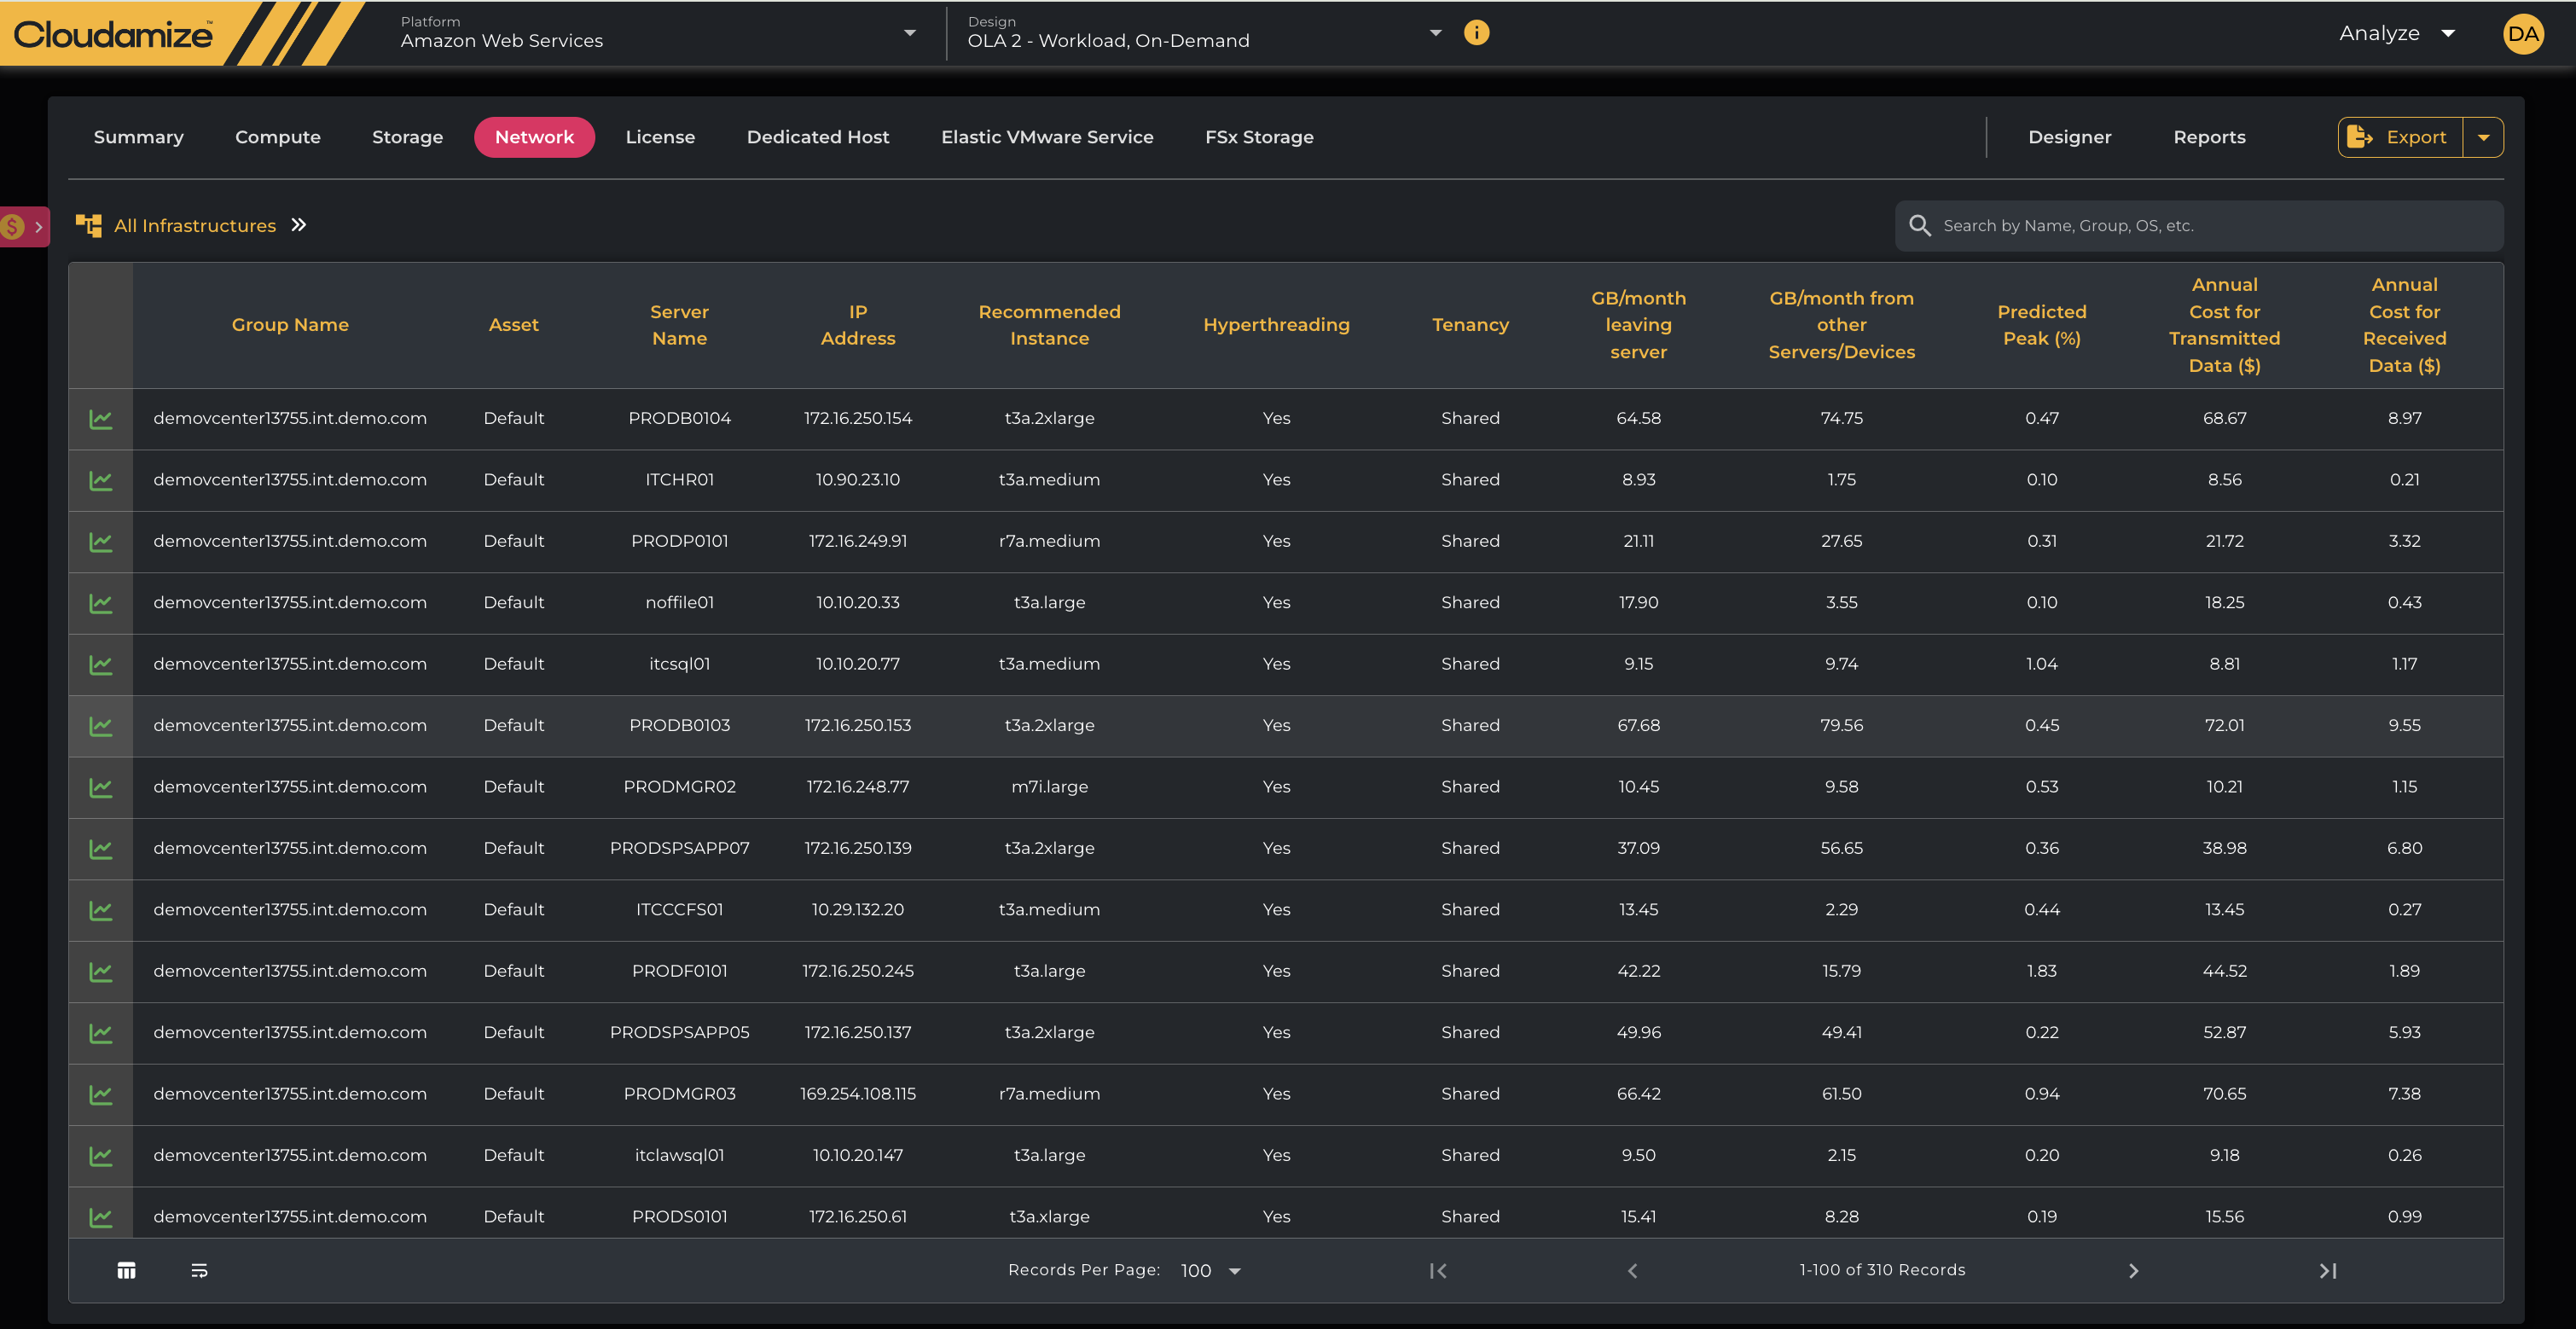
The Network tab in Cloudamize provides a detailed, asset-by-asset breakdown of network traffic and costs. This view is essential for understanding network usage patterns, identifying potential bottlenecks, and projecting network-related costs in a cloud environment.
Note: Currently, Cloudamize treats all traffic as egress by default. Cloudamize is collecting data at the machine level and is only able to capture total data to/from a machine. Cloudamize does not know if the data being sent/received is going to leave the cloud region where the migrated environment is hosted, so Cloudamize takes a conservative approach and assumes all data is leaving the network, and therefore the cost we show is a worst-case scenario.
Detailed Network Asset Table
The main component of this tab is a table that lists network assets and their corresponding metrics. Unlike other tabs, this view focuses on network traffic rather than compute or storage resources.
|
Column Header |
Description |
|
Group Name |
Logical grouping or department assigned to the asset by the user. |
|
Asset |
A unique identifier for the cloud resource (e.g., virtual machine, server). |
|
Server Name |
Hostname of the server. |
|
IP Address |
Server's IP address. |
|
Recommended Instance |
Recommended cloud instance type (e.g., |
|
Hyperthreading |
An indicator of whether hyperthreading is enabled on the physical core, which impacts how logical CPUs are utilized. |
|
Tenancy |
The type of instance tenancy: Shared (runs on hardware shared with other AWS customers) or Dedicated (runs on single-tenant hardware). |
|
GB/month leaving server |
The total amount of data (in gigabytes) transmitted from the server per month (egress traffic). This is a primary driver of cloud network costs. |
|
GB/month from other Servers/Devices |
The total amount of data (in gigabytes) received by the server per month (ingress traffic). This is typically free or low-cost on most cloud providers. |
|
Predicted Peak (%) |
The predicted highest percentage of network utilization for the server. |
|
Annual Cost for Transmitted Data ($) |
The total projected annual cost specifically for data egress (transmitted data), calculated based on cloud provider pricing models. |
|
Annual Cost for Received Data ($) |
The total projected annual cost for data ingress (received data). This cost is usually minimal or zero. |
|
Region |
The specific cloud region (e.g., |
|
Total Cost ($) |
The combined annual projected cost for the entire asset, including compute, storage, and networking. |
|
ID (server name + uid) |
A unique identifier for the server, used for tracking and data integrity. |
The Network tab is vital for a comprehensive TCO analysis. It helps identify servers with high egress traffic, a major cost driver in the cloud, and provides the data necessary to plan network architecture and accurately budget for cloud networking.
If you have any queries, please get in touch with the helpdesk via our Helpdesk Portal or by email at helpdesk@cloudamize.com.