

Overview
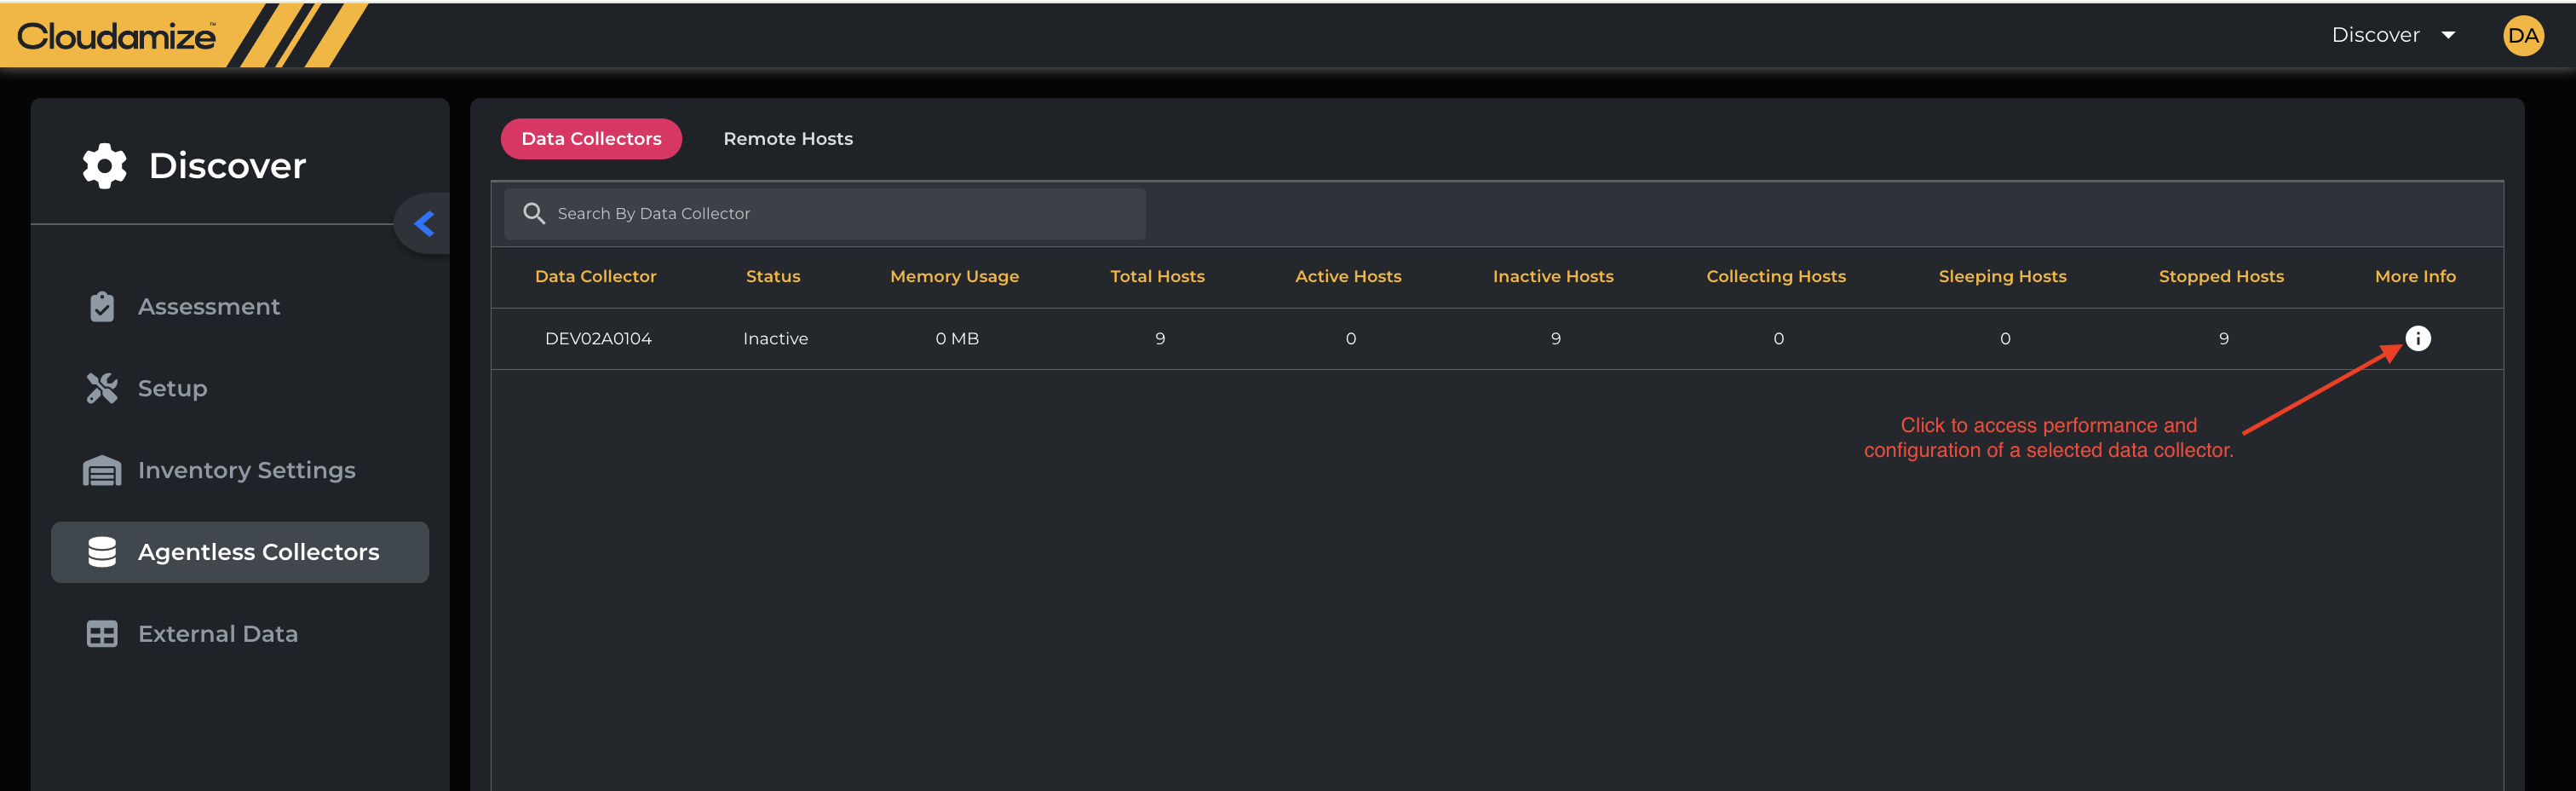
This tab provides a high-level overview of the data collectors you have configured. It shows their status and resource usage.
Details:
|
Columns Name |
Description |
|---|---|
|
Data Collector |
The name of the data collector instance. |
|
Status |
The current operational status of the collector (e.g., |
|
Memory Usage |
The amount of memory the collector is using. |
|
Total Hosts |
The total number of hosts this collector is configured to monitor. |
|
Active Hosts |
The number of hosts that are currently reachable and being assessed. |
|
Inactive Hosts |
The number of hosts that are not currently reachable. |
|
Collecting Hosts |
The number of hosts from which the collector is actively gathering data. |
|
Sleeping Hosts |
The number of hosts that are in a "sleeping" or paused state. |
|
Stopped Hosts |
The number of hosts that have been configured to be monitored by this collector but are currently stopped or turned off. |
-
More Info (Icon): Clicking this icon provides additional details about the specific data collector.
Agentless Data Collector Details (More Info)
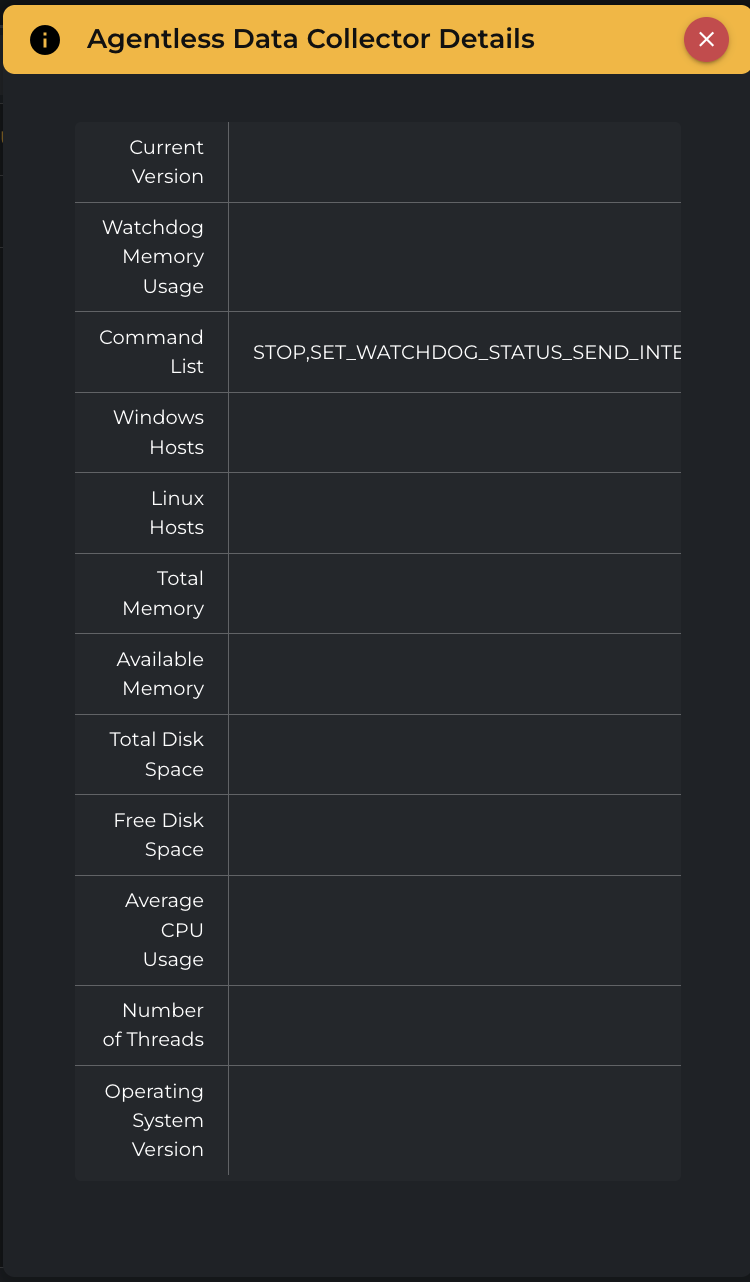
This pop-up provides an in-depth look at the performance and configuration of a selected data collector.
|
Columns Name |
Description |
|---|---|
|
Current Version |
The version number of the data collector software. |
|
Watchdog Memory Usage |
The amount of memory being consumed by the watchdog service, which monitors the health of the collector. |
|
Command List |
A list of commands supported by the collector, such as |
|
Windows Hosts |
The number of Windows hosts currently being monitored by this collector. |
|
Linux Hosts |
The number of Linux hosts currently being monitored by the collector. |
|
Total Memory |
The total amount of RAM available on the machine where the collector is running. |
|
Available Memory |
The amount of free RAM available on the machine. |
|
Total Disk Space |
The total storage capacity of the disk where the collector is installed. |
|
Free Disk Space |
The amount of available storage on the disk. |
|
Average CPU Usage |
The average CPU utilization of the collector process. |
|
Number of Threads |
The number of active threads the collector process is using. |
|
Operating System Version |
The version of the operating system on which the collector is installed. |
If you have any queries, please get in touch with the helpdesk via our Helpdesk Portal or by email at helpdesk@cloudamize.com.