

Overview
The Amazon FSx service offers fully managed, high-performance file systems designed to replace or extend customers' on-premises file storage. Cloudamize provides advanced analytics to automatically analyze your on-premises environment and generate optimized migration recommendations for Amazon FSx for NetApp ONTAP (FSxN).
This page describes the FSxN tab, which appears in every assessment and compares FSxN vs. EBS pricing for your EC2 data volumes based on standard Agent/Agentless telemetry. This is different from the separate FSx Recommendation for NetApp Report, which requires a dedicated NetApp ONTAP data collection (via the Agentless Data Collector connecting directly to your NetApp ONTAP systems) and sizes a full migration of your on-premises NetApp environment to FSxN. If you're not sure which one you're looking at, see the comparison below.
|
|
FSxN tab |
FSx Recommendation for NetApp Report |
|---|---|---|
|
Data source |
Standard Agent/Agentless telemetry |
Agentless Data Collector connected directly to NetApp ONTAP systems (v9.6+) |
|
Included in every assessment? |
Yes |
No, requires separate NetApp data collection |
|
Scope |
Data volumes on servers already in the assessment (root/boot volumes excluded must stay on EBS) |
Can include NetApp storage even if not otherwise part of the assessment |
|
Sizing basis |
Used capacity and performance demand of the volume, as observed |
Current on-premises NetApp system configuration |
|
Requires a confirmed NetApp backend? |
No |
Yes |
What is Supported?
Cloudamize evaluates qualifying on-premises storage workloads—such as Linux/Unix file systems (NFS), high-performance NAS environments, block storage via iSCSI, and existing NetApp configurations—and generates optimized storage recommendations for FSxN deployments.
Data Collection
Cloudamize collects all necessary performance and telemetry data for FSxN migrations using its standard Agent and Agentless Data Collectors. No additional configuration, specialized tooling, or separate tracking permissions are required.
How it Works
-
Workload Identification: On-premises volumes and file shares matching NetApp ONTAP deployment profiles are automatically flagged for FSxN analytics.
-
TCO Optimization: Recommendations are formulated by mapping performance profiles, capacity requirements, IOPS, and throughput characteristics against AWS FSxN architecture constraints.
-
Reporting: The final Total Cost of Ownership (TCO) results model these services side-by-side with standard EC2 compute and storage pricing to identify structural cost savings.
How FSxN Recommendations Are Sized
Cloudamize sizes FSxN recommendations using NetApp's Best Practices for Designing and Sizing FSx for ONTAP guide (V1.4). The key sizing assumptions are:
-
Storage efficiency: Sizing assumes 45% storage efficiency (previously 40%), so less SSD capacity is typically required.
-
Performance sizing: Throughput and IOPS are based on the average across the full data collection window, rather than the busiest day.
-
Throughput: Throughput is sized as NetApp specifies, with no additional weighting applied to writes.
-
Volumes without performance data: Minimum throughput values are applied to volumes that have no performance data, so they are not under-provisioned.
When FSxN is Recommended
Each FSxN file system has a minimum of 1 TiB of SSD storage. Cloudamize checks this minimum against only the volumes that cost less on FSxN than on EBS.
-
If those volumes reach the minimum on their own, FSxN is recommended for the whole file system. This keeps your storage together on one platform, and adding further volumes to an existing file system adds little cost.
-
If they do not reach the minimum, FSxN is not recommended for that file system, and its volumes remain on EBS.
What it Looks Like
The Assessment Details screen and its corresponding downloadable reports feature structural layouts optimized for usability. Column-level filters are available across all tables, allowing users to quickly segment, search, and parse assets.
Dashboard Visibility
The Analyze dashboard summary panel dynamically updates overall project TCO and storage metrics based on your selected Design Profile.
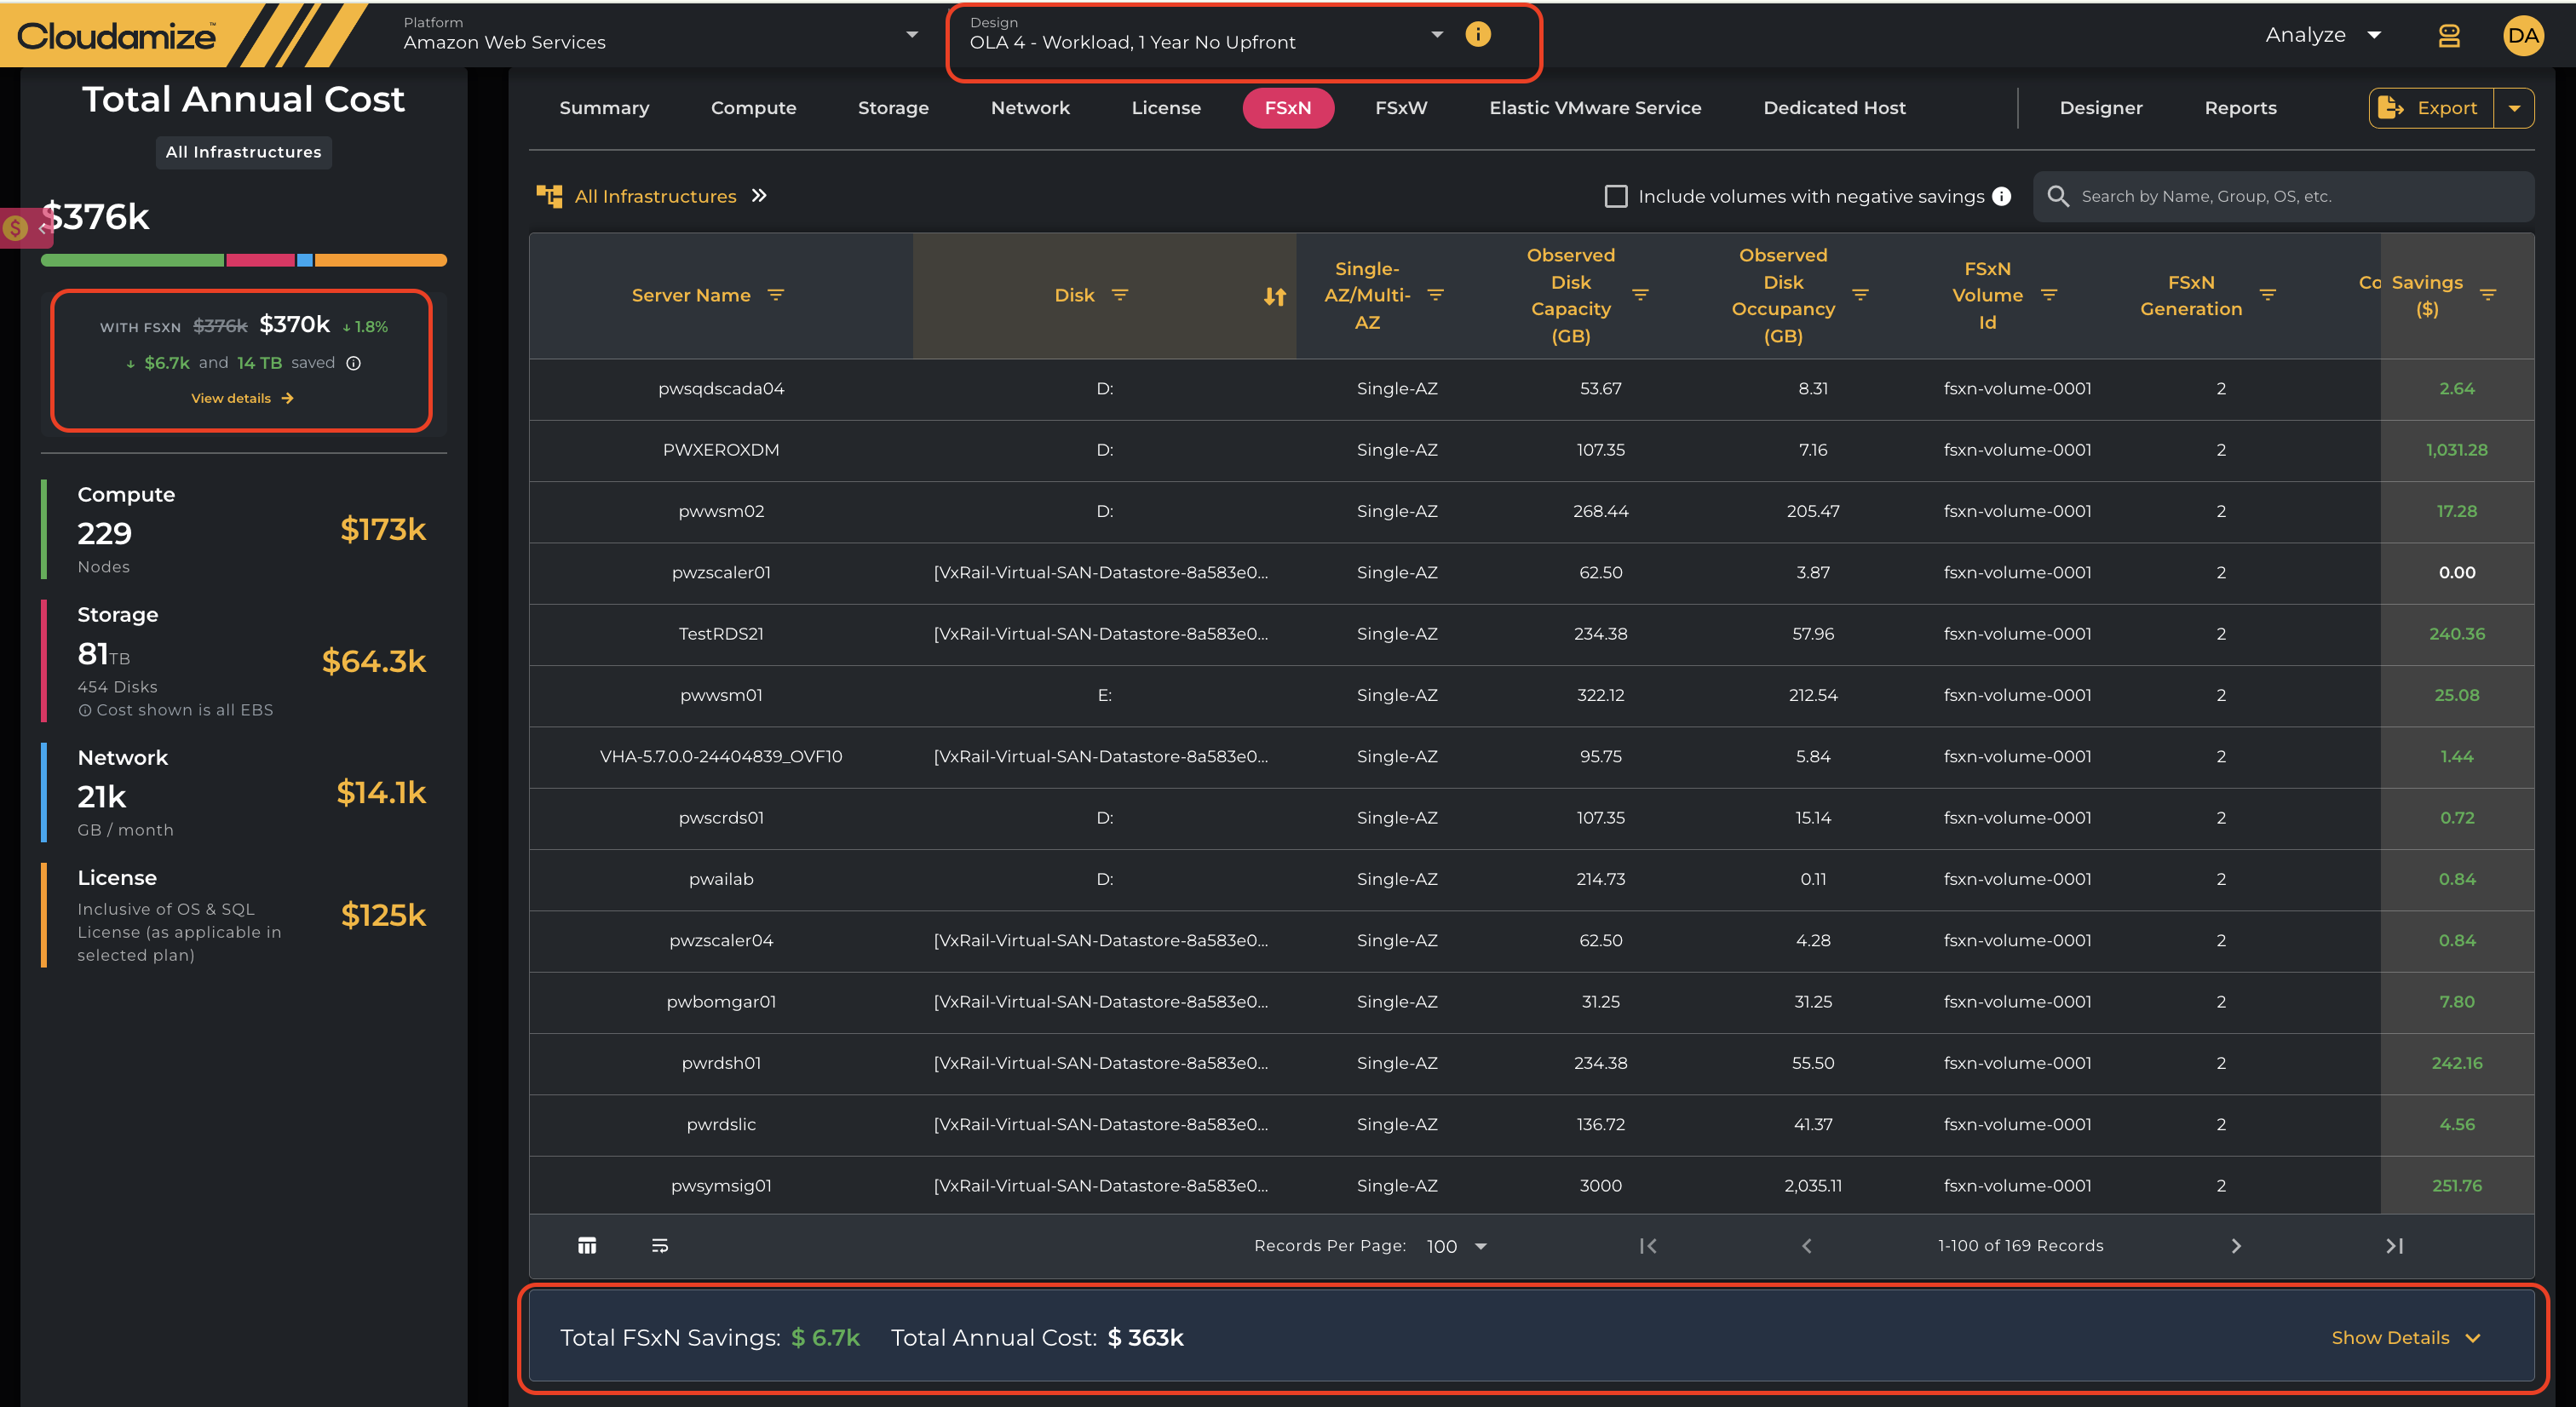
FSxN Savings Callout & Direct Navigation
When eligible storage volumes are identified under the active design profile, a dedicated savings highlight card appears on the left summary panel directly beneath the Total Annual Cost donut chart:
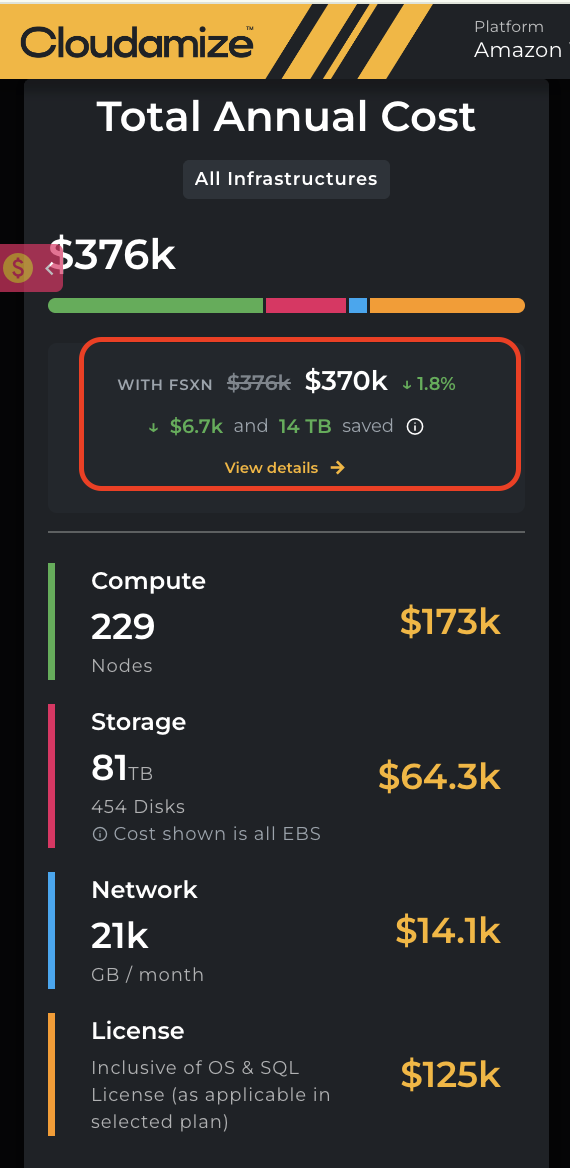
-
TCO Impact Badge: Displays baseline TCO struck through next to the newly optimized annual spend (e.g.,
~$376k $370k -1.8%). -
Net Savings Summary: Highlights the net financial savings and total storage footprint reduced (e.g.,
↓ $6.7k and 14 TB saved with FSxN). -
Direct Navigation (
View details →): Clicking theView details →link on the savings callout automatically opens the FSxN Tab in the main content area, providing immediate access to volume-level recommendations, Single-AZ/Multi-AZ deployment types, observed occupancy, and individual disk savings calculations.
Note on Design Selection:
Changing the selected Design Profile from the top menu toolbar instantly recalculates volume eligibility, refreshes the left panel TCO callout, and updates the detailed inventory rows within the FSxN Tab.
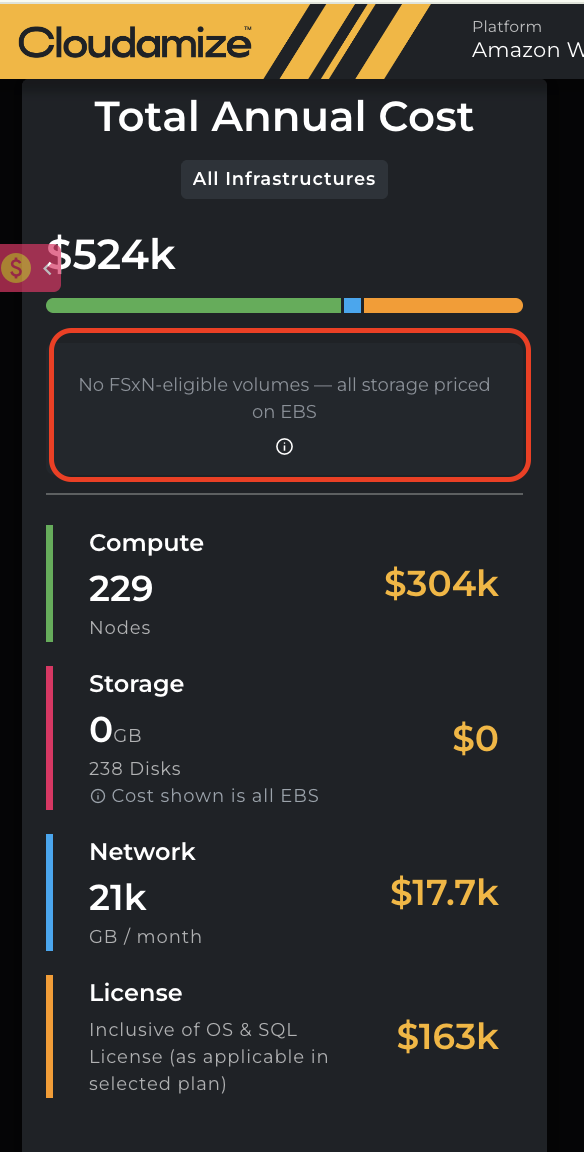
No Eligible Volumes Detected
If no storage volumes within the assessed infrastructure meet the qualification criteria for FSxN under the selected design profile:
-
Status Message: The summary panel displays the message:
No FSxN-eligible volumes — all storage priced on EBS -
Storage Line Item Impact: Under the Storage category breakdown, a sub-label clarifies:
ⓘ Cost shown is all EBS.
You can also directly select the FSxN tab to view the comprehensive asset and performance metrics as shown below.
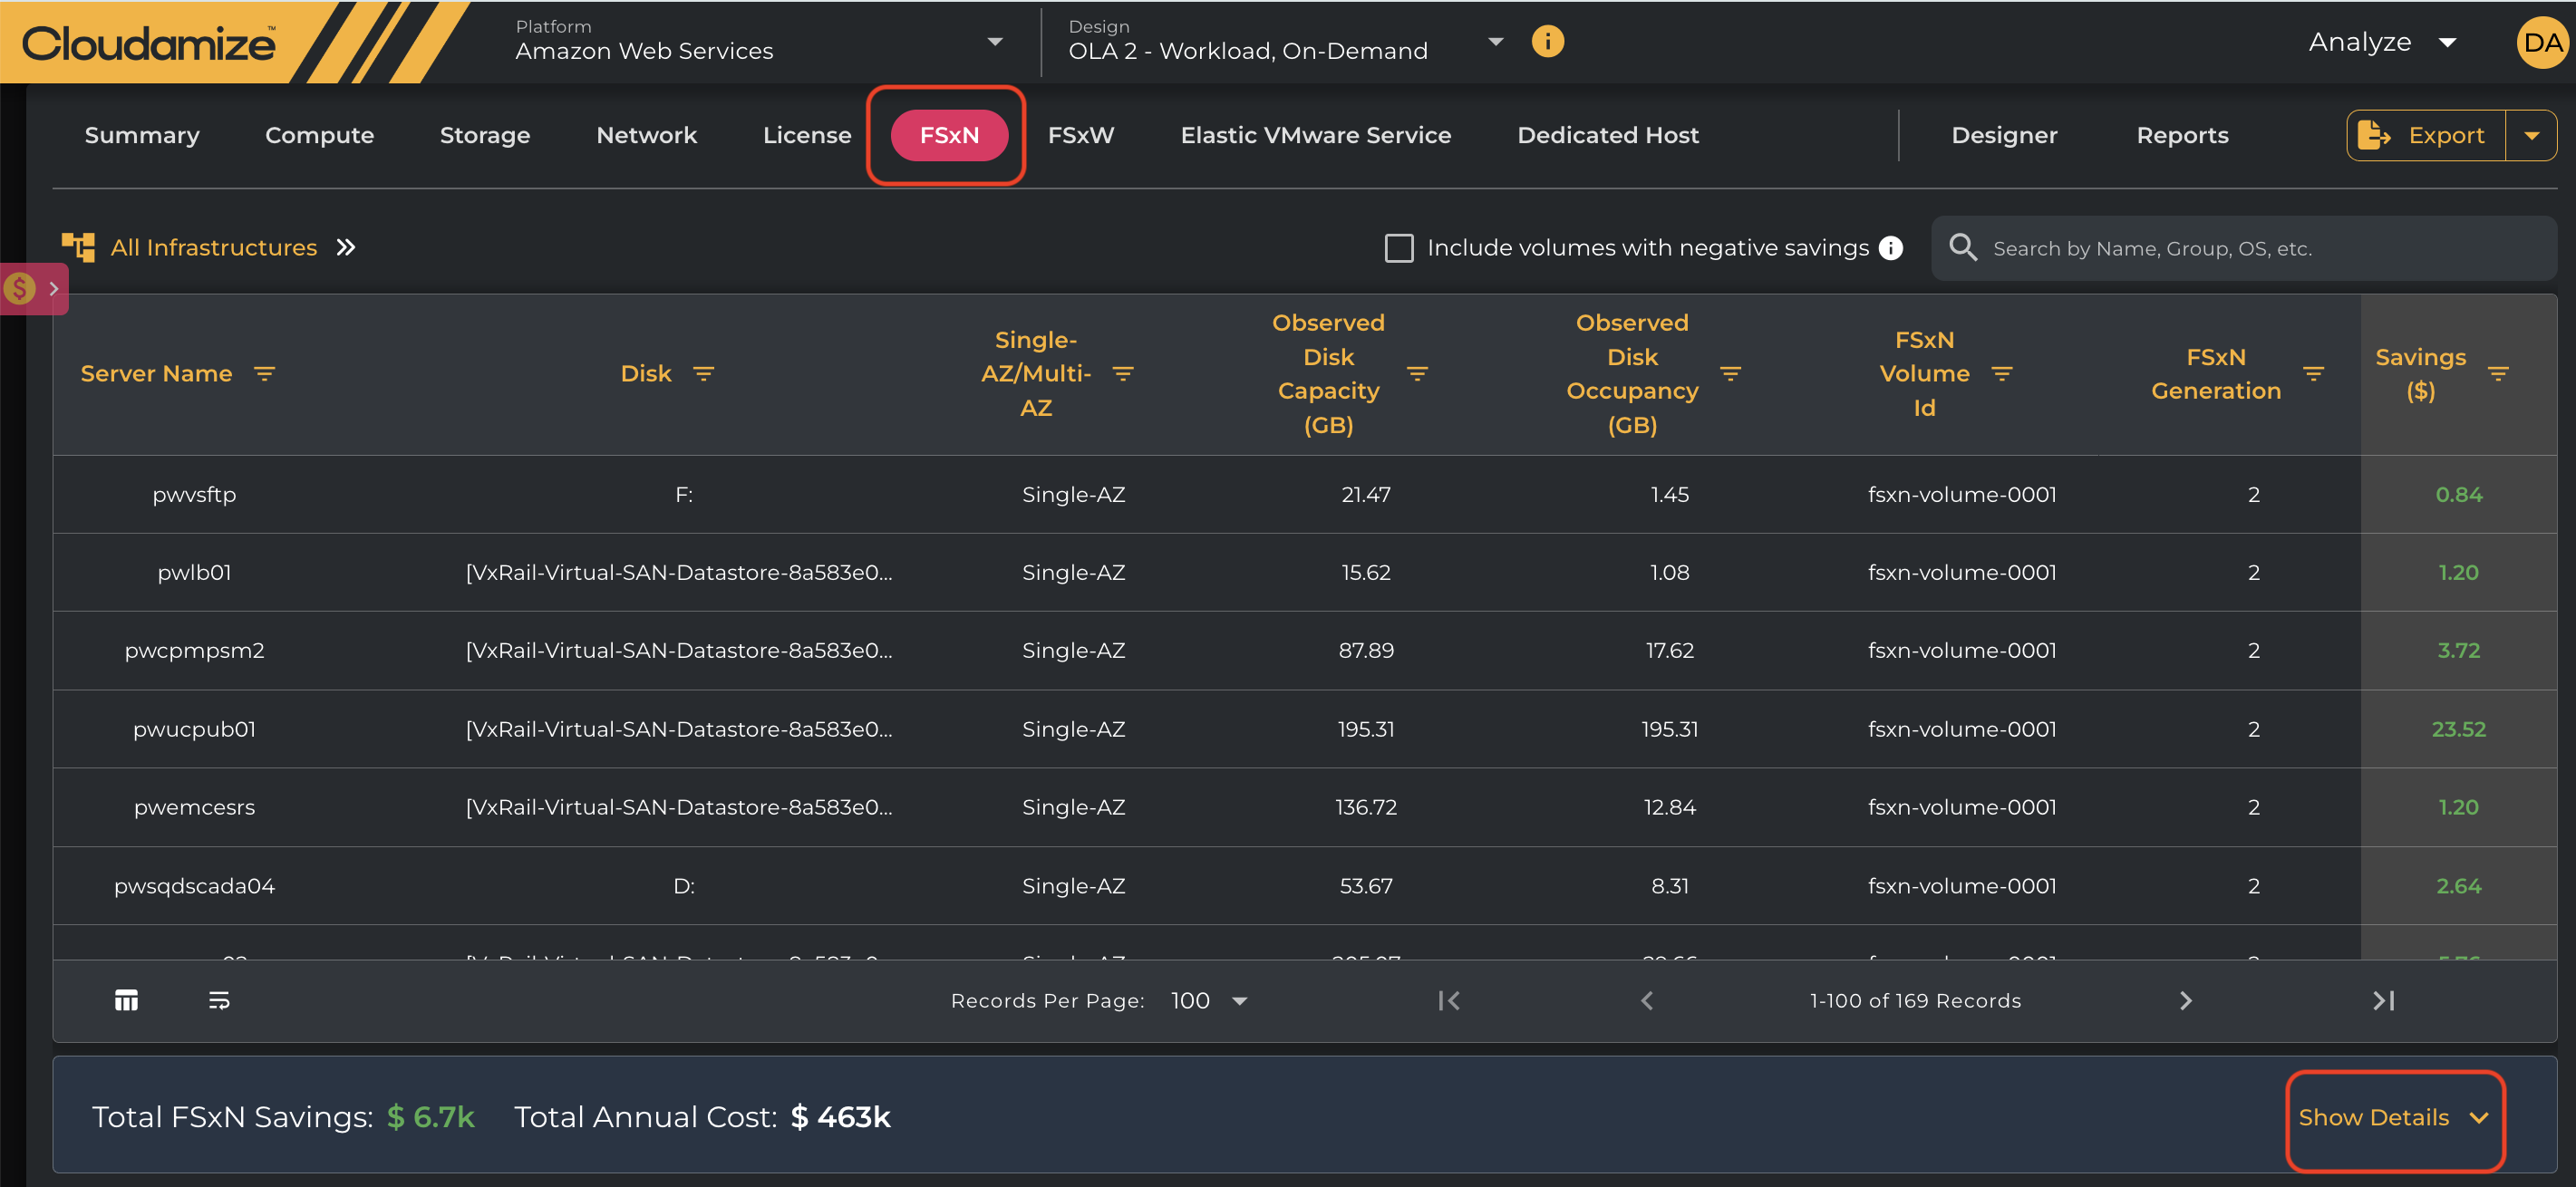

Include volumes with negative savings
-
By default, the Include volumes with negative savings option is unchecked. In this state, the Annual Cost is calculated using only volumes that generate positive FSxN savings compared to EBS.
-
When the Include volumes with negative savings option is selected, volumes where FSxN costs more than EBS are also included in the calculation. The Annual Cost is then recalculated to reflect both positive and negative savings volumes.
-
The Savings column is fixed (frozen) in the table view, ensuring it remains visible while scrolling horizontally across other columns.
-
Positive and negative savings values are visually distinguished through highlighting, making it easier to identify increases and decreases at a glance.
-
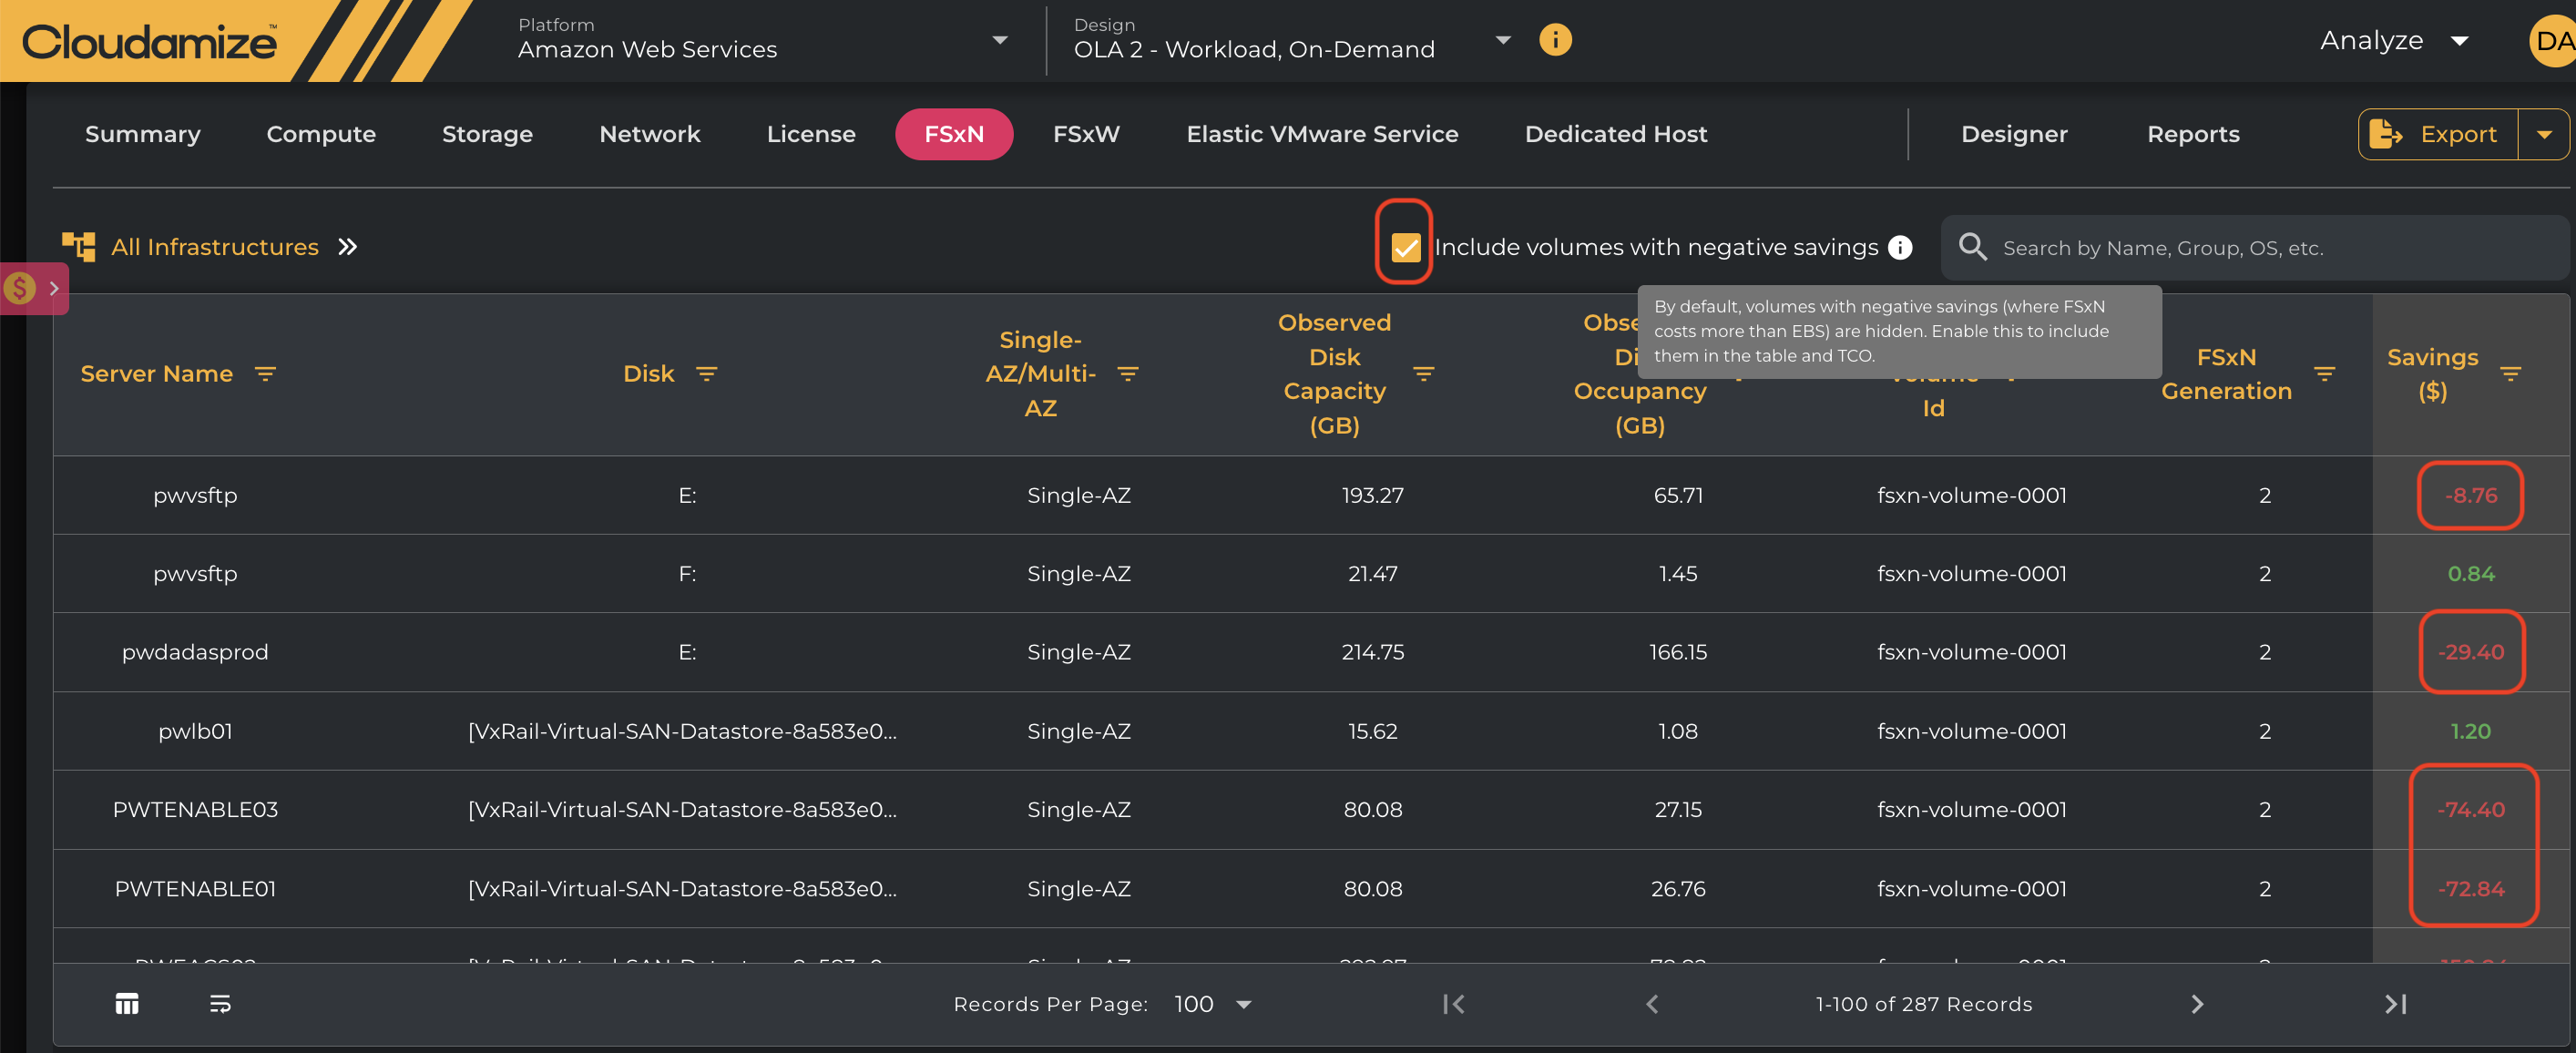

Column Definitions & Data Dictionary
|
Column Name |
Description |
|
Server Name |
The machine's hostname is associated with the analyzed workload. |
|
Disk |
The specific identifier or path of the analyzed on-premises disk/volume. |
|
Single-AZ/Multi-AZ |
Indicates whether the recommended FSxN deployment is Single-AZ (within one Availability Zone) or Multi-AZ (highly available across two AZs). |
|
Compression/Deduplication % |
The estimated percentage of storage savings derived from NetApp ONTAP's native data efficiency features. |
|
Observed Disk Capacity (GB) |
The total raw storage capacity allocated to the disk on-premises. |
|
Observed Disk Occupancy (GB) |
The actual used/occupied storage space is measured on the disk during the assessment period. |
|
FSxN Volume Id |
The unique identification number assigned by Cloudamize to map this recommendation. |
|
FSxN Generation |
Specifies the underlying hardware/software deployment generation recommended for the architecture. |
|
Total Recommended Storage (GB) |
The combined recommended total storage footprint (SSD + Capacity Pool) for the target FSxN volume. |
|
SSD Storage (GB) |
The portion of recommended storage allocated to the high-performance SSD tier (Primary tier). |
|
Capacity Pool Storage (GB) |
The portion of recommended storage allocated to the cost-optimized Capacity Pool tier (Cold/infrequently accessed data). |
|
Throughput (MBps) |
The expected throughput bandwidth provisioned for the FSxN file system in megabytes per second. |
|
Included IOPS |
The baseline SSD IOPS are automatically included with the provisioned storage capacity at no extra charge. |
|
Additional IOPS |
The amount of extra, custom-provisioned IOPS required to sustain peak workload demands beyond the baseline. |
|
SSD Storage Cost ($) |
The estimated monthly cost for the high-performance SSD storage tier. |
|
Capacity Pool Storage Cost ($) |
The estimated monthly cost for the capacity pool storage tier. |
|
Throughput Cost ($) |
The monthly cost associated with provisioning the recommended throughput capacity. |
|
Additional IOPS Cost ($) |
The monthly cost incurred from provisioning additional IOPS beyond the baseline allotment. |
|
Total FSxN Cost ($) |
The total estimated monthly cost of the entire optimized Amazon FSxN deployment (Sum of SSD, Capacity Pool, Throughput, and Additional IOPS costs). |
|
Total EBS Cost ($) |
The comparative monthly cost baseline if this storage workload were provisioned using traditional Amazon EBS block storage volumes. |
|
Savings ($) |
The projected net monthly cost savings achieved by migrating the workload to FSxN instead of traditional block storage (Total EBS Cost - Total FSxN Cost). |
Summary
|
Total FSxN Savings ($) |
Total estimated annual cost savings achieved by using Amazon FSx for NetApp ONTAP compared to the current storage and infrastructure costs. Calculated as the difference between current annual costs and projected FSxN costs. |
|
Total Annual Cost ($) |
Total current annual infrastructure cost, including compute, storage, networking, licensing, and other applicable expenses. |
|
Total Compute ($) |
Total cost associated with compute resources (servers, virtual machines, CPU, and memory) required to support the workload. |
|
Total Network ($) |
Total cost related to network usage and connectivity, including data transfer, bandwidth, and networking infrastructure charges. |
|
Total License ($) |
Total software licensing costs associated with the workload, such as operating systems, database licenses, and storage management software. |
|
Total FSxN Cost ($) |
Total projected annual cost of running the workload on Amazon FSx for NetApp ONTAP, including storage, throughput, backups, and any associated FSxN service charges. |
|
Total EBS for Root Volumes ($) |
Total cost of Amazon Elastic Block Store (EBS) volumes used as root (boot) disks for compute instances supporting the workload. |
|
Total Storage Cost ($) |
Total cost of storage resources, including primary data storage, backups, snapshots, and other storage-related services. |
If you have any queries, please get in touch with the helpdesk via our Helpdesk Portal or by email at helpdesk@cloudamize.com.